Explore Open Rooms

1 Contact details
2 What type of senior care service are you looking for?
3 What budget do you have in mind for senior care?
4 How soon do you need to find care?
5 Additional details

Thank you for your interest!

Our team will be in touch shortly to help with next steps.

Nursing Home

Pleasant Valley Healthcare Rehabilitation Center

Nursing Home

Pleasant Valley Healthcare Rehabilitation Center

1525 Pleasant Valley Rd, Garland, TX 75040 View map
Overview of Pleasant Valley Healthcare Rehabilitation Center

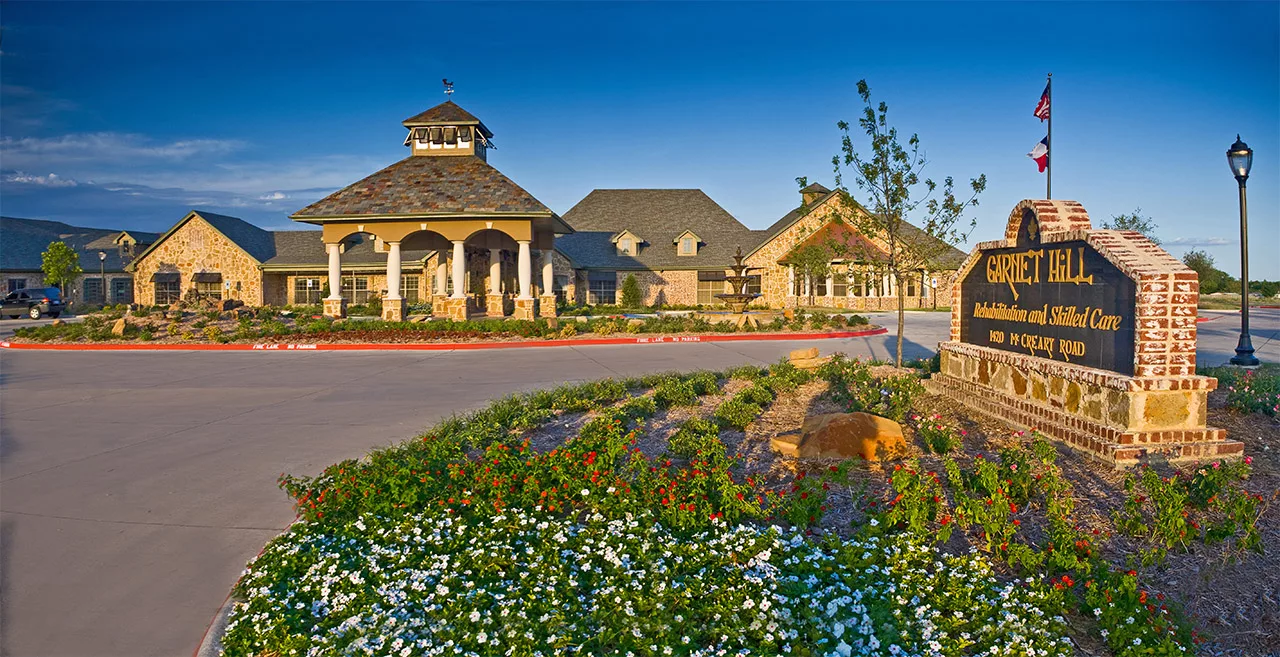
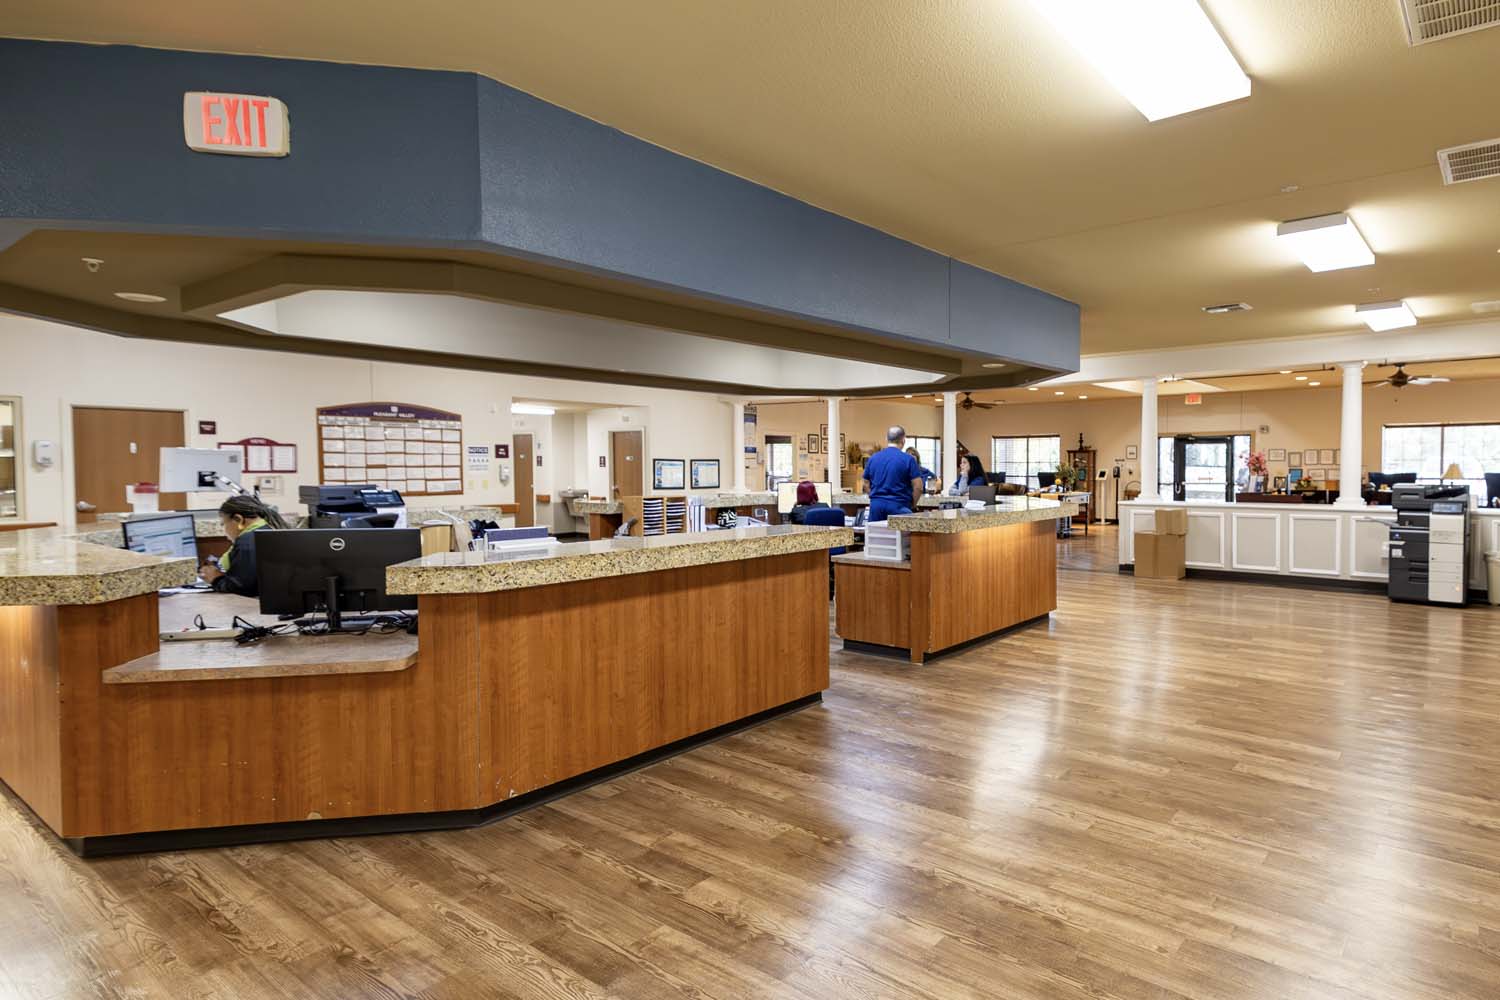
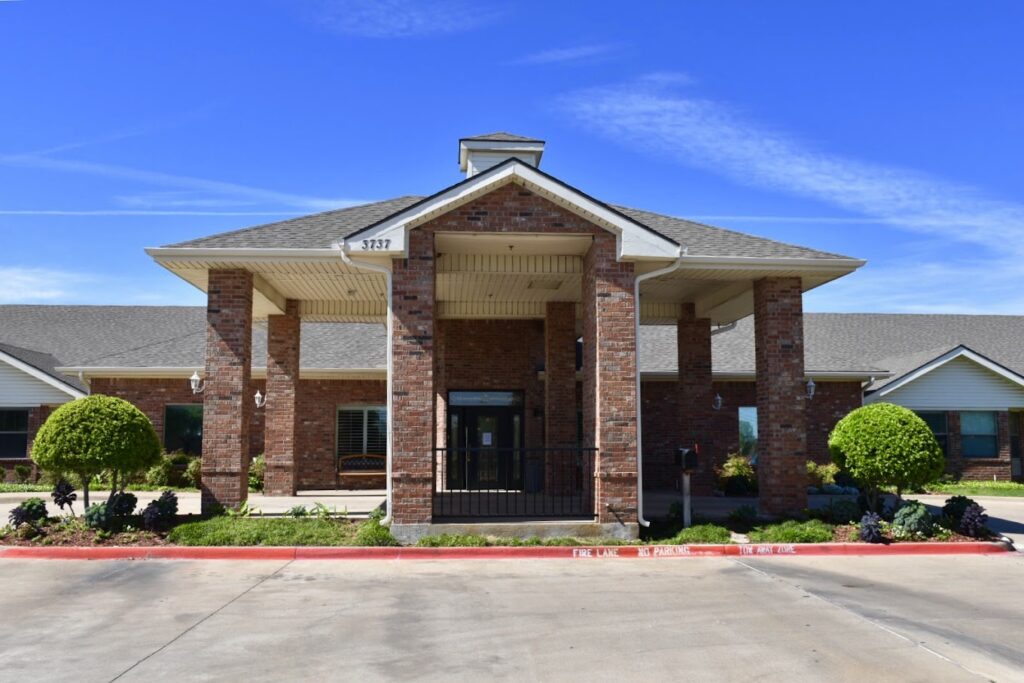
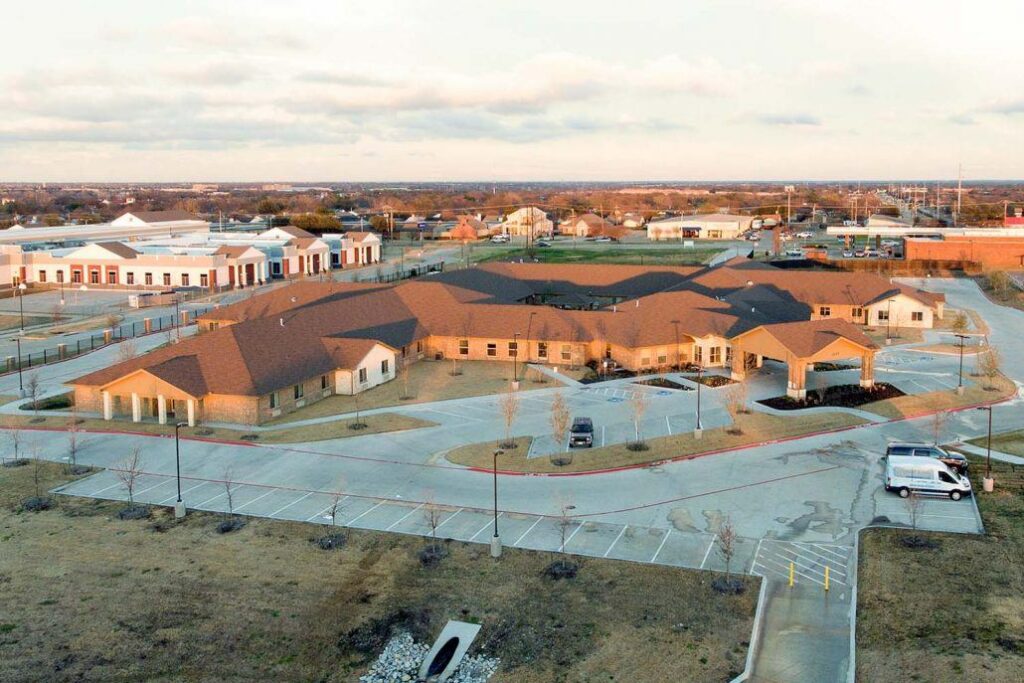
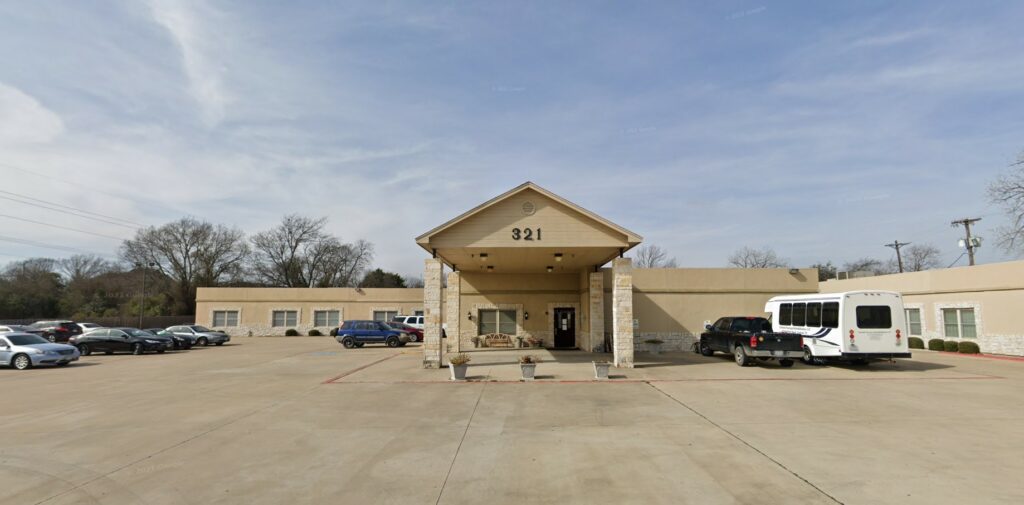
Situated in Garland, Texas, the Pleasant Valley Healthcare Rehabilitation Center exhibits senior care excellence with its state-of-the-art services. Renowned for providing exceptional care, the center adopts a safe, comfortable, and therapeutic approach to senior living. Encouraging residents to lead active lives, there is always a vibrant community atmosphere with engaging activities. The facility specializes in skilled nursing, offering both short-term rehabilitation and long-term care services, ensuring a comprehensive range of programs tailored to meet the individual needs of each resident.

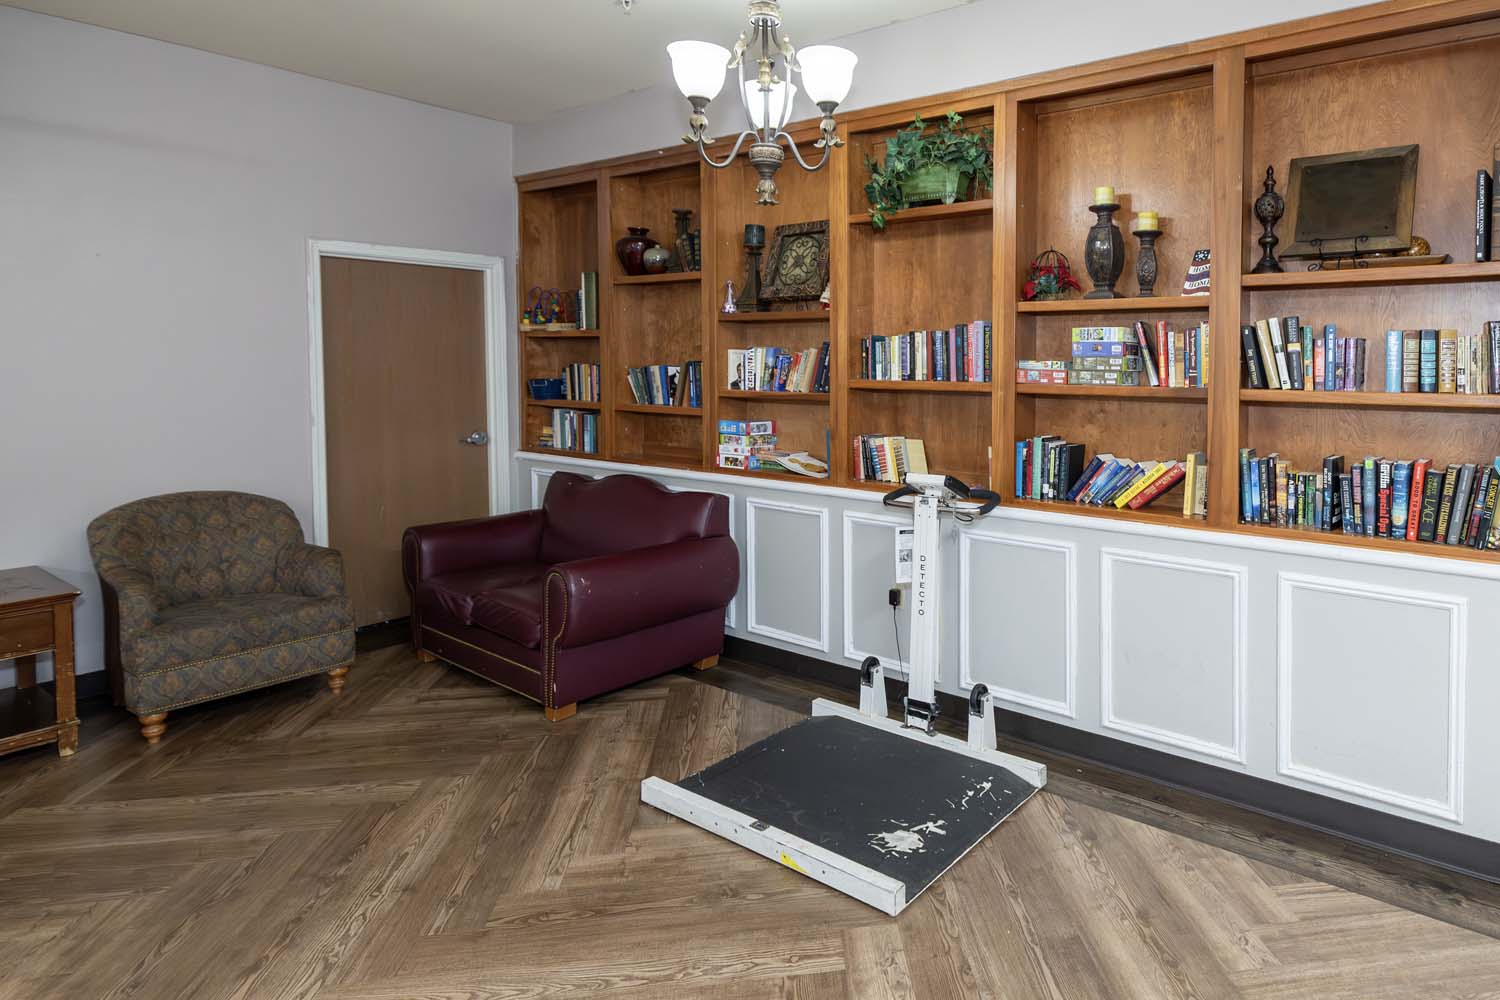
Moreover, they welcome individuals seeking respite care, reflecting the center’s commitment to flexibility and outstanding service. Residents at the Pleasant Valley Healthcare Rehabilitation Center can also anticipate not only excellent care but also a rich variety of activities and excursions, creating a dynamic and fulfilling living experience. This center stands as a testament to its dedication to enhancing the overall well-being of its residents through personalized and engaging healthcare services.

Quality ratings

Measured by Centers for Medicare & Medicaid Services (CMS)

Overall rating Info The Overall CMS Rating combines results from health inspections, staffing levels and quality measures. Health inspections carry the most weight. Staffing and quality scores can increase or decrease the final rating based on performance compared to state and national standards.
2/5
Texas average: 3.0/5
Health Inspection Info Based on the results of the facility's three most recent standard inspections and any complaint investigations. CMS reviews the number, scope, and severity of deficiencies, with more recent findings weighted more heavily.
2/5
Texas average: 2.9/5
Staffing Info Measures average nursing staff hours per resident per day, including Registered Nurses (RNs) and total nursing staff. Ratings are adjusted based on the level of care residents require and are compared to state and national benchmarks.
2/5
Texas average: 2.4/5
Quality Measures Info Based on clinical and physical health indicators reported to CMS, such as hospital readmissions, falls, pressure ulcers, and improvements in mobility. These measures reflect how well residents' health needs are being managed.
4/5
Texas average: 4.0/5

Nursing care per resident

Info This shows how many total hours of nursing staff time are available per resident each day. Higher numbers usually mean more staff support.
3h 35m per day

This home provides 5% less nursing time per resident than the Texas average.

Texas average: 3h 46m per day

Staffing hours breakdown

Info Hours of care per resident per day, broken down by staff type. Data from CMS Medicare.
Staff type Facility State avg National avg
Registered Nurse (RN) Info Registered nurse hours per resident per day. 26m per day 26m per day 41m per day
Nurse Aide Info Nurse aide hours per resident per day. 1h 43m per day 2h 1m per day 2h 21m per day
Total Nursing (Weekend) Info Total number of nurse staff hours per resident per day on weekends. 2h 44m per day 2h 59m per day 3h 26m per day
Physical Therapist Info Physical therapist staff hours per resident per day. 10m per day 4m per day 4m per day
RN (Weekend) Info Registered nurse hours per resident per day on weekends. 26m per day 21m per day 29m per day

Capacity and availability

Medium-capacity home

Offers a balance of services and community atmosphere.

Total beds 124

This home usually has availability

Lower occupancy suggests more openings may be available.

Lower demand than the Texas average
Occupancy rate 52%
Residents per day (avg) 78
Occupancy rate
52%
Residents per day (avg)
78

Who this home usually serves

TYPE OF STAY

Primarily short stays

Residents typically stay for brief periods, with frequent admissions and discharges throughout the year.

Might be optimal for
Post-acute recovery Temporary care Transitional stays

Breakdown by payment type

Medicare

24% of new residents, usually for short-term rehab.

Typical stay 27 days

Private pay

61% of new residents, often for short stays.

Typical stay 1 - 2 months

Medicaid

15% of new residents, often for long-term daily care.

Typical stay 1 - 2 years

Finances and operations

Governmental community
Operated by state authorities.
Home revenue
$11.9M
Surplus of revenue
$37.0K
Governmental community Operated by state authorities.
Home revenue
$11,922,423.00
Surplus of revenue
$37,038.00
Payroll costs Info The portion of the home's budget spent on staff, including nurses, caregivers, and other employees who support care and operations.
$4.6M
38.9% of revenue
Other operating costs Info All remaining costs needed to run the home, such as food, utilities, building maintenance, supplies and administrative expenses.
$7.2M
Total costs $11.9M
Bed community size
124-bed community
A larger shared setting that may offer more common spaces and organized community services.
Years in operation
52 years in operation
A longer operating history, which may indicate experience navigating regulations and delivering ongoing care.
Walk Score
Walk Score: 44 / 100
Somewhat walkable. A few nearby services may be reachable on foot, but most trips require transportation.

Services

Medicare/medicaid

About this community

License details

Facility type
Nursing
Status Active
Issuance January 7, 2025
Expiration January 7, 2028
County: DALLAS

Additional licensing details

License number: 308703
Year opened: 7/27/1973

Ownership & operating entity

Pleasant Valley Healthcare Rehabilitation Center is administrated by ZACHARY GEHRING.

Management company: PRIMROSE HEALTHCARE, INC
Owner: EASTLAND MEMORIAL HOSPITAL DISTRICT
Ownership type: HOSPITAL DISTRICT/AUTHORITY

Type Of Units

Medicare
37 units
Medicaid and Medicare
87 units
Total beds
124 units

Staffing

Key information about the people who lead and staff this community.

Leadership

Contact: Cyril Msebe
Administrator email: [email protected]

Care Services

Accepts Medicaid
Accepts Medicare
Doctor on Staff
Nursing Services
Rehabilitation Services
Skilled Nursing
Licensed Nurses/CNAs
24-Hour Staffing

Programs & Activities

Specific Programs
In-House Therapy, Skilled Nursing, Stay Active

Types of Care at Pleasant Valley Healthcare Rehabilitation Center

Skilled Nursing Respite Care
Contact Pleasant Valley Healthcare Rehabilitation Center

Access & Eligibility

Ways to qualify for care at this community, including accepted programs and payment options.

Medicaid Accepted

This facility is certified for eligible Medicaid services.

Medicare Accepted

This facility is certified for eligible Medicare services.

Payment & Funding Options

Medicaid Medicare

Inspection History

In Texas, the Health and Human Services Commission (HHSC) is the primary regulatory body that conducts unannounced inspections and publishes quality reports for all long-term care homes.

12 visits/inspections

3 visits/inspections triggered by complaints

5 routine inspections

Results

9 with issues

3 without issues

Latest inspection

Date:December 19, 2025
Type:Other

34 deficiencies

Deficiencies indicate regulatory issues. A higher number implies the facility had several areas requiring improvement.

Health Inspection History

Inspections
Total health inspections 9

Texas average 7.4


Last Health inspection on Apr 2025

Total health citations 24

Texas average 25.9

Citations per inspection
2.67

Texas average 3.67


Health citations are formal notices following inspections when they fail to comply with safety and care standards.

10 of 24 citations resulted from standard inspections; 10 of 24 resulted from complaint investigations; and 4 of 24 came from combined inspections (standard and complaint).

Breakdown of citation severity (last 3 years)
Critical Health citations More info 3
50% worse than Texas average

Texas average: 2


Serious Health citations More info 0
100% better than Texas average

Texas average: 0.4

3 critical citations More info Texas average: 2

0 serious citations More info Texas average: 0.4

21 moderate citations More info Texas average: 23

0 minor citations More info Texas average: 0.4
Citations history (last 3 years)
Infection Control moderate citation Info Issues related to preventing and controlling infections, including hygiene practices and safety protocols. Apr 25, 2025
Corrected

Nutrition moderate citation Info Issues related to food quality, meal service, and resident's nutritional needs. Apr 25, 2025
Corrected

Nutrition moderate citation Info Issues related to food quality, meal service, and resident's nutritional needs. Apr 25, 2025
Corrected

Quality of Care moderate citation Info Issues related to how well residents receive appropriate treatment and support for their medical and daily care needs. Apr 25, 2025
Corrected

Compare Nursing Homes around Garland The information below is reported by the Texas Health and Human Services Commission.

5 facilities compared · CMS & TX Dept. of Health data · Updated Mar 2026

Winters Park Nursing and Rehabilitation Center
NH

Nursing Home Licensed facility providing 24/7 skilled nursing care for residents with complex, ongoing medical needs. Staffed by RNs, LPNs, and CNAs. Inspected and star-rated annually by CMS. Accepts Medicare (short-term rehab) and Medicaid (long-term care).

RC

Respite Care Short-term temporary care — days to weeks — to give family caregivers a break. Full care provided during the stay. Often used after hospitalization or to trial a facility before a permanent placement decision.

Garland
132
55.1%
-13%
3.83
-36%
+6%
2
19
4
75
-
49
Zaid, Musaab
$9,5M
$3,8M
39.9%
676039
Legend Oaks Healthcare & Rehabilitation
NH

Nursing Home Licensed facility providing 24/7 skilled nursing care for residents with complex, ongoing medical needs. Staffed by RNs, LPNs, and CNAs. Inspected and star-rated annually by CMS. Accepts Medicare (short-term rehab) and Medicaid (long-term care).

Garland
132
60.3%
-5%
3.50
-9%
-4%
1
30
2
97
-
54
Duck Creek Healthcare, Inc.
$13,1M
$4,7M
36.1%
676413
Pleasant Valley Healthcare Rehabilitation Center
NH

Nursing Home Licensed facility providing 24/7 skilled nursing care for residents with complex, ongoing medical needs. Staffed by RNs, LPNs, and CNAs. Inspected and star-rated annually by CMS. Accepts Medicare (short-term rehab) and Medicaid (long-term care).

RC

Respite Care Short-term temporary care — days to weeks — to give family caregivers a break. Full care provided during the stay. Often used after hospitalization or to trial a facility before a permanent placement decision.

Garland
124
52.0%
-18%
3.58
-16%
-1%
4
24
3
78
-
44
Primrose Healthcare, Inc.
$11,9M
$4,6M
38.9%
675305
Advanced Health and Rehabilitation Center of Garland
MC

Memory Care Secured, specialized care for people living with Alzheimer's or dementia. Staff trained in cognitive impairment, with higher staff-to-resident ratios and an environment designed to reduce confusion and wandering risk.

NH

Nursing Home Licensed facility providing 24/7 skilled nursing care for residents with complex, ongoing medical needs. Staffed by RNs, LPNs, and CNAs. Inspected and star-rated annually by CMS. Accepts Medicare (short-term rehab) and Medicaid (long-term care).

RC

Respite Care Short-term temporary care — days to weeks — to give family caregivers a break. Full care provided during the stay. Often used after hospitalization or to trial a facility before a permanent placement decision.

Garland
139
86.4%
+36%
3.90
-21%
+7%
1
27
2
125
A+
51
Garland Hc Llc
$15,3M
$0,0M
0%
455731
Garland Nursing & Rehabilitation Center
NH

Nursing Home Licensed facility providing 24/7 skilled nursing care for residents with complex, ongoing medical needs. Staffed by RNs, LPNs, and CNAs. Inspected and star-rated annually by CMS. Accepts Medicare (short-term rehab) and Medicaid (long-term care).

Garland
109
56.4%
-11%
3.17
+63%
-13%
3
42
7
65
-
52
Slp Garland, Llc
$6,8M
$3,1M
45.1%
675790

Places of interest near Pleasant Valley Healthcare Rehabilitation Center

Address 3.7 miles from city center — 9.69 miles to nearest hospital (Texas Health Presbyterian Hospital Dallas)

Address 1525 Pleasant Valley Rd, Garland, TX 75040

Calculate Travel Distance to Pleasant Valley Healthcare Rehabilitation Center

Add your location

Address

Staffing Data (Q2 2025)

This data corresponds to Q2 2025 and is based on CMS Payroll-Based Journal.

Total staff 128
Employees 128
Contractors 0
Staff to resident ratio 1.66:1
10% better than Texas average

Texas average ratio: 1.51:1

Avg staff/day 45
Average shift 8.2 hours
0% compared with Texas average

Texas average: 8.1 hours

Total staff hours (quarter) 33,705
Nursing staff breakdown
Registered Nurse

Manages medical care and health needs.

Total count 8
Average shift length Info Average shift length. Calculated as total hours divided by days worked and average staff per day. 7.9 hours

No contractors work on this role.

Licensed Practical Nurse

Assists with medical care and medications.

Total count 23
Average shift length Info Average shift length. Calculated as total hours divided by days worked and average staff per day. 9.1 hours

No contractors work on this role.

Certified Nursing Assistant

Helps with daily care and mobility.

Total count 23
Average shift length Info Average shift length. Calculated as total hours divided by days worked and average staff per day. 8.6 hours

No contractors work on this role.

Contractor staffing

Total hours from contractors

0%

0 contractor hours this quarter

No contractor roles were reported this quarter.

Staff by category
Certified Nursing Assistant230236,99791100%8.6
Licensed Practical Nurse230234,99491100%9.1
Nurse Aide in Training8084,21391100%8.4
Medication Aide/Technician8082,53591100%9.2
Registered Nurse8082,23991100%7.9
RN Director of Nursing100101,9928695%7.8
Physical Therapy Assistant7071,8908088%7.5
Qualified Social Worker5051,8667077%7.6
Speech Language Pathologist7071,81591100%7.1
Respiratory Therapy Technician7071,4837380%7.7
Dental Services Staff5058657987%7
Physical Therapy Aide8086848391%6
Nurse Practitioner1015856571%9
Administrator1015206571%8
Dietitian1015046369%8
Therapeutic Recreation Specialist2023614954%7.4
Clinical Nurse Specialist3031141516%6.7
Mental Health Service Worker101481011%4.8
23 Certified Nursing Assistant
% of Days 100%
23 Licensed Practical Nurse
% of Days 100%
8 Nurse Aide in Training
% of Days 100%
8 Medication Aide/Technician
% of Days 100%
8 Registered Nurse
% of Days 100%
10 RN Director of Nursing
% of Days 95%
7 Physical Therapy Assistant
% of Days 88%
5 Qualified Social Worker
% of Days 77%
7 Speech Language Pathologist
% of Days 100%
7 Respiratory Therapy Technician
% of Days 80%
5 Dental Services Staff
% of Days 87%
8 Physical Therapy Aide
% of Days 91%
1 Nurse Practitioner
% of Days 71%
1 Administrator
% of Days 71%
1 Dietitian
% of Days 69%
2 Therapeutic Recreation Specialist
% of Days 54%
3 Clinical Nurse Specialist
% of Days 16%
1 Mental Health Service Worker
% of Days 11%

Facility Characteristics

Source: CMS Long-Term Care Facility Characteristics (Data as of Jan 2026)

Total census
77 residents
Residents by payment source
Medicare
19 residents (24.7%)
Medicaid
48 residents (62.3%)
Private pay or other
10 residents (13%)
Programs & Services
Residents' Group

Residents meet regularly to discuss policies, care quality, and activities

Active Resident Council

Organized group of residents that meets regularly to discuss facility policies, quality of life, and activities.

Quality of care over time

These measures show how residents usually do over time at this home, based on health outcomes and preventive care.

High-risk clinical events score Info A composite score based on pressure ulcers, falls with injury, weight loss, walking ability decline, and activities of daily living decline. 6.7
22% better than Texas average

Texas average: 8.6

Functional decline score Info A composite score based on activities of daily living decline, walking ability decline, and incontinence. 17.8
11% worse than Texas average

Texas average: 16.0

Long-stay resident measures
Significantly above average Texas avg: 4.2 Info CMS star rating based on long-stay quality measure performance. 5 stars = significantly above average, 1 star = significantly below average.
Need for Help with Daily Activities Increased Info Percent of long-stay residents whose need for help with daily activities has increased 15.5%
In line with Texas average

Texas average: 16.2%

Walking Ability Worsened Info Percent of long-stay residents whose ability to move independently worsened 7.7%
52% better than Texas average

Texas average: 16.2%

Low Risk Residents with Bowel/Bladder Incontinence Info Percent of low risk long-stay residents who lose control of their bowels or bladder 30.2%
93% worse than Texas average

Texas average: 15.7%

Falls with Major Injury Info Percent of long-stay residents experiencing one or more falls with major injury 0.4%
87% better than Texas average

Texas average: 3.2%

High Risk Residents with Pressure Ulcers Info Percent of long-stay high risk residents with pressure ulcers 4.6%
In line with Texas average

Texas average: 4.4%

Urinary Tract Infection Info Percent of long-stay residents with a urinary tract infection 0.0%
100% better than Texas average

Texas average: 0.8%

Lost Too Much Weight Info Percent of long-stay residents who lose too much weight 5.1%
48% worse than Texas average

Texas average: 3.5%

Depressive Symptoms Info Percent of long-stay residents who have depressive symptoms 1.4%
52% better than Texas average

Texas average: 2.9%

Antipsychotic Use Info Percent of long-stay residents who received an antipsychotic medication 0.5%
93% better than Texas average

Texas average: 7.9%

Pneumococcal Vaccine Info Percent of long-stay residents assessed and appropriately given the pneumococcal vaccine 96.7%
In line with Texas average

Texas average: 97.3%

Influenza Vaccine Info Percent of long-stay residents assessed and appropriately given the seasonal influenza vaccine 98.5%
In line with Texas average

Texas average: 97.9%

Hospitalizations per 1,000 days Info Number of hospitalizations per 1,000 long-stay resident days. 1.24
42% better than Texas average

Texas average: 2.13

ED visits per 1,000 days Info Number of outpatient emergency department visits per 1,000 long-stay resident days. 1.09
47% better than Texas average

Texas average: 2.07

Short-stay resident measures
Average Texas avg: 2.9 Info CMS star rating based on short-stay quality measure performance. 5 stars = much above average, 1 star = much below average.
Pneumococcal Vaccine Info Percent of short-stay residents assessed and appropriately given the pneumococcal vaccine 76.7%
15% worse than Texas average

Texas average: 90.4%

Antipsychotic medication increase Info Percent of short-stay residents who newly received an antipsychotic medication 0.0%
100% better than Texas average

Texas average: 1.4%

Influenza Vaccine Info Percent of short-stay residents assessed and appropriately given the seasonal influenza vaccine 58.5%
34% worse than Texas average

Texas average: 88.0%

Re-hospitalized after SNF stay Info Percentage of short-stay residents who were re-hospitalized after their nursing home admission. 22.7%
12% better than Texas average

Texas average: 25.9%

Emergency department visits Info Percentage of short-stay residents who had an outpatient emergency department visit. 10.2%
15% better than Texas average

Texas average: 12.0%

Falls with major injury Info Percentage of SNF residents who experience falls with major injury during their stay. 0.0%
100% better than Texas average

Texas average: 0.8%

Ability to care for self at discharge Info Percentage of residents at or above expected ability to care for themselves at discharge. 46.9%
13% worse than Texas average

Texas average: 53.7%

Successful return to home or community Info Rate of successful return to home or community from a skilled nursing facility. 47.2%
7% worse than Texas average

Texas average: 50.6%

Penalties and fines

Federal penalties imposed by CMS for regulatory violations, including civil money penalties (fines) and denials of payment for new Medicare/Medicaid admissions.

Source: CMS Penalties Database (Data as of Jan 2026)

Total fines amount $73K
9% lower than Texas average

Texas average: $80K

Number of fines 4
61% more fines than Texas average

Texas average: 2.5

Payment Denials Info Serious action where Medicare and/or Medicaid temporarily stops payments for new residents until issues are fixed. 0
100% fewer payment denials than Texas average

Texas average: 0.2

Fines amount comparison
This facility $73K
Texas average $80K
Penalty History

Penalties are imposed by CMS for violations of federal nursing home regulations.

Civil Money Penalty Info Fines imposed for noncompliance, which can be assessed per day or per instance of violation. Sep 14, 2024
$20K
Civil Money Penalty Info Fines imposed for noncompliance, which can be assessed per day or per instance of violation. Nov 24, 2023
$33K
Civil Money Penalty Info Fines imposed for noncompliance, which can be assessed per day or per instance of violation. Jan 19, 2023
$10K
Civil Money Penalty Info Fines imposed for noncompliance, which can be assessed per day or per instance of violation. Jan 19, 2023
$10K

Last updated: Jan 2026

Guides for Better Senior Living

Care Cost Calculator: See Prices in Your Area

Nursing Home Data Explorer

Don’t Wait Too Long: 7 Red Flag Signs Your Parent Needs Assisted Living Now

The True Cost of Assisted Living in 2025 – And How Families Are Paying For It

Understanding Senior Living Costs: Pricing Models, Discounts & Financial Assistance

Financial Aid for Texas Seniors

Get financial aid guidance

Community Care for the Aged and Disabled (CCAD)

TX Medicaid CCAD

Age 65+ or disabled, Texas resident, Medicaid-eligible, care need (not always nursing home level).

~$2,829/month (300% FBR, individual).

$2,000 (individual), $3,000 (couple).

Large state; rural access challenges.

Texas Community Care Services

TX CCS

Age 60+, Texas resident, at risk of decline.

~$2,000/month (individual, varies).

$5,000 (individual).

Limited funding; high demand in urban areas.

Area Agency on Aging (AAA) Services

Texas AAA Services

Age 60+, TX resident; no income/asset limits.

None; donations encouraged.

Not assessed.

28 AAAs; includes Meals on Wheels in some areas.

Medicare Savings Program (MSP)

Texas Medicare Savings Program

Age 65+ or disabled, TX resident, Medicare Part A/B.

~$2,510/month (QMB), ~$3,380/month (SLMB), ~$3,598/month (QI)—individual.

$9,430 (individual), $14,130 (couple).

Includes Extra Help for Part D; no waitlist.

Low-Income Home Energy Assistance Program (LIHEAP)

Texas Comprehensive Energy Assistance Program (CEAP)

Age 60+ prioritized, TX resident, low-income.

~$3,970/month (185% FPL).

Not assessed.

Priority for elderly/disabled; covers gas, electric, propane.

Family Caregiver Support Program (FCSP)

Texas Family Caregiver Support Program

Caregivers of 60+ needing care or 55+ caregivers of others; TX resident; 2+ ADLs.

No strict cap; prioritizes low-income (~$24,980/year).

Not assessed.

High rural demand; includes grandparent caregivers.

Senior Community Service Employment Program (SCSEP)

Texas SCSEP

Age 55+, unemployed, low-income, TX resident.

~$1,983/month (125% FPL).

Not specified.

Priority for veterans, rural residents; AARP partnership.

VA Aid and Attendance (A&A) and Housebound Benefits

Texas VA Aid and Attendance/Housebound

Age 65+ or disabled veteran/spouse, TX resident, wartime service, ADL help (A&A) or homebound.

Net income < ~$1,984/month (veteran with dependent, A&A); pension offsets income.

~$155,356 (net worth).

High veteran population; supports rural/urban needs.

Property Tax Exemption for Seniors

Texas Senior Property Tax Exemption

Age 65+, TX resident, homeowner (homestead).

None; tax-based eligibility.

Not assessed.

$25,000+ exemption; optional freeze in some counties; saves ~$500-$1,000/year.

Senior Farmers’ Market Nutrition Program (SFMNP)

Texas SFMNP

Age 60+, TX resident, low-income.

~$2,322/month (185% FPL).

Not assessed.

Vouchers (~$50/season); serves ~20,000 via 28 AAAs.