Explore Open Rooms

1 Contact details
2 What type of senior care service are you looking for?
3 What budget do you have in mind for senior care?
4 How soon do you need to find care?
5 Additional details

Thank you for your interest!

Our team will be in touch shortly to help with next steps.

Nursing Home in Nashua

CMS overall rating Info The Overall CMS Rating combines results from health inspections, staffing levels and quality measures. Health inspections carry the most weight. Staffing and quality scores can increase or decrease the final rating based on performance compared to state and national standards.

Premier Rehab and Healthcare

55 Harris Rd, Nashua, NH 03062 View map
Overview of Premier Rehab and Healthcare

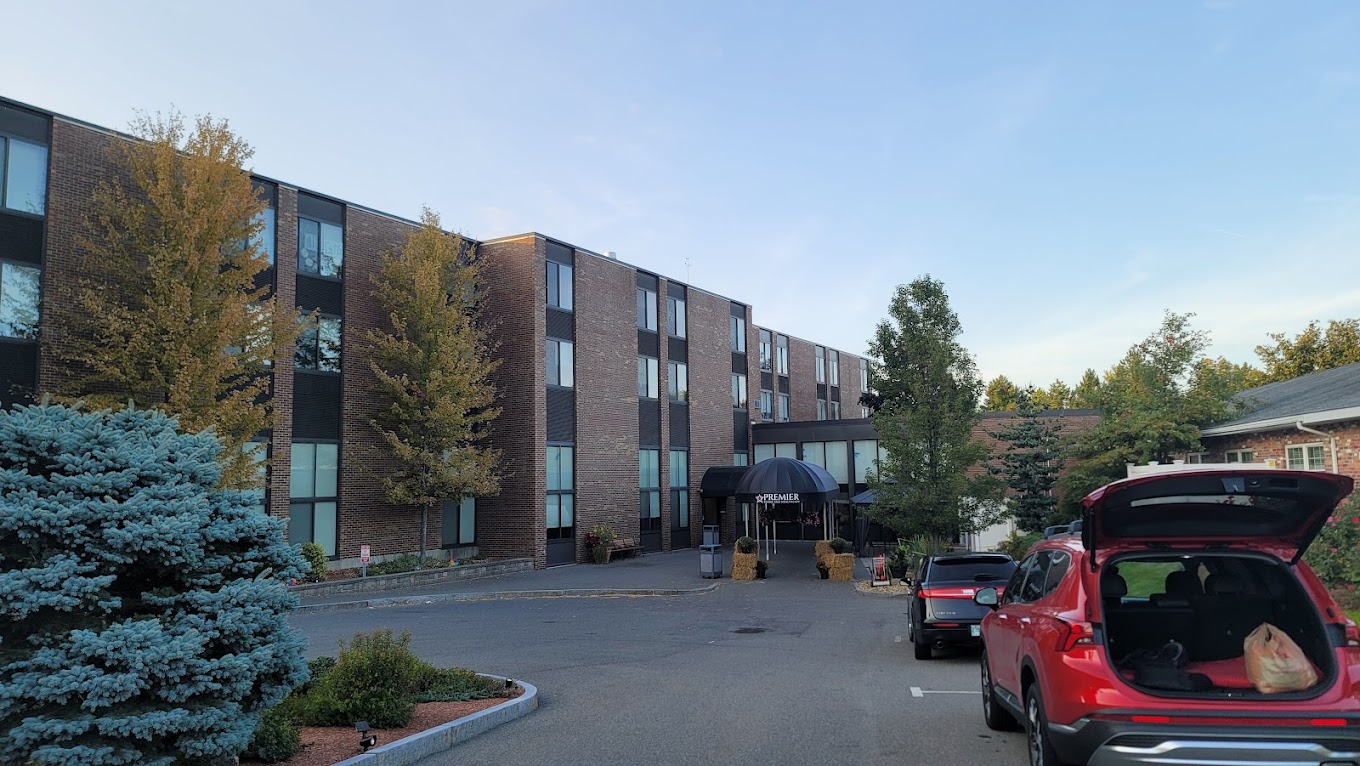
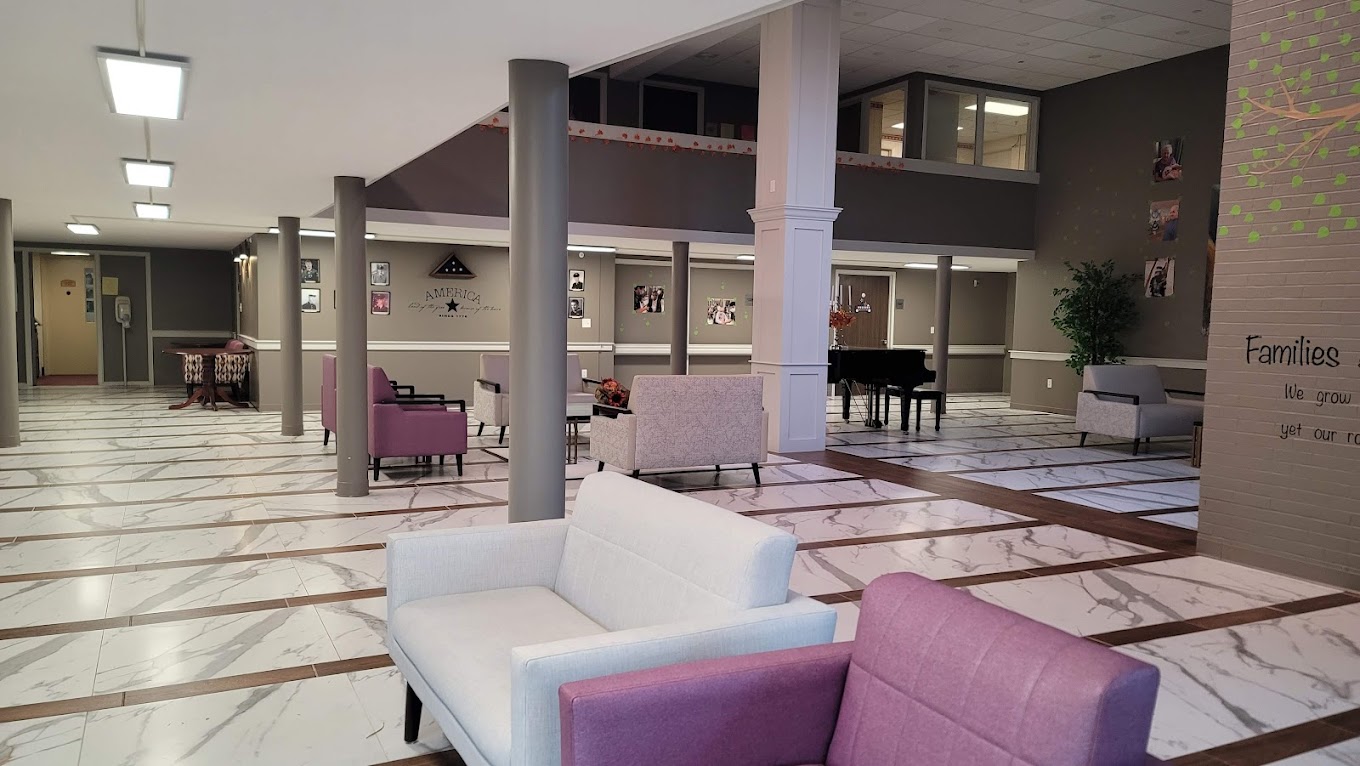
Premier Rehab and Healthcare provides exceptional nursing home care in the heart of Nashua, New Hampshire. From intensive short-term rehabilitation therapy to comprehensive long-term respiratory care, they offer a full range of services designed to meet every individual’s unique needs. With round-the-clock skilled nursing available, you can rest assured that compassionate and experienced professionals are always there to attend to your needs.

Additionally, they specialize in Alzheimer’s and dementia care, offering a supportive and understanding environment for those facing memory-related challenges. From IV therapy to dialysis, cardiac care to oncology care, their expertise extends to a wide range of medical conditions, ensuring that residents receive the highest level of support from an interdisciplinary team of specialists.

(603) 888-1573

Quality ratings

Measured by Centers for Medicare & Medicaid Services (CMS)

Overall rating Info The Overall CMS Rating combines results from health inspections, staffing levels and quality measures. Health inspections carry the most weight. Staffing and quality scores can increase or decrease the final rating based on performance compared to state and national standards.
1/5
New Hampshire average: 2.9/5
Health Inspection Info Based on the results of the facility's three most recent standard inspections and any complaint investigations. CMS reviews the number, scope, and severity of deficiencies, with more recent findings weighted more heavily.
1/5
New Hampshire average: 2.8/5
Staffing Info Measures average nursing staff hours per resident per day, including Registered Nurses (RNs) and total nursing staff. Ratings are adjusted based on the level of care residents require and are compared to state and national benchmarks.
4/5
New Hampshire average: 3.2/5
Quality Measures Info Based on clinical and physical health indicators reported to CMS, such as hospital readmissions, falls, pressure ulcers, and improvements in mobility. These measures reflect how well residents' health needs are being managed.
2/5
New Hampshire average: 3.1/5

Nursing care per resident

Info This shows how many total hours of nursing staff time are available per resident each day. Higher numbers usually mean more staff support.
3h 43m per day

This home provides 12% less nursing time per resident than the New Hampshire average.

New Hampshire average: 4h 13m per day

Capacity and availability

High-capacity home

May provide extensive amenities, services and programs.

Total beds 292

This home usually has availability

Lower occupancy suggests more openings may be available.

Lower demand than the New Hampshire average
Occupancy rate 81.5%
Residents per day (avg) 205
Occupancy rate
81.5%
Residents per day (avg)
205

Who this home usually serves

TYPE OF STAY

Mix of rehab and long-term care

This home supports both short-term rehab and long-term care, with residents staying for a wide range of durations.

Breakdown by payment type

Medicare

35% of new residents, usually for short-term rehab.

Typical stay 1 months

Private pay

42% of new residents, often for short stays.

Typical stay 1 months

Medicaid

24% of new residents, often for long-term daily care.

Typical stay 11 - 12 months

Finances and operations

Privately-owned community
Operated by a business corporation.
Home revenue
$35.3M
Profit
$591.0K
Privately-owned community Operated by a business corporation.
Home revenue
$35,251,239.00
Profit
$591,037.00
Payroll costs Info The portion of the home's budget spent on staff, including nurses, caregivers, and other employees who support care and operations.
$15.1M
42.9% of revenue
Other operating costs Info All remaining costs needed to run the home, such as food, utilities, building maintenance, supplies and administrative expenses.
$19.5M
Total costs $34.7M
Years in operation
34 years in operation
A longer operating history, which may indicate experience navigating regulations and delivering ongoing care.
Walk Score
Walk Score: 17 / 100
Car-dependent. Most errands require a car, with limited nearby walkable options.

Additional Licensing Details

CMS Certification Number305005

Staffing

Key information about the people who lead and staff this community.

Leadership

ContactMr. Damian Dell'Anno, Executive Officer

Types of Care at Premier Rehab and Healthcare

Nursing Home
Contact Premier Rehab and Healthcare

Inspection History

In New Hampshire, the Department of Health and Human Services, Health Facilities Administration is responsible for the unannounced inspection and licensing of all residential care and nursing facilities.

5 visits/inspections

2 routine inspections

Results

5 with issues

0 without issues

Latest inspection

Date November 21, 2025
Annual Inspection

42 deficiencies

Deficiencies indicate regulatory issues. A higher number implies the facility had several areas requiring improvement.

New Hampshire average: 17 deficiencies

Health Inspection History

Inspections
Total health inspections 4

New Hampshire average 3.5


Last Health inspection on Oct 2024

Total health citations 25

New Hampshire average 14.4

Citations per inspection
6.25

New Hampshire average 3.99


Health citations are formal notices following inspections when they fail to comply with safety and care standards.

24 of 25 citations resulted from standard inspections; and 1 of 25 resulted from complaint investigations.

Breakdown of citation severity (last 3 years)
Critical Health citations More info 0
100% better than New Hampshire average

New Hampshire average: 0.2


Serious Health citations More info 0
100% better than New Hampshire average

New Hampshire average: 0.1

0 critical citations More info New Hampshire average: 0.2

0 serious citations More info New Hampshire average: 0.1

21 moderate citations More info New Hampshire average: 12

4 minor citations More info New Hampshire average: 2
Citations history (last 3 years)
Infection Control moderate citation Info Issues related to preventing and controlling infections, including hygiene practices and safety protocols. Oct 10, 2024
Corrected

Infection Control moderate citation Info Issues related to preventing and controlling infections, including hygiene practices and safety protocols. Oct 10, 2024
Corrected

Nutrition moderate citation Info Issues related to food quality, meal service, and resident's nutritional needs. Oct 10, 2024
Corrected

Nutrition moderate citation Info Issues related to food quality, meal service, and resident's nutritional needs. Oct 10, 2024
Corrected

Compare Nursing Homes around Nashua The information below is reported by the New Hampshire Department of Health and Human Services, Health Facilities Administration.

3 facilities compared · CMS & NH Dept. of Health data · Updated Apr 2026

Filter by care type
Fairview Senior Living
MC

Memory Care Secured, specialized care for people living with Alzheimer's or dementia. Staff trained in cognitive impairment, with higher staff-to-resident ratios and an environment designed to reduce confusion and wandering risk.

NH

Nursing Home Licensed facility providing 24/7 skilled nursing care for residents with complex, ongoing medical needs. Staffed by RNs, LPNs, and CNAs. Inspected and star-rated annually by CMS. Accepts Medicare (short-term rehab) and Medicaid (long-term care).

Hudson
101
93.5%
+15%
3.88
-2%
-9%
0
15
3.8
0
93
A+
43
Fg Healthcare Properties, Llc
$32.2M
$9.5M
29.5%
305100
The Courville at Nashua
AL

Assisted Living A licensed, long-term care setting for seniors or individuals with disabilities who need help with daily activities — like bathing, dressing, and medication management — but not 24-hour skilled nursing. Offers housing, meals, and around-the-clock support while aiming to maximize resident independence.

NH

Nursing Home Licensed facility providing 24/7 skilled nursing care for residents with complex, ongoing medical needs. Staffed by RNs, LPNs, and CNAs. Inspected and star-rated annually by CMS. Accepts Medicare (short-term rehab) and Medicaid (long-term care).

Nashua
94
75.8%
-7%
3.64
+56%
-15%
0
8
2.7
0
68
-
57
Courville, Richard
$13.5M
$4.4M
32.9%
305037
Premier Rehab and Healthcare
NH

Nursing Home Licensed facility providing 24/7 skilled nursing care for residents with complex, ongoing medical needs. Staffed by RNs, LPNs, and CNAs. Inspected and star-rated annually by CMS. Accepts Medicare (short-term rehab) and Medicaid (long-term care).

Nashua
292
81.5%
0%
3.71
+32%
-13%
0
25
6.3
0
205
-
17
Greenhalgh, Katrina
$34.1M
$15.1M
44.4%
305005

Places of interest near Premier Rehab and Healthcare

Address 2.8 miles from city center — 1.17 miles to nearest hospital (St. Joseph Hospital)

Address 55 Harris Rd, Nashua, NH 03062

Calculate Travel Distance to Premier Rehab and Healthcare

Add your location

Address

Staffing Data (Q2 2025)

This data corresponds to Q2 2025 and is based on CMS Payroll-Based Journal.

Total staff 361
Employees 312
Contractors 49
Staff to resident ratio 1.64:1
12% worse than New Hampshire average

New Hampshire average ratio: 1.87:1

Avg staff/day 99
Average shift 8.4 hours
8% better than New Hampshire average

New Hampshire average: 7.8 hours

Total staff hours (quarter) 75,920
Nursing staff breakdown
Registered Nurse

Manages medical care and health needs.

Total count 60
Average shift length Info Average shift length. Calculated as total hours divided by days worked and average staff per day. 8.4 hours

This role is partially covered by contractors.

Licensed Practical Nurse

Assists with medical care and medications.

Total count 75
Average shift length Info Average shift length. Calculated as total hours divided by days worked and average staff per day. 8.8 hours

This role is partially covered by contractors.

Certified Nursing Assistant

Helps with daily care and mobility.

Total count 140
Average shift length Info Average shift length. Calculated as total hours divided by days worked and average staff per day. 8.7 hours

This role is partially covered by contractors.

Contractor staffing

Total hours from contractors

12.2%

9,252 contractor hours this quarter

Certified Nursing Assistant: 17 Licensed Practical Nurse: 12 Registered Nurse: 8 Physical Therapy Assistant: 4 Respiratory Therapy Technician: 4 Speech Language Pathologist: 2 Mental Health Service Worker: 1 Qualified Social Worker: 1
Staff by category
Certified Nursing Assistant1231714033,43491100%8.7
Licensed Practical Nurse63127517,86091100%8.8
Registered Nurse5286011,76291100%8.4
Other Dietary Services Staff280285,01191100%6.6
Mental Health Service Worker101111,4508290%7.4
Clinical Nurse Specialist100101,1023336%8
Dietitian4041,0347077%8
Nurse Aide in Training2027034651%8
Occupational Therapy Aide4046736571%7.3
Physical Therapy Assistant0445512224%8.2
RN Director of Nursing5055042022%8
Nurse Practitioner2024796066%8
Administrator2024605864%7.9
Qualified Activities Professional2024145459%7.7
Dental Services Staff5052101618%9.5
Speech Language Pathologist0221902123%7
Qualified Social Worker011541011%5.4
Respiratory Therapy Technician0443167%3.5
140 Certified Nursing Assistant
% of Days 100%
75 Licensed Practical Nurse
% of Days 100%
60 Registered Nurse
% of Days 100%
28 Other Dietary Services Staff
% of Days 100%
11 Mental Health Service Worker
% of Days 90%
10 Clinical Nurse Specialist
% of Days 36%
4 Dietitian
% of Days 77%
2 Nurse Aide in Training
% of Days 51%
4 Occupational Therapy Aide
% of Days 71%
4 Physical Therapy Assistant
% of Days 24%
5 RN Director of Nursing
% of Days 22%
2 Nurse Practitioner
% of Days 66%
2 Administrator
% of Days 64%
2 Qualified Activities Professional
% of Days 59%
5 Dental Services Staff
% of Days 18%
2 Speech Language Pathologist
% of Days 23%
1 Qualified Social Worker
% of Days 11%
4 Respiratory Therapy Technician
% of Days 7%

Facility Characteristics

Source: CMS Long-Term Care Facility Characteristics (Data as of Jan 2026)

Total census
220 residents
Residents by payment source
Medicare
35 residents (15.9%)
Medicaid
155 residents (70.5%)
Private pay or other
30 residents (13.6%)
Programs & Services
Residents' Group

Residents meet regularly to discuss policies, care quality, and activities

Active Resident Council

Organized group of residents that meets regularly to discuss facility policies, quality of life, and activities.

Quality of care over time

These measures show how residents usually do over time at this home, based on health outcomes and preventive care.

High-risk clinical events score Info A composite score based on pressure ulcers, falls with injury, weight loss, walking ability decline, and activities of daily living decline. 14.0
23% worse than New Hampshire average

New Hampshire average: 11.4

Functional decline score Info A composite score based on activities of daily living decline, walking ability decline, and incontinence. 28.3
22% worse than New Hampshire average

New Hampshire average: 23.2

Long-stay resident measures
Need for Help with Daily Activities Increased Info Percent of long-stay residents whose need for help with daily activities has increased 29.2%
33% worse than New Hampshire average

New Hampshire average: 21.9%

Walking Ability Worsened Info Percent of long-stay residents whose ability to move independently worsened 26.5%
31% worse than New Hampshire average

New Hampshire average: 20.3%

Low Risk Residents with Bowel/Bladder Incontinence Info Percent of low risk long-stay residents who lose control of their bowels or bladder 29.1%
7% worse than New Hampshire average

New Hampshire average: 27.1%

Falls with Major Injury Info Percent of long-stay residents experiencing one or more falls with major injury 4.7%
In line with New Hampshire average

New Hampshire average: 4.6%

High Risk Residents with Pressure Ulcers Info Percent of long-stay high risk residents with pressure ulcers 3.0%
34% better than New Hampshire average

New Hampshire average: 4.5%

Urinary Tract Infection Info Percent of long-stay residents with a urinary tract infection 1.1%
56% better than New Hampshire average

New Hampshire average: 2.5%

Lost Too Much Weight Info Percent of long-stay residents who lose too much weight 6.3%
13% worse than New Hampshire average

New Hampshire average: 5.6%

Depressive Symptoms Info Percent of long-stay residents who have depressive symptoms 18.2%
121% worse than New Hampshire average

New Hampshire average: 8.3%

Antipsychotic Use Info Percent of long-stay residents who received an antipsychotic medication 24.7%
42% worse than New Hampshire average

New Hampshire average: 17.4%

Pneumococcal Vaccine Info Percent of long-stay residents assessed and appropriately given the pneumococcal vaccine 97.0%
In line with New Hampshire average

New Hampshire average: 96.0%

Influenza Vaccine Info Percent of long-stay residents assessed and appropriately given the seasonal influenza vaccine 99.0%
In line with New Hampshire average

New Hampshire average: 98.0%

Short-stay resident measures
Pneumococcal Vaccine Info Percent of short-stay residents assessed and appropriately given the pneumococcal vaccine 95.4%
14% better than New Hampshire average

New Hampshire average: 83.8%

Antipsychotic medication increase Info Percent of short-stay residents who newly received an antipsychotic medication 1.8%
13% worse than New Hampshire average

New Hampshire average: 1.6%

Influenza Vaccine Info Percent of short-stay residents assessed and appropriately given the seasonal influenza vaccine 96.1%
16% better than New Hampshire average

New Hampshire average: 83.0%

Guides for Better Senior Living

Care Cost Calculator: See Prices in Your Area

Nursing Home Data Explorer

Don’t Wait Too Long: 7 Red Flag Signs Your Parent Needs Assisted Living Now

The True Cost of Assisted Living in 2025 – And How Families Are Paying For It

Understanding Senior Living Costs: Pricing Models, Discounts & Financial Assistance

Financial Aid for New Hampshire Seniors

Get financial aid guidance

Choices for Independence

NH Medicaid CFI Waiver

Age 65+ or disabled, New Hampshire resident, Medicaid-eligible, nursing home-level care need.

~$2,829/month (300% FBR, individual).

$2,000 (individual), $3,000 (couple).

Small state; rural access emphasis.

NH ServiceLink Aging and Disability Resource Center

NH ServiceLink

Age 60+, New Hampshire resident, or caregiver.

No strict limit; prioritizes low-income.

Not applicable.

Primarily referral-based; limited direct funding.

Old Age Assistance (OAA)

New Hampshire Old Age Assistance

Age 65+, NH resident, US citizen/eligible alien, not in public institution.

~$1,063/month (individual, net after deductions); varies by living arrangement.

$1,500 (individual), $2,000 (couple).

Automatic Medicaid eligibility; estate recovery applies.

New Hampshire Family Caregiver Program (via NFCSP)

New Hampshire Family Caregiver Program

Caregivers of 60+ needing care or 55+ caregivers of others; NH resident; functional needs (2+ ADLs).

Prioritizes ~$24,980/year (individual); no strict cap.

Not assessed; need-based.

13 ServiceLink locations; rural/low-income priority.

Medicare Savings Program (MSP)

New Hampshire Medicare Savings Program

Age 65+ or disabled, NH resident, Medicare Part A/B.

~$2,510/month (QMB), ~$3,380/month (SLMB), ~$3,598/month (QI)—individual.

$9,430 (individual), $14,130 (couple).

Three tiers; no waitlist; includes Extra Help for Part D.

New Hampshire Fuel Assistance Program (FAP)

New Hampshire Fuel Assistance Program

Age 60+ prioritized, NH resident, low-income household.

~$33,614/year (1-person), ~$43,958/year (2-person) (150% FPL).

Not assessed; income-focused.

Administered by 5 CAP agencies; covers oil, gas, electric, wood.

Senior Community Service Employment Program (SCSEP)

New Hampshire SCSEP

Age 55+, unemployed, low-income, NH resident.

~$1,983/month (125% FPL).

Not specified; income-focused.

Priority for veterans, rural residents; AARP partnership.

VA Aid and Attendance (A&A) and Housebound Benefits

New Hampshire VA Aid and Attendance/Housebound

Age 65+ or disabled veteran/spouse, NH resident, wartime service, need for ADL help (A&A) or homebound.

Net income < ~$1,984/month (veteran with dependent, A&A); pension offsets income.

~$155,356 (net worth limit).

High veteran demand in rural/urban areas.

NH Low and Moderate Income Homeowners Property Tax Relief

New Hampshire Property Tax Relief

Age 65+ prioritized, NH resident, homeowner, paid property taxes.

~$47,000/year (individual), ~$60,000/year (couple).

Not assessed; home value cap at $750,000.

Refundable relief (~$100-$500/year); annual application.

Tour Icon
Planning a tour? Check our touring checklist.
Chat Icon
Thinking of living here? We can help you speak to a current resident