Premier Washington Health Center
Nursing Home, Hospice Care, Memory Care & Respite Care · Washington, PA
CMS overall rating Info CMS (the Centers for Medicare & Medicaid Services) is the federal agency that rates nursing home quality. Its Overall Rating runs from 1 to 5 stars, combining health inspections, staffing, and quality measures, with inspections weighted most heavily.

Premier Washington Health Center

Nursing Home, Hospice Care, Memory Care & Respite Care · Washington, PA
CMS overall rating Info CMS (the Centers for Medicare & Medicaid Services) is the federal agency that rates nursing home quality. Its Overall Rating runs from 1 to 5 stars, combining health inspections, staffing, and quality measures, with inspections weighted most heavily.
Calculator: See prices in your area
Premier Washington Health Center accepts Medicare, Medicaid, and private pay.

Overview of Premier Washington Health Center

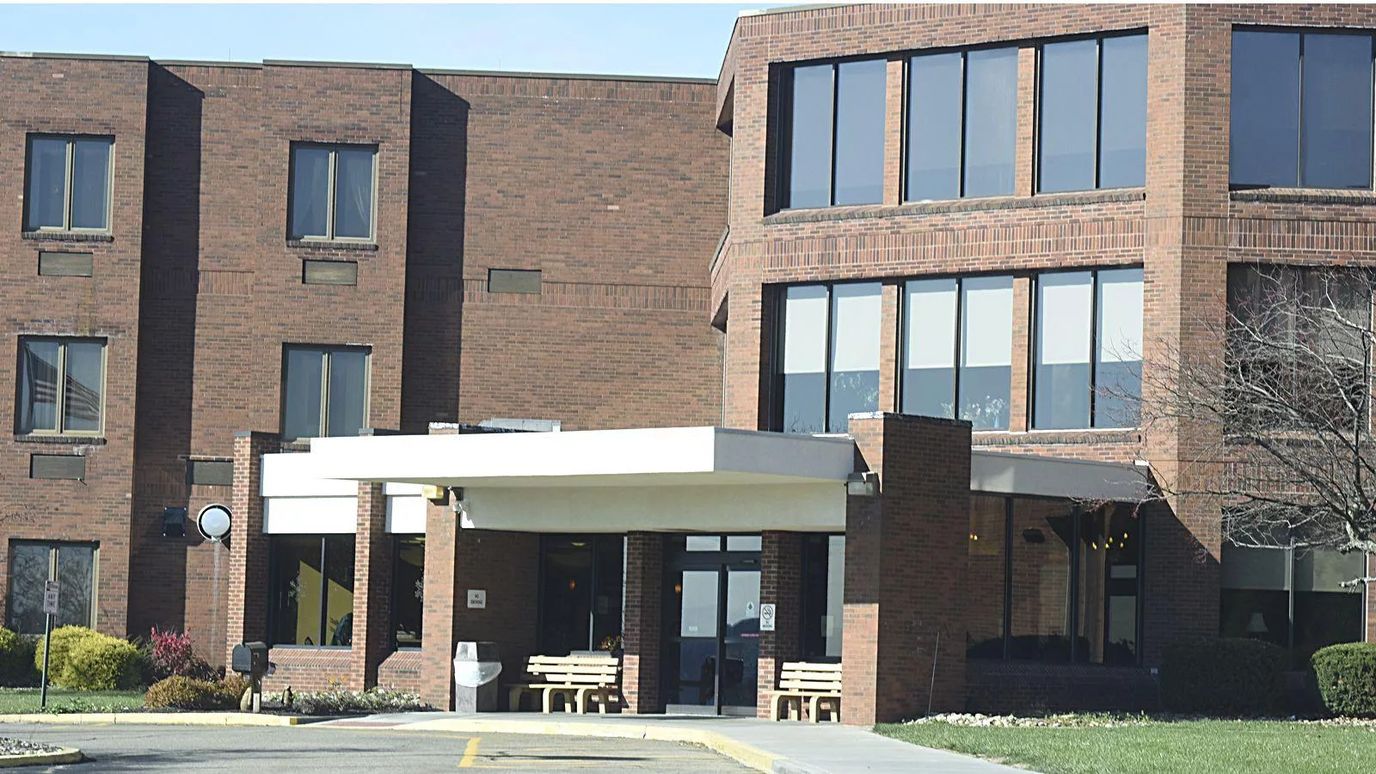
Premier Washington Health Center is a place where residents experience exceptional care while feeling right at home. With a legacy dating back to 1977, they excel in providing top-notch services, including temporary respite stays, short-term rehabilitation, and long-term skilled nursing. Their expertise is evident through years of experience, making them a trusted and leading rehabilitation and nursing facility in the region. Renowned for their excellence, the center proudly holds a five-star rating, ensuring families that their loved ones are in capable hands.
The environment at Premier Washington Health Center is not just clean, but also exudes a sense of elegance. Residents enjoy a premier lifestyle, engaging in social and recreational activities that bring joy and companionship. The dining experience is exceptional, complemented by comprehensive support services. What truly sets this facility apart is their devoted and professional staff, providing attentive care that brings peace of mind to families.

Quality ratings

Measured by Centers for Medicare & Medicaid Services (CMS)

Overall rating Info The Overall CMS Rating combines results from health inspections, staffing levels and quality measures. Health inspections carry the most weight. Staffing and quality scores can increase or decrease the final rating based on performance compared to state and national standards.
Health Inspection Info Based on the results of the facility's three most recent standard inspections and any complaint investigations. CMS reviews the number, scope, and severity of deficiencies, with more recent findings weighted more heavily.
Staffing Info Measures average nursing staff hours per resident per day, including Registered Nurses (RNs) and total nursing staff. Ratings are adjusted based on the level of care residents require and are compared to state and national benchmarks.
Quality Measures Info Based on clinical and physical health indicators reported to CMS, such as hospital readmissions, falls, pressure ulcers, and improvements in mobility. These measures reflect how well residents' health needs are being managed.

Staffing hours breakdown

Info Daily nursing hours per resident by staff type, reported to CMS. Higher is generally better — compare this facility to state and national averages to see where staffing stands.

Hours per resident per day — compared to state averages

Total nursing care / resident Info Total adjusted nursing hours per resident per day, combining RN, LPN, and aide time. CMS adjusts this for case-mix so facilities can be fairly compared.
3h 58m per day
Rank #122 / 207Nurse hours — State benchmarkedThis home is ranked 122nd out of 207 homes in Pennsylvania. Shows adjusted nurse hours per resident per day benchmarked to the Pennsylvania average, with a ranking across 207 Pennsylvania facilities. More hours mean more direct care. The national average is about 3.5 hrs; below 3.0 is a red flag.Rankings are based only on facilities in Pennsylvania that report data for that category. Facilities without available data are excluded from the ranking.Click the rank badge to see the full State ranking.Click here to see the full State ranking.
vs avg

5 of 6 metrics below state avg

Staff typeHours / Day / Residentvs state avg
Registered Nurse (RN) Info RNs hold the highest nursing license and can assess residents, interpret test results, and direct care plans. More RN hours per day often signals stronger clinical oversight and faster response to health changes. 29m per day ▼ 39% State avg: 47m per day · National avg: 41m per day
LPN / LVN Info Licensed Practical Nurses (LPNs) or Licensed Vocational Nurses (LVNs) deliver routine hands-on care — medication administration, wound dressing, and monitoring vital signs. They work under RN supervision and make up a large share of daily bedside care. 56m per day ■ Avg State avg: 55m per day · National avg: 52m per day
Nurse Aide Info Certified Nurse Aides (CNAs) provide the most direct day-to-day assistance: bathing, dressing, feeding, and mobility. Nurse aide hours are typically the largest staffing category and directly affect residents' quality of life. 1h 54m per day ▼ 14% State avg: 2h 12m per day · National avg: 2h 21m per day
Weekend Total Nursing Info Combined nursing hours (RN + LPN + Nurse Aide) per resident per day on weekends. Staffing often drops on weekends — this figure reveals whether the facility maintains adequate coverage outside of weekday hours. 2h 55m per day ▼ 17% State avg: 3h 31m per day · National avg: 3h 26m per day
Physical Therapist Info Hours per resident per day provided by licensed Physical Therapists (PTs) or PT Assistants. PT services help residents recover mobility after injury or illness and are especially important for post-acute (short-stay) rehabilitation. 5m per day ▼ 19% State avg: 6m per day · National avg: 4m per day
Weekend RN Info Registered nurse hours specifically on weekends. Facilities sometimes reduce RN presence on Saturdays and Sundays — a low weekend RN figure compared to weekday hours can indicate reduced clinical oversight when most administrative staff are absent. 18m per day ▼ 46% State avg: 33m per day · National avg: 29m per day

Capacity and availability

This home usually has limited availability

Similar occupancy to the state average
Occupancy rate
87.9% Rank #69 / 518Occupancy rate — State benchmarkedThis home is ranked 69th out of 518 homes in Pennsylvania. Shows this facility's occupancy rate versus the Pennsylvania average, with its Statewide rank out of 518. Higher occupancy signals strong local demand and financial stability.Rankings are based only on facilities in Pennsylvania that report data for that category. Facilities without available data are excluded from the ranking.Click the rank badge to see the full State ranking.Click here to see the full State ranking.
Avg. Length of Stay
183 days
Bed community size
288-bed community Rank #6 / 555Bed count — State benchmarkedThis home is ranked 6th out of 555 homes in Pennsylvania. Shows this facility's certified or reported bed count compared to other Pennsylvania facilities. Larger communities may offer more amenities, programs, and on-site services for residents and families.Rankings are based only on facilities in Pennsylvania that report data for that category. Facilities without available data are excluded from the ranking.Click the rank badge to see the full State ranking.Click here to see the full State ranking.
A large-scale community that may provide a wide range of amenities, services, and structured programs.
Walk Score
Walk Score: 5 / 100 Rank #635 / 668Walk Score — State benchmarkedThis home is ranked 635th out of 668 homes in Pennsylvania. Shows how walkable this facility's neighborhood is compared to the average Walk Score across Pennsylvania facilities. Higher scores benefit residents, families, and staff.Rankings are based only on facilities in Pennsylvania that report data for that category. Facilities without available data are excluded from the ranking.Click the rank badge to see the full State ranking.Click here to see the full State ranking.
Car-dependent. Most errands require a car, with limited nearby walkable options.

Therapy & Rehabilitation

3 services
Rehabilitation Services
Respite Care
Short-Term Rehab

Staffing & Medical

1 service
24-Hour Staffing

Contact Premier Washington Health Center

Staffing Data

Reporting period: October 1 – December 31, 2025 (Q4 2025). Source: CMS Payroll-Based Journal report.

Total staff 337
Employees 199
Contractors 138
Staff to resident ratio 1.29 : 1
0% compared with State average

State average ratio: 0 : 0

Avg staff/day 115
Average shift 8.4 hours
0% compared with State average

State average: 0 hours

Total staff hours (quarter) 88,987

Nursing staff breakdown

Q4 2025 · Oct 1 – Dec 31 More info This data comes from the CMS Payroll-Based Journal report covering October 1 – December 31, 2025.
Registered Nurse

Manages medical care and health needs.

RN Staff Info 43 total: 21 full-time employees and 22 contractors. 43
Average shift length Info Average shift length. Calculated as total hours divided by days worked and average staff per day. 8 hours
Licensed Practical Nurse

Assists with medical care and medications.

LPN Staff Info 75 total: 40 full-time employees and 35 contractors. 75
Average shift length Info Average shift length. Calculated as total hours divided by days worked and average staff per day. 8.6 hours
Certified Nursing Assistant

Helps with daily care and mobility.

CNA Staff Info 169 total: 88 full-time employees and 81 contractors. 169
Average shift length Info Average shift length. Calculated as total hours divided by days worked and average staff per day. 8.8 hours

Contractor staffing

Q4 2025 · Oct 1 – Dec 31 More info This data comes from the CMS Payroll-Based Journal report covering October 1 – December 31, 2025.

Total hours from contractors

14.8%

13,181 contractor hours this quarter

Certified Nursing Assistant: 81 Licensed Practical Nurse: 35 Registered Nurse: 22

Staff by category

Q4 2025 · Oct 1 – Dec 31 More info This data comes from the CMS Payroll-Based Journal report covering October 1 – December 31, 2025.
Certified Nursing Assistant888116943,02892100%8.8
Licensed Practical Nurse40357520,95192100%8.6
Registered Nurse2122438,63092100%8
Other Dietary Services Staff8083,43992100%8.1
Clinical Nurse Specialist6062,0166571%8
Respiratory Therapy Technician8081,8817278%8
Physical Therapy Aide3031,2986773%8
Physical Therapy Assistant3031,2876773%8.2
Dental Services Staff2029496672%7.8
Nurse Aide in Training7079322022%7.9
Qualified Social Worker2029196672%7.4
RN Director of Nursing3037327784%6.1
Occupational Therapy Aide2026639098%4.4
Nurse Practitioner2024885762%8
Mental Health Service Worker1014725964%8
Dietitian1014645863%8
Administrator1014565964%7.7
Speech Language Pathologist1013826470%6
169 Certified Nursing Assistant
% of Days 100%
75 Licensed Practical Nurse
% of Days 100%
43 Registered Nurse
% of Days 100%
8 Other Dietary Services Staff
% of Days 100%
6 Clinical Nurse Specialist
% of Days 71%
8 Respiratory Therapy Technician
% of Days 78%
3 Physical Therapy Aide
% of Days 73%
3 Physical Therapy Assistant
% of Days 73%
2 Dental Services Staff
% of Days 72%
7 Nurse Aide in Training
% of Days 22%
2 Qualified Social Worker
% of Days 72%
3 RN Director of Nursing
% of Days 84%
2 Occupational Therapy Aide
% of Days 98%
2 Nurse Practitioner
% of Days 62%
1 Mental Health Service Worker
% of Days 64%
1 Dietitian
% of Days 63%
1 Administrator
% of Days 64%
1 Speech Language Pathologist
% of Days 70%

Penalties and fines

Federal penalties imposed by CMS for regulatory violations, including civil money penalties (fines) and denials of payment for new Medicare/Medicaid admissions.

Source: CMS Penalties Database

No penalties in the past 3 years

No civil money penalties or payment denials were reported in the last 3 years.

Quality of care over time

These measures show how residents usually do over time at this home, based on health outcomes and preventive care.

High-risk clinical events score Info A composite score based on pressure ulcers, falls with injury, weight loss, walking ability decline, and activities of daily living decline. 8.1
26% better than State average

State average: 11.0

Functional decline score Info A composite score based on activities of daily living decline, walking ability decline, and incontinence. 14.0
37% better than State average

State average: 22.2

Long-stay resident measures
Significantly above average State avg: 3.7 Info CMS star rating based on long-stay quality measure performance. 5 stars = significantly above average, 1 star = significantly below average.
Need for Help with Daily Activities Increased Info Percent of long-stay residents whose need for help with daily activities has increased 12.7%
33% better than State average

State average: 19.0%

Walking Ability Worsened Info Percent of long-stay residents whose ability to move independently worsened 14.9%
30% better than State average

State average: 21.1%

Low Risk Residents with Bowel/Bladder Incontinence Info Percent of low risk long-stay residents who lose control of their bowels or bladder 14.5%
46% better than State average

State average: 26.7%

Falls with Major Injury Info Percent of long-stay residents experiencing one or more falls with major injury 2.1%
34% better than State average

State average: 3.2%

High Risk Residents with Pressure Ulcers Info Percent of long-stay high risk residents with pressure ulcers 4.9%
11% better than State average

State average: 5.5%

Urinary Tract Infection Info Percent of long-stay residents with a urinary tract infection 1.3%
24% better than State average

State average: 1.8%

Lost Too Much Weight Info Percent of long-stay residents who lose too much weight 6.0%
9% better than State average

State average: 6.6%

Depressive Symptoms Info Percent of long-stay residents who have depressive symptoms 0.2%
96% better than State average

State average: 5.5%

Antipsychotic Use Info Percent of long-stay residents who received an antipsychotic medication 18.8%
10% worse than State average

State average: 17.1%

Pneumococcal Vaccine Info Percent of long-stay residents assessed and appropriately given the pneumococcal vaccine 93.5%
8% better than State average

State average: 86.9%

Influenza Vaccine Info Percent of long-stay residents assessed and appropriately given the seasonal influenza vaccine 96.4%
In line with State average

State average: 93.5%

Short-stay resident measures
Average State avg: 3.2 Info CMS star rating based on short-stay quality measure performance. 5 stars = much above average, 1 star = much below average.
Pneumococcal Vaccine Info Percent of short-stay residents assessed and appropriately given the pneumococcal vaccine 90.7%
32% better than State average

State average: 68.8%

Antipsychotic medication increase Info Percent of short-stay residents who newly received an antipsychotic medication 1.4%
11% better than State average

State average: 1.5%

Influenza Vaccine Info Percent of short-stay residents assessed and appropriately given the seasonal influenza vaccine 93.4%
36% better than State average

State average: 68.7%

Re-hospitalized after SNF stay Info Percentage of short-stay residents who were re-hospitalized after their nursing home admission. 30.4%
32% worse than State average

State average: 23.1%

Emergency department visits Info Percentage of short-stay residents who had an outpatient emergency department visit. 4.6%
53% better than State average

State average: 9.8%

Falls with major injury Info Percentage of SNF residents who experience falls with major injury during their stay. 2.9%
271% worse than State average

State average: 0.8%

Ability to care for self at discharge Info Percentage of residents at or above expected ability to care for themselves at discharge. 45.5%
15% worse than State average

State average: 53.7%

Successful return to home or community Info Rate of successful return to home or community from a skilled nursing facility. 48.0%
5% worse than State average

State average: 50.6%

Breakdown by payment type

Medicare

7% of new residents, usually for short-term rehab.

Typical stay 1 months

Private pay

13% of new residents, often for short stays.

Typical stay 6 - 7 months

Medicaid

79% of new residents, often for long-term daily care.

Typical stay 6 - 7 months

Facility Characteristics

Source: CMS Long-Term Care Facility Characteristics (Data as of Jan 2026)

Total residents 261
Medicare
5
1.9% of residents
Medicaid
200
76.6% of residents
Private pay or other
56
21.5% of residents
Programs & Services
Residents Group

Residents meet regularly to discuss policies, care quality, and activities

Active Resident Council

Organized group of residents that meets regularly to discuss facility policies, quality of life, and activities.

Finances and operations

Based on CMS SNF Cost Report for fiscal year ending in 06/2024.

For-profit
Operated by a business corporation.
Net patient revenue Info Net patient revenue — what the home actually collects for resident care, after contractual allowances, bad debt and discounts are subtracted from its gross charges (CMS cost report, Worksheet G-3). It covers resident care only; money the home earns from other sources is shown separately as "Other income."
$26.4M
Net patient income Info Net patient income: net patient revenue minus the home's total operating expenses. A positive figure means it earns more from resident care than it spends to deliver it; a negative figure means the opposite. It excludes non-operating "other income."
-$113.7K
For-profit Operated by a business corporation.
Net patient revenue Info Net patient revenue — what the home actually collects for resident care, after contractual allowances, bad debt and discounts are subtracted from its gross charges (CMS cost report, Worksheet G-3). It covers resident care only; money the home earns from other sources is shown separately as "Other income."
$26.4M Rank #51 / 209Revenue — State benchmarkedThis home is ranked 51st out of 209 homes in Pennsylvania. Shows this facility's annual revenue compared to the Pennsylvania average. Higher revenue generally means more resources for staffing and capital — read alongside Payroll %.Rankings are based only on facilities in Pennsylvania that report data for that category. Facilities without available data are excluded from the ranking.Click the rank badge to see the full State ranking.Click here to see the full State ranking.
Net patient income Info Net patient income: net patient revenue minus the home's total operating expenses. A positive figure means it earns more from resident care than it spends to deliver it; a negative figure means the opposite. It excludes non-operating "other income."
-$113.7K
Other income Info Money the home earns outside of resident care — such as investments, grants, rentals and other non-operating sources (CMS cost report, Worksheet G-3). It is tracked separately from net patient revenue: it is not part of that figure, and it is not included in net patient income.
$214.9K
Payroll costs Info Staff salaries plus wage-related costs — benefits such as payroll taxes, health insurance and retirement — from the home's own accounting records (CMS cost report, Worksheet A). Contract or agency labor is counted separately, under other operating costs. Rank #113 / 209Payroll — State benchmarkedThis home is ranked 113th out of 209 homes in Pennsylvania. Shows total annual staff payroll benchmarked to the Pennsylvania average. Higher payroll investment relative to peers often signals better staffing and less reliance on cheaper contract labor.Rankings are based only on facilities in Pennsylvania that report data for that category. Facilities without available data are excluded from the ranking.Click the rank badge to see the full State ranking.Click here to see the full State ranking.
$9.6M 36.4% of net patient revenue Info Payroll as a share of revenue: staff salaries and wage-related benefits divided by net patient revenue. A higher figure means more of each revenue dollar goes to staff pay. Rank #199 / 209Payroll % — State benchmarkedThis home is ranked 199th out of 209 homes in Pennsylvania. Shows payroll as a percentage of revenue versus the Pennsylvania average. Well-run Pennsylvania facilities typically land around 53–61% — the top third Statewide. Below 25% may signal understaffing or heavy agency use — read with Staffing ratings.Rankings are based only on facilities in Pennsylvania that report data for that category. Facilities without available data are excluded from the ranking.Click the rank badge to see the full State ranking.Click here to see the full State ranking.
Other operating costs Info Everything it costs to run the home apart from payroll — food, utilities, supplies, maintenance, contract labor and administration. Calculated as total operating expense minus payroll (staff salaries and wage-related benefits).
$16.9M
Total costs Info The home's total operating expense for the year — all the costs of running it, salaries included (CMS cost report, Worksheet G-3).
$26.6M

Who this home usually serves

TYPE OF STAY

Mostly long-term care residents

Most residents stay for extended periods and receive ongoing daily care.

Most new residents arrive under Medicaid (79% of admissions), and a typical Medicaid stay runs around 6 - 7 months.

Admissions
500 total

Coverage residents most often arrive under.

Medicare 7%
Private pay 13%
Medicaid 79%
Discharges
506 total

Coverage residents most often leave under.

Medicare 7%
Private pay 13%
Medicaid 79%

Places of interest near Premier Washington Health Center

Address 2.7 miles from city center Info Estimated distance in miles from Washington's city center to Premier Washington Health Center's address, calculated via Google Maps. — 4.02 miles to nearest hospital (AHN Canonsburg Hospital - Main Building)

Calculate Travel Distance to Premier Washington Health Center

Add your location

Address

Compare Nursing Homes around the area

The information below is reported by the Pennsylvania Department of Human Services and Department of Health.

Premier Washington Health Center
NH
HC
MC
RC
- (Chartiers Township) -288 - 5 -
Barclay Friends
NH
AL
MC
RC
West Chester (North Franklin Street) -103 A+ 35 Private / Shared Suites
Overlook Green Senior Living
NH
MC
Pittsburgh -128 - 30 Studio / 1 Bed
Freedom Village at Brandywine
NH
AL
IL
MC
RC
Coatesville -60 A+ 9 1 Bed / 2 Bed
Souderton Mennonite Homes
NH
AL
MC
RC
Souderton -154 - 31 Studio / 1 Bed / 2 Bed

Frequently Asked Questions about Premier Washington Health Center

What neighborhood is Premier Washington Health Center in?

Premier Washington Health Center is in the Chartiers Township neighborhood.

Is Premier Washington Health Center in a walkable area?

Premier Washington Health Center has a walk score of 5. Car-dependent. Most errands require a car, with limited nearby walkable options.

What is the occupancy rate at Premier Washington Health Center?

Premier Washington Health Center's occupancy is 87.9%.

Does Premier Washington Health Center operate as a for-profit or non-profit?

Premier Washington Health Center is registered as a for-profit.

Are there photos of Premier Washington Health Center?

Yes — there is 1 photo of Premier Washington Health Center in the photo gallery on this page.

What is the address of Premier Washington Health Center?

Premier Washington Health Center is located at 36 Old Hickory Ridge Rd, Washington, PA 15301.

What is the phone number of Premier Washington Health Center?

(724) 228-5010 will put you in contact with the team at Premier Washington Health Center.

Guides for Better Senior Living

Care Cost Calculator: See Prices in Your Area

Nursing Home Data Explorer

Don’t Wait Too Long: 7 Red Flag Signs Your Parent Needs Assisted Living Now

The True Cost of Assisted Living in 2025 – And How Families Are Paying For It

Understanding Senior Living Costs: Pricing Models, Discounts & Financial Assistance