


Total staff
179
Employees
149
Contractors
30
Spend your best years at Provident Community Care, an idyllic retreat in Waldorf, MD, offering assisted living. A compassionate and well-trained team helps residents with their daily living activities and personal needs around the clock, ensuring their comfort and safety. Housekeeping and laundry services, alongside beautifully furnished and cozy accommodations, are provided, ensuring residents can feel at ease during their stay.
A thoughtfully curated calendar of engaging activities and enriching programs is conducted, encouraging residents to live actively and have fun. Meal preparation is also taken care of, striving to meet residents’ dietary needs with delicious and healthy dining options. Emergency alert system and medication management are available to ensure convenience and safety. The community is a good option for those aiming to maintain independence in retirement without hassles.
| Staff type | Hours / Day / Resident | vs state avg |
|---|---|---|
|
Registered Nurse (RN)
| 38m per day | ▼ 22% State avg: 49m per day · National avg: 41m per day |
|
LPN / LVN
| 1h 5m per day | ▲ 19% State avg: 55m per day · National avg: 52m per day |
|
Nurse Aide
| 1h 56m per day | ▼ 10% State avg: 2h 8m per day · National avg: 2h 20m per day |
|
Weekend Total Nursing
| 3h 5m per day | ▼ 12% State avg: 3h 31m per day · National avg: 3h 27m per day |
|
Physical Therapist
| 2m per day | ▼ 63% State avg: 6m per day · National avg: 4m per day |
|
Weekend RN
| 15m per day | ▼ 59% State avg: 37m per day · National avg: 29m per day |
Reporting period: October 1 – December 31, 2025 (Q4 2025). Source: CMS Payroll-Based Journal report.
Manages medical care and health needs.
Assists with medical care and medications.
Helps with daily care and mobility.
Total hours from contractors
3,744 contractor hours this quarter
| Certified Nursing Assistant | 52 | 1 | 53 | 14,866 | 92 | 100% | 7.2 |
| Licensed Practical Nurse | 19 | 3 | 22 | 9,512 | 92 | 100% | 8.7 |
| Registered Nurse | 11 | 14 | 25 | 3,004 | 92 | 100% | 7.9 |
| Clinical Nurse Specialist | 9 | 0 | 9 | 2,507 | 69 | 75% | 8.1 |
| Other Dietary Services Staff | 3 | 0 | 3 | 1,449 | 92 | 100% | 7.3 |
| Nurse Aide in Training | 18 | 0 | 18 | 1,359 | 58 | 63% | 6.6 |
| Speech Language Pathologist | 1 | 4 | 5 | 1,174 | 74 | 80% | 7.6 |
| Medication Aide/Technician | 3 | 0 | 3 | 1,135 | 90 | 98% | 12.6 |
| Mental Health Service Worker | 2 | 0 | 2 | 986 | 64 | 70% | 7.9 |
| Physical Therapy Aide | 3 | 0 | 3 | 708 | 77 | 84% | 6.3 |
| Physical Therapy Assistant | 3 | 2 | 5 | 613 | 73 | 79% | 6.8 |
| Qualified Social Worker | 5 | 2 | 7 | 502 | 61 | 66% | 6.6 |
| Administrator | 3 | 0 | 3 | 464 | 57 | 62% | 8 |
| Other Social Services Staff | 2 | 0 | 2 | 407 | 55 | 60% | 7.4 |
| Occupational Therapy Aide | 0 | 1 | 1 | 393 | 53 | 58% | 7.4 |
| Respiratory Therapy Technician | 10 | 1 | 11 | 322 | 71 | 77% | 3.7 |
| Nurse Practitioner | 2 | 0 | 2 | 224 | 28 | 30% | 8 |
| RN Director of Nursing | 3 | 0 | 3 | 178 | 20 | 22% | 8.9 |
| Occupational Therapy Assistant | 0 | 1 | 1 | 51 | 40 | 43% | 1.3 |
| Medical Director | 0 | 1 | 1 | 37 | 17 | 18% | 2.1 |
Federal penalties imposed by CMS for regulatory violations, including civil money penalties (fines) and denials of payment for new Medicare/Medicaid admissions.
Source: CMS Penalties Database
No penalties in the past 3 years
No civil money penalties or payment denials were reported in the last 3 years.
These measures show how residents usually do over time at this home, based on health outcomes and preventive care.
Maryland average: 12.9
Maryland average: 25.7
Maryland average: 23.7%
Maryland average: 27.7%
Maryland average: 25.9%
Maryland average: 2.3%
Maryland average: 6.5%
Maryland average: 1.6%
Maryland average: 5.8%
Maryland average: 20.2%
Maryland average: 12.9%
Maryland average: 92.0%
Maryland average: 96.6%
Maryland average: 78.4%
Maryland average: 1.4%
Maryland average: 80.6%
Quality measures are calculated from Minimum Data Set (MDS) assessments. For most measures, lower percentages indicate better care quality.
56% of new residents, usually for short-term rehab.
43% of new residents, often for short stays.
1% of new residents, often for long-term daily care.
Source: CMS Long-Term Care Facility Characteristics (Data as of Jan 2026)
Residents meet regularly to discuss policies, care quality, and activities
Organized group of residents that meets regularly to discuss facility policies, quality of life, and activities.
Data sourced from CMS Long-Term Care Facility Characteristics quarterly report. Payer mix reflects the current resident census by primary payment source.
Historical financial and operational data for Provident Community Care from 2012–2023, based on CMS SNF Cost Reports.
Key figures below are for fiscal year ending in 12/2023.
Based on CMS SNF Cost Report for fiscal year ending in 12/2023.
Housing Options: Private / Shared Rooms
Building Type: 2-story
Housekeeping Services
Social and Recreational Activities
Most residents typically stay for a few weeks or months before returning home or moving on.
Most new residents arrive under Medicare (56% of admissions), and a typical Medicare stay runs around 1 - 2 months.
Coverage residents most often arrive under.
Coverage residents most often leave under.
![]() 1.3 miles from city center
1.3 miles from city center
![]() Estimated distance in miles from Waldof's city center to Provident Community Care's address, calculated via Google Maps.
Estimated distance in miles from Waldof's city center to Provident Community Care's address, calculated via Google Maps.
Add your location
The information below is reported by the Maryland Department of Health, Office of Health Care Quality.
| Provident Community Care | AL NH | Waldof | - | 115
Facility
115
MD AVG
43
Rank
#87 / 690 | - |
37
Facility
37
MD AVG
43
Rank
#554 / 985 | Private / Shared Rooms |
| Ricks Troy | AL NH | Waldorf (Saint Charles) | - | 70
Facility
70
MD AVG
43
Rank
#186 / 690 | - |
29
Facility
29
MD AVG
43
Rank
#638 / 985 | - |
Provident Community Care is located in Waldof, Maryland.
Here are the financial assistance programs available to residents in Maryland.
Provident Community Care has a walk score of 37. Somewhat walkable. A few nearby services may be reachable on foot, but most trips require transportation.
Provident Community Care's occupancy is 93.8%.
Provident Community Care is registered as a for-profit.
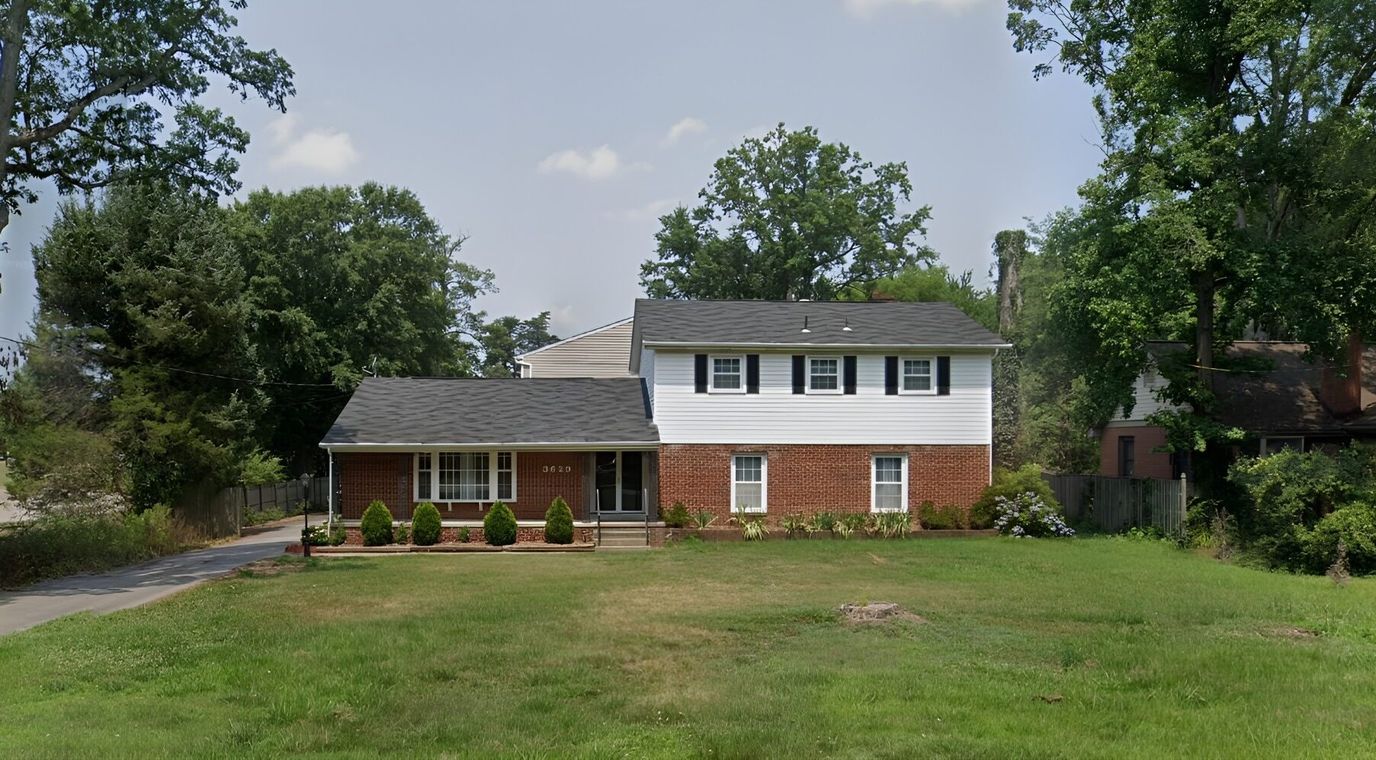
Yes — there is 1 photo of Provident Community Care in the photo gallery on this page.
Provident Community Care is located at 3629 Old Washington Rd, Waldof, MD 20602.
(240) 619-0072 will put you in contact with the team at Provident Community Care.
Yes — Provident Community Care is a CMS-certified provider of Medicare and Medicaid.
Care Cost Calculator: See Prices in Your Area
Nursing Home Data Explorer
Don’t Wait Too Long: 7 Red Flag Signs Your Parent Needs Assisted Living Now
The True Cost of Assisted Living in 2025 – And How Families Are Paying For It
Understanding Senior Living Costs: Pricing Models, Discounts & Financial Assistance


