


Total staff
149
Employees
128
Contractors
21
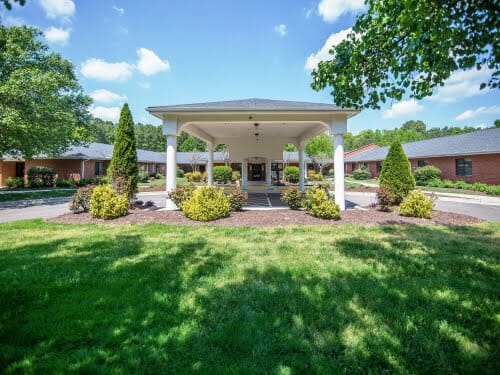
PruittHealth – Carolina Point is an assisted living community that extends its comprehensive care services to encompass skilled nursing and rehabilitation, addressing short-term and long-term care needs. Their adept and experienced nursing team excels in providing advanced care within thoughtfully designed facilities, incorporating the latest technological advancements to ensure residents receive the highest quality of care.
Located in Durham, North Carolina, this assisted living community focuses on equipping its senior residents with professional nursing services that accompany them through every phase of their journey. Experience a new standard of holistic well-being and cutting-edge medical attention at PruittHealth – Carolina Point.
| Staff type | Hours / Day / Resident | vs state avg |
|---|---|---|
|
Registered Nurse (RN)
| 26m per day | ▼ 26% State avg: 35m per day · National avg: 41m per day |
|
LPN / LVN
| 1h 8m per day | ▲ 30% State avg: 52m per day · National avg: 52m per day |
|
Nurse Aide
| 1h 57m per day | ▼ 16% State avg: 2h 19m per day · National avg: 2h 21m per day |
|
Weekend Total Nursing
| 2h 47m per day | ▼ 16% State avg: 3h 20m per day · National avg: 3h 26m per day |
|
Physical Therapist
| 6m per day | ▲ 10% State avg: 5m per day · National avg: 4m per day |
|
Weekend RN
| 16m per day | ▼ 31% State avg: 23m per day · National avg: 29m per day |
Reporting period: October 1 – December 31, 2025 (Q4 2025). Source: CMS Payroll-Based Journal report.
Manages medical care and health needs.
Assists with medical care and medications.
Helps with daily care and mobility.
Total hours from contractors
2,674 contractor hours this quarter
| Certified Nursing Assistant | 72 | 0 | 72 | 19,028 | 92 | 100% | 8.6 |
| Licensed Practical Nurse | 29 | 0 | 29 | 9,970 | 92 | 100% | 9.4 |
| Registered Nurse | 13 | 0 | 13 | 2,686 | 92 | 100% | 9.3 |
| Clinical Nurse Specialist | 2 | 0 | 2 | 1,055 | 69 | 75% | 8.2 |
| RN Director of Nursing | 2 | 0 | 2 | 1,040 | 69 | 75% | 8.1 |
| Respiratory Therapy Technician | 0 | 6 | 6 | 895 | 71 | 77% | 6.9 |
| Physical Therapy Aide | 0 | 3 | 3 | 811 | 66 | 72% | 7.2 |
| Occupational Therapy Aide | 2 | 0 | 2 | 525 | 62 | 67% | 7.8 |
| Mental Health Service Worker | 1 | 0 | 1 | 520 | 65 | 71% | 8 |
| Nurse Practitioner | 1 | 0 | 1 | 496 | 62 | 67% | 8 |
| Administrator | 1 | 0 | 1 | 488 | 61 | 66% | 8 |
| Other Dietary Services Staff | 1 | 0 | 1 | 432 | 69 | 75% | 6.3 |
| Qualified Social Worker | 0 | 2 | 2 | 379 | 60 | 65% | 6.1 |
| Speech Language Pathologist | 0 | 2 | 2 | 314 | 40 | 43% | 7.9 |
| Physical Therapy Assistant | 0 | 8 | 8 | 275 | 53 | 58% | 4.6 |
| Dietitian | 3 | 0 | 3 | 190 | 24 | 26% | 7.9 |
| Occupational Therapy Assistant | 1 | 0 | 1 | 72 | 11 | 12% | 6.5 |
Includes penalties issued in 2024-2025
Federal penalties imposed by CMS for regulatory violations, including civil money penalties (fines) and denials of payment for new Medicare/Medicaid admissions.
Source: CMS Penalties Database (Data as of Jan 2026)
North Carolina average: $76K
North Carolina average: 2.3
North Carolina average: 0.4
Penalties are imposed by CMS for violations of federal nursing home regulations.
2 penalties in the past 3 years
Multiple penalties were reported in the last 3 years.
Last updated: Jan 2026
These measures show how residents usually do over time at this home, based on health outcomes and preventive care.
North Carolina average: 11.5
North Carolina average: 20.6
North Carolina average: 17.5%
North Carolina average: 23.3%
North Carolina average: 21.4%
North Carolina average: 3.6%
North Carolina average: 6.3%
North Carolina average: 2.6%
North Carolina average: 7.4%
North Carolina average: 4.4%
North Carolina average: 13.4%
North Carolina average: 91.6%
North Carolina average: 94.1%
North Carolina average: 1.77
North Carolina average: 1.82
North Carolina average: 79.9%
North Carolina average: 1.5%
North Carolina average: 78.1%
North Carolina average: 22.9%
North Carolina average: 13.2%
North Carolina average: 0.8%
North Carolina average: 53.7%
North Carolina average: 50.6%
Quality measures are calculated from Minimum Data Set (MDS) assessments. For most measures, lower percentages indicate better care quality.
18% of new residents, usually for short-term rehab.
76% of new residents, often for short stays.
6% of new residents, often for long-term daily care.
Source: CMS Long-Term Care Facility Characteristics (Data as of Jan 2026)
Residents meet regularly to discuss policies, care quality, and activities
Organized group of residents that meets regularly to discuss facility policies, quality of life, and activities.
Data sourced from CMS Long-Term Care Facility Characteristics quarterly report. Payer mix reflects the current resident census by primary payment source.
Historical financial and operational data for PruittHealth – Carolina Point from 2012–2024, based on CMS SNF Cost Reports.
Key figures below are for fiscal year ending in 06/2024.
Based on CMS SNF Cost Report for fiscal year ending in 06/2024.
Residents typically stay for brief periods, with frequent admissions and discharges throughout the year.
Most new residents arrive under private pay (76% of admissions), and a typical private pay stay runs around 2 - 3 months.
Coverage residents most often arrive under.
Coverage residents most often leave under.
Info below is compiled from CMS reports & the NC Dept. of Health & Human Services (NCDHHS), senior community websites & trusted data sources such as Walk Score & BBB.
Communities are listed from highest to lowest based on our ranking methodology.
| Hillcrest Convalescent Center | NH AL RC SNF | Durham | 86
Facility
86
NC AVG
72
Rank
#129 / 388 |
86.7%
Facility
86.7%
NC AVG
68
Rank
#71 / 240 | +28% | 5.76
Facility
5.76
NC AVG
3.98
Rank
#12 / 80 | -6% | +45% | $0
Facility
$0
NC AVG
$74.6k
Rank
#1 / 88 | - | - | - | 75 | - |
81
Facility
81
NC AVG
33
Rank
#5 / 573 | William Hoover | $25.2MFiscal year ending 09/2023
Facility
$25.2MFiscal year ending 09/2023
NC AVG
$13.2M
Rank
#16 / 87 | $14.6MFiscal year ending 09/2023
Facility
$14.6MFiscal year ending 09/2023
NC AVG
$4.9M
Rank
#12 / 87 | 58%Fiscal year ending 09/2023
Facility
58%Fiscal year ending 09/2023
NC AVG
39.8%
Rank
#45 / 87 | 345001 | ||||
| Croasdaile Village | NH AL HC IL MC SNF | Durham | 64
Facility
64
NC AVG
72
Rank
#214 / 388 | - | - | 5.75
Facility
5.75
NC AVG
3.98
Rank
#12 / 80 | -45% | +45% | $30.6k
Facility
$30.6k
NC AVG
$74.6k
Rank
#63 / 88 | 5
Facility
5
NC AVG
20.9
Rank
#17 / 84 | 1.7
Facility
1.7
NC AVG
5.0
Rank
#9 / 84 | - | 83 | - |
9
Facility
9
NC AVG
33
Rank
#463 / 573 | Susan Ezekiel | $44.5MFiscal year ending 09/2023
Facility
$44.5MFiscal year ending 09/2023
NC AVG
$13.2M
Rank
#2 / 87 | $17.3MFiscal year ending 09/2023
Facility
$17.3MFiscal year ending 09/2023
NC AVG
$4.9M
Rank
#4 / 87 | 38.9%Fiscal year ending 09/2023
Facility
38.9%Fiscal year ending 09/2023
NC AVG
39.8%
Rank
#81 / 87 | 345501 | ||||
| Treyburn Rehabilitation Center | NH RC SNF | Durham | 132
Facility
132
NC AVG
72
Rank
#23 / 388 |
76.7%
Facility
76.7%
NC AVG
68
Rank
#115 / 240 | +13% | 3.61
Facility
3.61
NC AVG
3.98
Rank
#60 / 80 | +34% | -9% | $124.5k
Facility
$124.5k
NC AVG
$74.6k
Rank
#82 / 88 | 26
Facility
26
NC AVG
20.9
Rank
#66 / 84 | 5.2
Facility
5.2
NC AVG
5.0
Rank
#61 / 84 | 3 | 101 | - |
3
Facility
3
NC AVG
33
Rank
#516 / 573 | Steven Kerley | $14.1MFiscal year ending 12/2023
Facility
$14.1MFiscal year ending 12/2023
NC AVG
$13.2M
Rank
#39 / 87 | $5.9MFiscal year ending 12/2023
Facility
$5.9MFiscal year ending 12/2023
NC AVG
$4.9M
Rank
#42 / 87 | 41.5%Fiscal year ending 12/2023
Facility
41.5%Fiscal year ending 12/2023
NC AVG
39.8%
Rank
#47 / 87 | 345458 | ||||
| PruittHealth – Carolina Point | NH HOS RC SNF | Durham | 138
Facility
138
NC AVG
72
Rank
#19 / 388 |
76.9%
Facility
76.9%
NC AVG
68
Rank
#114 / 240 | +13% | 3.17
Facility
3.17
NC AVG
3.98
Rank
#74 / 80 | -5% | -20% | $52.9k
Facility
$52.9k
NC AVG
$74.6k
Rank
#70 / 88 | 27
Facility
27
NC AVG
20.9
Rank
#68 / 84 | 4.5
Facility
4.5
NC AVG
5.0
Rank
#49 / 84 | 3 | 106 | - |
9
Facility
9
NC AVG
33
Rank
#463 / 573 | Laticia Beatty | $11.7MFiscal year ending 06/2024
Facility
$11.7MFiscal year ending 06/2024
NC AVG
$13.2M
Rank
#63 / 87 | $6.0MFiscal year ending 06/2024
Facility
$6.0MFiscal year ending 06/2024
NC AVG
$4.9M
Rank
#60 / 87 | 51.5%Fiscal year ending 06/2024
Facility
51.5%Fiscal year ending 06/2024
NC AVG
39.8%
Rank
#28 / 87 | 345551 |
PruittHealth – Carolina Point is located in Durham, North Carolina.
Here are the financial assistance programs available to residents in North Carolina.
PruittHealth – Carolina Point has a walk score of 9. Car-dependent. Most errands require a car, with limited nearby walkable options.
PruittHealth – Carolina Point's occupancy is 64.0%.
No, PruittHealth – Carolina Point has a no-pet policy.
PruittHealth – Carolina Point is registered as a for-profit.
Yes — there is 1 photo of PruittHealth – Carolina Point in the photo gallery on this page.
(919) 402-2450 will put you in contact with the team at PruittHealth – Carolina Point.
Yes — PruittHealth – Carolina Point is a CMS-certified provider of Medicare and Medicaid.
Care Cost Calculator: See Prices in Your Area
Nursing Home Data Explorer
Don’t Wait Too Long: 7 Red Flag Signs Your Parent Needs Assisted Living Now
The True Cost of Assisted Living in 2025 – And How Families Are Paying For It
Understanding Senior Living Costs: Pricing Models, Discounts & Financial Assistance


