


Total staff
165
Employees
151
Contractors
14
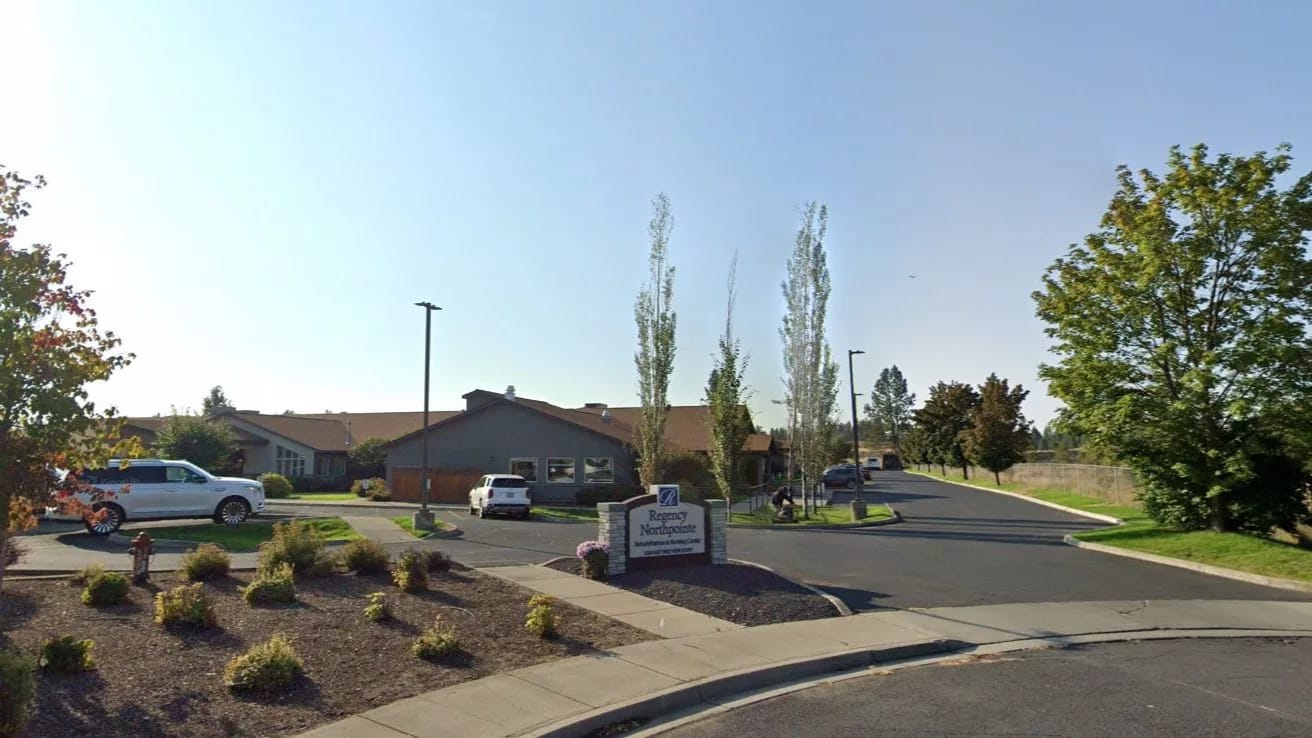
Set along the Spokane River and about 6.2 miles from the city center, Regency at Northpointe is a nursing home offering respite care in the Shiloh Hills area of Spokane, Washington. Owned by Tod Dunfield, it accepts Medicare, Medicaid, and private pay, giving families several ways to cover short-term rehabilitation and longer-term stays. The 120-bed community typically runs around 74 percent occupancy. Its average stay is about 84 days, pointing to a mix of residents recuperating from a hospital stay or surgery and those settling in for active nursing care.
Services span skilled nursing, rehabilitation therapy, long-term care, and respite stays, so the home is built to support occupants at different points in their recovery or care journey. Daily nursing support is a central part of life at Regency at Northpointe. Total nursing care averages about 3 hours 50 minutes per resident day, combining registered nurse, licensed practical nurse, and nurse aide time. That comprises dedicated RN hours, which often denote closer clinical oversight and a quicker response when a resident’s condition changes. Occupants live in private or semi-private suites and share a main living room, with landscaped grounds around the building. Regency at Northpointe also has a regular activities calendar, including group outings and creative classes, and keeps a full-service salon and barbershop on site so residents can get a haircut or styling without leaving the building. The surrounding neighborhood scores 37 for walkability, meaning it’s somewhat walkable: a few nearby errands can be done on foot, with most trips requiring a car.
Families exploring a nursing home for a loved one may want to inquire about current room availability, considering that private and semi-private suites here can fill at different rates.
Staffing hours
![]() Daily nursing hours per resident by staff type, reported to CMS. Higher is generally better — compare this facility to state and national averages to see where staffing stands.
Daily nursing hours per resident by staff type, reported to CMS. Higher is generally better — compare this facility to state and national averages to see where staffing stands.
Hours per resident per day vs Washington averages
Total nursing care
![]() This home is ranked 48th out of 61 homes in Washington for nurse hours. Total adjusted nursing hours per resident per day, combining RN, LPN, and aide time. CMS adjusts this for case-mix so facilities can be fairly compared.
This home is ranked 48th out of 61 homes in Washington for nurse hours. Total adjusted nursing hours per resident per day, combining RN, LPN, and aide time. CMS adjusts this for case-mix so facilities can be fairly compared.
3h 50m
9% below state avg1 of 6 metrics below state avg
Reporting period: October 1 – December 31, 2025 (Q4 2025). Source: CMS Payroll-Based Journal report.
Manages medical care and health needs.
Assists with medical care and medications.
Helps with daily care and mobility.
Total hours from contractors
3,010 contractor hours this quarter
| Certified Nursing Assistant | 79 | 0 | 79 | 23,758 | 92 | 100% | 7.5 |
| Licensed Practical Nurse | 18 | 0 | 18 | 7,018 | 92 | 100% | 8.9 |
| Registered Nurse | 14 | 0 | 14 | 4,628 | 92 | 100% | 8 |
| Clinical Nurse Specialist | 9 | 0 | 9 | 3,387 | 76 | 83% | 8.2 |
| Qualified Activities Professional | 0 | 12 | 12 | 2,932 | 92 | 100% | 8.9 |
| Respiratory Therapy Technician | 7 | 0 | 7 | 1,574 | 80 | 87% | 7 |
| Physical Therapy Assistant | 3 | 0 | 3 | 1,007 | 69 | 75% | 7.3 |
| Speech Language Pathologist | 4 | 0 | 4 | 975 | 73 | 79% | 7.1 |
| Physical Therapy Aide | 2 | 0 | 2 | 896 | 67 | 73% | 7.1 |
| Other Dietary Services Staff | 3 | 0 | 3 | 582 | 87 | 95% | 4.4 |
| Administrator | 1 | 0 | 1 | 512 | 64 | 70% | 8 |
| Mental Health Service Worker | 1 | 0 | 1 | 509 | 51 | 55% | 10 |
| Dietitian | 1 | 0 | 1 | 503 | 71 | 77% | 7.1 |
| Nurse Practitioner | 1 | 0 | 1 | 501 | 64 | 70% | 7.8 |
| Dental Services Staff | 1 | 0 | 1 | 483 | 63 | 68% | 7.7 |
| Occupational Therapy Aide | 2 | 0 | 2 | 458 | 59 | 64% | 7.5 |
| Therapeutic Recreation Specialist | 1 | 0 | 1 | 385 | 62 | 67% | 6.2 |
| Qualified Social Worker | 2 | 0 | 2 | 279 | 55 | 60% | 5.1 |
| Medication Aide/Technician | 1 | 0 | 1 | 274 | 34 | 37% | 8 |
| RN Director of Nursing | 1 | 0 | 1 | 166 | 22 | 24% | 7.6 |
| Medical Director | 0 | 1 | 1 | 60 | 20 | 22% | 3 |
| Occupational Therapy Assistant | 0 | 1 | 1 | 18 | 3 | 3% | 6 |
Federal penalties imposed by CMS for regulatory violations, including civil money penalties (fines) and denials of payment for new Medicare/Medicaid admissions.
Source: CMS Penalties Database
No penalties in the past 3 years
No civil money penalties or payment denials were reported in the last 3 years.
These measures show how residents usually do over time at this home, based on health outcomes and preventive care.
Washington average: 10.0
Washington average: 20.9
Washington average: 16.4%
Washington average: 21.8%
Washington average: 24.3%
Washington average: 2.6%
Washington average: 4.9%
Washington average: 1.7%
Washington average: 5.8%
Washington average: 16.2%
Washington average: 14.5%
Washington average: 96.2%
Washington average: 93.8%
Washington average: 1.38
Washington average: 1.51
Washington average: 88.1%
Washington average: 1.4%
Washington average: 82.0%
Washington average: 19.9%
Washington average: 13.2%
Washington average: 0.8%
Washington average: 53.7%
Washington average: 50.6%
Quality measures are calculated from Minimum Data Set (MDS) assessments. For most measures, lower percentages indicate better care quality.
48% of new residents, usually for short-term rehab.
45% of new residents, often for short stays.
7% of new residents, often for long-term daily care.
Source: CMS Long-Term Care Facility Characteristics (Data as of Jan 2026)
Residents meet regularly to discuss policies, care quality, and activities
Part of a Continuing Care Retirement Community offering multiple care levels
Organized group of residents that meets regularly to discuss facility policies, quality of life, and activities.
Data sourced from CMS Long-Term Care Facility Characteristics quarterly report. Payer mix reflects the current resident census by primary payment source.
Historical financial and operational data for Regency at Northpointe from 2011–2023, based on CMS SNF Cost Reports.
Key figures below are for fiscal year ending in 12/2023.
Based on CMS SNF Cost Report for fiscal year ending in 12/2023.
Most residents typically stay for a few weeks or months before returning home or moving on.
New residents most often arrive under Medicare (48% of admissions), and a typical Medicare stay runs around 1 months.
Coverage residents most often arrive under.
Coverage residents most often leave under.
![]() 6.2 miles from city center
6.2 miles from city center
![]() Estimated distance in miles from Spokane's city center to Regency at Northpointe's address, calculated via Google Maps.
Estimated distance in miles from Spokane's city center to Regency at Northpointe's address, calculated via Google Maps.
Add your location
Info below is compiled from CMS reports & the WA Dept. of Social & Health Services (DSHS), senior community websites & trusted data sources such as Walk Score & BBB.
Communities are listed from highest to lowest based on our ranking methodology.
| Regency at Northpointe | NH RC SNF | Spokane (Shiloh Hills) | 120
Facility
120
WA AVG
81
Rank
#46 / 355 |
75.3%
Facility
75.3%
WA AVG
73.6
Rank
#146 / 282 | +2% | 3.83
Facility
3.83
WA AVG
4.22
Rank
#48 / 61 | -41% | -9% | $8.3k
Facility
$8.3k
WA AVG
$87.7k
Rank
#25 / 61 | 15
Facility
15
WA AVG
48.9
Rank
#1 / 61 | 3.8
Facility
3.8
WA AVG
6.9
Rank
#8 / 61 | 1 | 90 | - |
37
Facility
37
WA AVG
51
Rank
#425 / 626 | Tod Dunfield | $16.2MFiscal year ending 12/2023
Facility
$16.2MFiscal year ending 12/2023
WA AVG
$13.2M
Rank
#20 / 61 | $8.8MFiscal year ending 12/2023
Facility
$8.8MFiscal year ending 12/2023
WA AVG
$5.7M
Rank
#18 / 61 | 54.4%Fiscal year ending 12/2023
Facility
54.4%Fiscal year ending 12/2023
WA AVG
45.5%
Rank
#19 / 61 | 505369 | ||||
| Rockwood South Hill | NH AL IL MC SNF | Spokane (Downtown Spokane) | 90
Facility
90
WA AVG
81
Rank
#127 / 355 | - | - | 5.77
Facility
5.77
WA AVG
4.22
Rank
#4 / 61 | +104% | +37% | $0
Facility
$0
WA AVG
$87.7k
Rank
#1 / 61 | 48
Facility
48
WA AVG
48.9
Rank
#33 / 61 | 12.0
Facility
12.0
WA AVG
6.9
Rank
#55 / 61 | - | 35 | A+ |
96
Facility
96
WA AVG
51
Rank
#15 / 626 | Chris Bafus | $24.8MFiscal year ending 05/2024
Facility
$24.8MFiscal year ending 05/2024
WA AVG
$13.2M
Rank
#6 / 61 | $15.9MFiscal year ending 05/2024
Facility
$15.9MFiscal year ending 05/2024
WA AVG
$5.7M
Rank
#5 / 61 | 64.3%Fiscal year ending 05/2024
Facility
64.3%Fiscal year ending 05/2024
WA AVG
45.5%
Rank
#44 / 61 | 505033 | ||||
| Aurora Valley Care | NH SNF | Spokane Valley | 124
Facility
124
WA AVG
81
Rank
#40 / 355 |
62.0%
Facility
62.0%
WA AVG
73.6
Rank
#221 / 282 | -16% | 3.54
Facility
3.54
WA AVG
4.22
Rank
#56 / 61 | -53% | -16% | $93.5k
Facility
$93.5k
WA AVG
$87.7k
Rank
#50 / 61 | 106
Facility
106
WA AVG
48.9
Rank
#59 / 61 | 5.6
Facility
5.6
WA AVG
6.9
Rank
#23 / 61 | 5 | 77 | - |
72
Facility
72
WA AVG
51
Rank
#132 / 626 | - | $10.1MFiscal year ending 12/2023
Facility
$10.1MFiscal year ending 12/2023
WA AVG
$13.2M
Rank
#51 / 61 | $4.7MFiscal year ending 12/2023
Facility
$4.7MFiscal year ending 12/2023
WA AVG
$5.7M
Rank
#53 / 61 | 46.8%Fiscal year ending 12/2023
Facility
46.8%Fiscal year ending 12/2023
WA AVG
45.5%
Rank
#48 / 61 | 505114 | ||||
| Spokane Falls Care | NH SNF | Spokane (Nevada Heights) | 100
Facility
100
WA AVG
81
Rank
#91 / 355 |
77.8%
Facility
77.8%
WA AVG
73.6
Rank
#130 / 282 | +6% | 4.42
Facility
4.42
WA AVG
4.22
Rank
#21 / 61 | -27% | +5% | $125.7k
Facility
$125.7k
WA AVG
$87.7k
Rank
#54 / 61 | 106
Facility
106
WA AVG
48.9
Rank
#59 / 61 | 6.2
Facility
6.2
WA AVG
6.9
Rank
#29 / 61 | 6 | 78 | - |
76
Facility
76
WA AVG
51
Rank
#107 / 626 | Navdeep Dhaliwal | $10.9MFiscal year ending 12/2023
Facility
$10.9MFiscal year ending 12/2023
WA AVG
$13.2M
Rank
#47 / 61 | $5.7MFiscal year ending 12/2023
Facility
$5.7MFiscal year ending 12/2023
WA AVG
$5.7M
Rank
#48 / 61 | 51.8%Fiscal year ending 12/2023
Facility
51.8%Fiscal year ending 12/2023
WA AVG
45.5%
Rank
#34 / 61 | 505024 |
Regency at Northpointe is located in Spokane, Washington State.
Here are the financial assistance programs available to residents in Washington State.
Regency at Northpointe is in the Shiloh Hills neighborhood.
Regency at Northpointe has a walk score of 37. Somewhat walkable. A few nearby services may be reachable on foot, but most trips require transportation.
Regency at Northpointe's occupancy is 74.0%.
No, Regency at Northpointe has a no-pet policy.
Regency at Northpointe is registered as a for-profit.
Yes — there is 1 photo of Regency at Northpointe in the photo gallery on this page.
Regency at Northpointe is located at 1224 E Westview Ct, Spokane, WA 99218.
Care Cost Calculator: See Prices in Your Area
Nursing Home Data Explorer
Don’t Wait Too Long: 7 Red Flag Signs Your Parent Needs Assisted Living Now
The True Cost of Assisted Living in 2025 – And How Families Are Paying For It
Understanding Senior Living Costs: Pricing Models, Discounts & Financial Assistance


