

Occupancy rate
94%

We arrange tours, appointments, and even moving support so you don’t have to

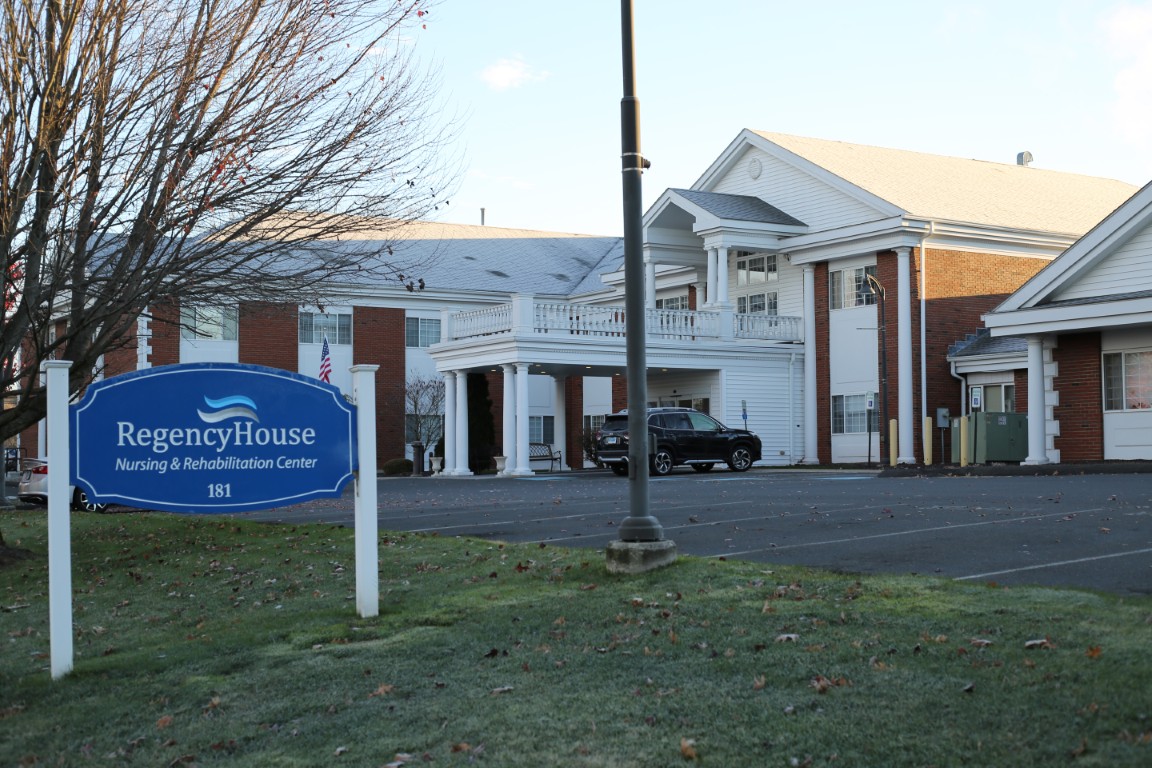
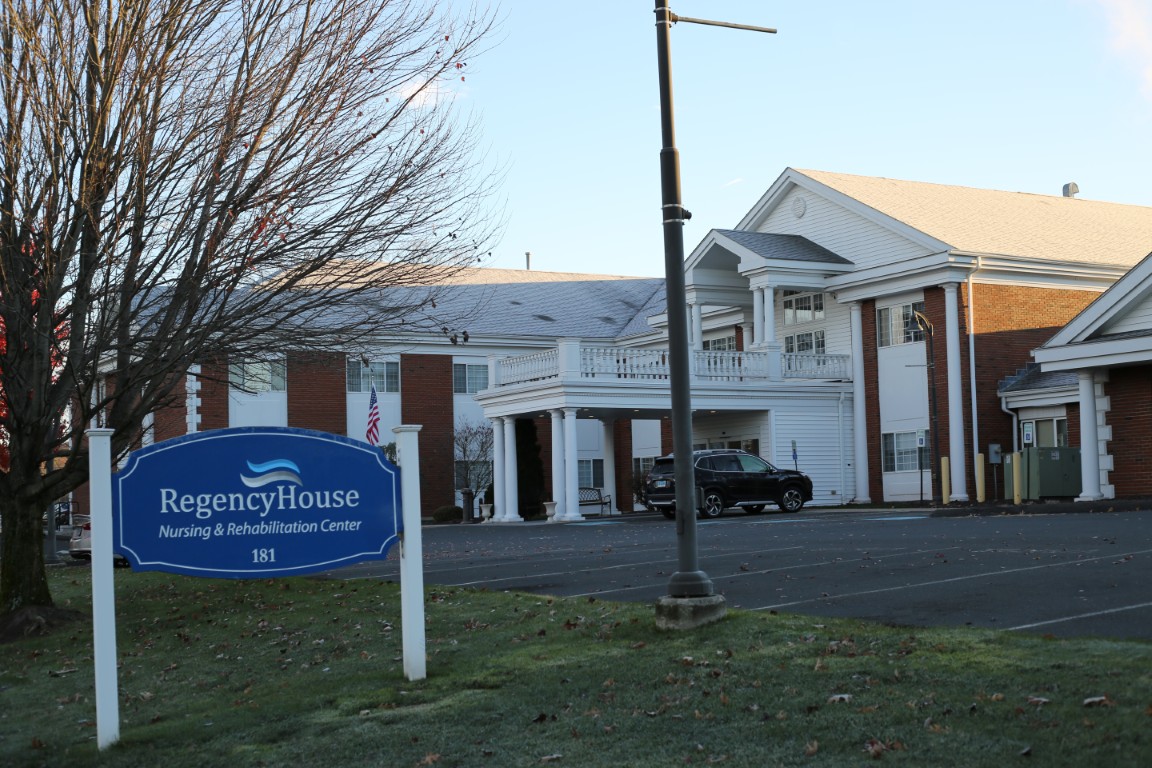
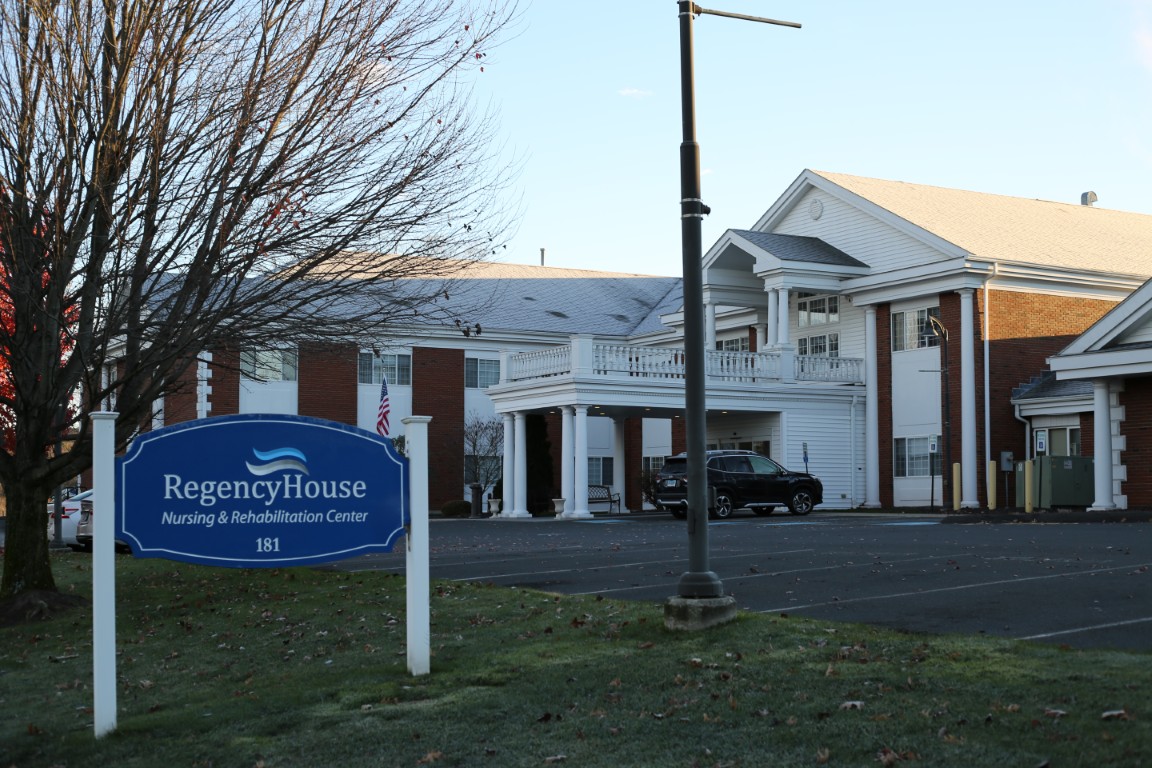


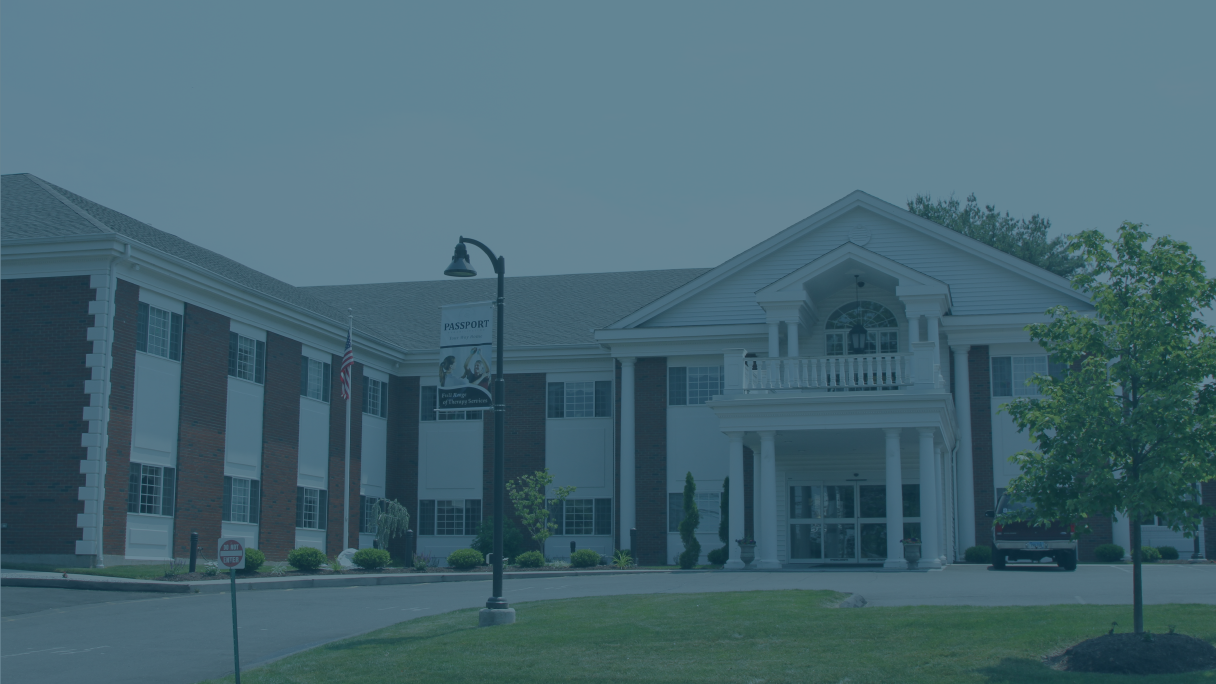


Regency House of Wallingford I is a nurturing nursing home in Wallingford, CT, that offers long-term care and short-term rehabilitation. Fostering healing and familiarity, the community features well-thought-out rooms in a supportive environment. Therapy services, medication management, and nutritious meals are just some of the exceptional services provided to enrich residents’ living experiences. The community also utilizes a person-centered approach to meet residents’ unique needs, ensuring they recover with ease.
Arts and crafts, cooking groups, and gardening are just some of the options provided for residents’ leisure and wellness. With plenty of thoughtfully designed amenities, including a fireplace, interior gardens, and a spacious courtyard, residents can surely relax and ease their worries. Grocery stores, bus stops, and other local amenities are located in the area’s proximity, ensuring accessibility and convenience. This nursing home is highly regarded for its exceptional standards, making it one of the finest options for senior living in Connecticut.
 Official CMS rating based on health inspections, staffing and quality measures.
Official CMS rating based on deficiencies found during state health inspections.
Official CMS rating based on nurse staffing hours per resident per day.
Official CMS rating based on clinical outcomes for residents.
Average daily nursing hours per resident (adjusted for acuity). Higher values indicate more nursing time per resident.
Hours of care per resident per day, broken down by staff type. Data from CMS Medicare.
Registered nurse hours per resident per day.
Nurse aide hours per resident per day.
Total number of nurse staff hours per resident per day on weekends.
Physical therapist staff hours per resident per day.
Registered nurse hours per resident per day on weekends.
Official CMS rating based on health inspections, staffing and quality measures.
Official CMS rating based on deficiencies found during state health inspections.
Official CMS rating based on nurse staffing hours per resident per day.
Official CMS rating based on clinical outcomes for residents.
Average daily nursing hours per resident (adjusted for acuity). Higher values indicate more nursing time per resident.
Hours of care per resident per day, broken down by staff type. Data from CMS Medicare.
Registered nurse hours per resident per day.
Nurse aide hours per resident per day.
Total number of nurse staff hours per resident per day on weekends.
Physical therapist staff hours per resident per day.
Registered nurse hours per resident per day on weekends.
Offers a balance of services and community atmosphere.
Occupancy is moderate, suggesting balanced demand.
Most residents typically stay for a few weeks or months before returning home or moving on.
50% of new residents, usually for short-term rehab.
49% of new residents, often for short stays.
1% of new residents, often for long-term daily care.
The portion of the home's budget spent on staff, including nurses, caregivers, and other employees who support care and operations.
All remaining costs needed to run the home, such as food, utilities, building maintenance, supplies and administrative expenses.
Key information about the people who lead and staff this community.
Building Type: 2-story
Dining Services
Social and Recreational Activities
Rehabilitative Support

On-site Medical Care and Health Services
Ways to qualify for care at this community, including accepted programs and payment options.
This facility is certified for eligible Medicaid services.
This facility is certified for eligible Medicare services.
In Connecticut, the Department of Public Health, Facility Licensing and Investigations Section conducts mandatory inspections and unannounced surveys to monitor the quality of care in long-term facilities.
7 routine inspections
7 with issues
1 without issues
Connecticut average: 13 visits/inspections
Deficiencies indicate regulatory issues. A higher number implies the facility had several areas requiring improvement.
The most recent inspection on September 24, 2025, found deficiencies related to a prior violation letter but confirmed those issues were corrected by August 39, 2025. Earlier inspections showed a pattern of citations involving resident care, medication management, infection control, and documentation, with some complaints substantiated and others unsubstantiated. Complaint investigations in 2020 and 2019 identified issues such as failure to notify physicians timely after falls, inadequate infection control practices during COVID-19, and medication errors, but enforcement actions like fines or license suspensions were not listed in the available reports. Most complaints were either unsubstantiated or addressed through plans of correction, and the facility submitted corrective plans and demonstrated improvements over time. The overall trend suggests the facility has worked to resolve prior deficiencies, with the most recent report indicating compliance with corrective measures.
Connecticut average 5.7
Last Health inspection on Aug 2025
Health citations are formal notices following inspections when they fail to comply with safety and care standards.
All 13 citations resulted from standard inspections.
Connecticut average: 0.3
Connecticut average: 0.7
Data sourced from CMS Health Deficiencies reports. Citation severity codes range from A (least serious) to L (most serious). Immediate Jeopardy (J-L) citations indicate situations where the facility's noncompliance has placed residents at risk of death or serious harm.
Nursing Homes 24/7 care needed
Nursing Homes 24/7 care needed
Nursing Homes 24/7 care needed
Nursing Homes 24/7 care needed
 River Glen Health Care Center
 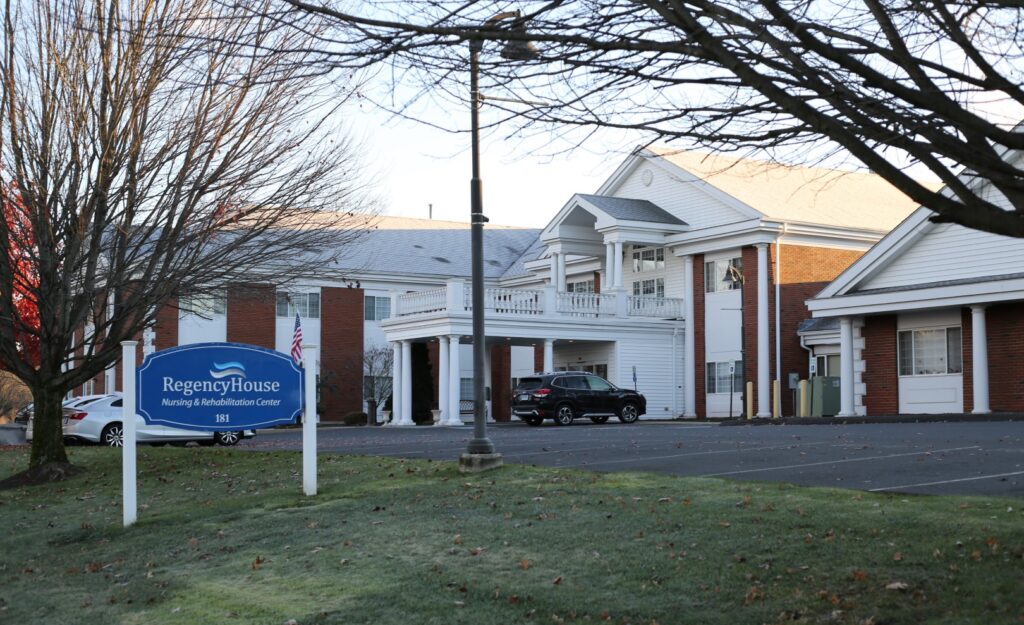 Regency House Of Wallingford I
  Lutheran Home Of Southbury Inc
  Laurel Ridge Health Care Center
![]() 1.5 miles from city center
1.5 miles from city center
![]() 181 E Main Street, Wallingford, CT 06492
181 E Main Street, Wallingford, CT 06492
Add your location
Source: CMS Payroll-Based Journal (Q2 2025)
| Role ⓘ | Count ⓘ | Avg Shift (hrs) ⓘ | Uses Contractors? ⓘ |
|---|---|---|---|
| Registered Nurse | 21 | 7.8 | No |
| Licensed Practical Nurse | 43 | 7.8 | No |
| Certified Nursing Assistant | 98 | 7.6 | No |
| Role ⓘ | Employees ⓘ | Contractors ⓘ | Total Staff ⓘ | Total Hours ⓘ | Days Worked ⓘ | % of Days ⓘ | Avg Shift (hrs) ⓘ |
|---|---|---|---|---|---|---|---|
| Certified Nursing Assistant | 98 | 0 | 98 | 26,454 | 91 | 100% | 7.6 |
| Licensed Practical Nurse | 43 | 0 | 43 | 12,349 | 91 | 100% | 7.8 |
| Registered Nurse | 21 | 0 | 21 | 4,816 | 91 | 100% | 7.8 |
| Respiratory Therapy Technician | 0 | 7 | 7 | 1,016 | 81 | 89% | 7.5 |
| Mental Health Service Worker | 2 | 0 | 2 | 918 | 64 | 70% | 8.2 |
| RN Director of Nursing | 2 | 0 | 2 | 918 | 64 | 70% | 8.3 |
| Other Dietary Services Staff | 2 | 0 | 2 | 826 | 80 | 88% | 7.1 |
| Physical Therapy Assistant | 0 | 10 | 10 | 736 | 76 | 84% | 6.3 |
| Physical Therapy Aide | 0 | 6 | 6 | 693 | 74 | 81% | 6.3 |
| Other Social Services Staff | 2 | 0 | 2 | 682 | 68 | 75% | 7.3 |
| Speech Language Pathologist | 0 | 5 | 5 | 505 | 68 | 75% | 6.9 |
| Dietitian | 1 | 0 | 1 | 448 | 56 | 62% | 8 |
| Nurse Practitioner | 1 | 0 | 1 | 440 | 55 | 60% | 8 |
| Administrator | 1 | 0 | 1 | 424 | 53 | 58% | 8 |
| Qualified Social Worker | 0 | 5 | 5 | 392 | 66 | 73% | 5.7 |
| Occupational Therapy Aide | 0 | 1 | 1 | 278 | 41 | 45% | 6.8 |
| Dental Services Staff | 1 | 0 | 1 | 205 | 40 | 44% | 5.1 |
| Occupational Therapy Assistant | 0 | 2 | 2 | 71 | 31 | 34% | 2 |
| Clinical Nurse Specialist | 1 | 3 | 4 | 39 | 6 | 7% | 6.5 |
| Medical Director | 0 | 1 | 1 | 27 | 12 | 13% | 2.2 |
Source: CMS Long-Term Care Facility Characteristics (Data as of Jan 2026)
Residents meet regularly to discuss policies, care quality, and activities
Organized group of residents that meets regularly to discuss facility policies, quality of life, and activities.
Data sourced from CMS Long-Term Care Facility Characteristics quarterly report. Payer mix reflects the current resident census by primary payment source.
These measures show how residents usually do over time at this home, based on health outcomes and preventive care.
Connecticut average: 10.4
Connecticut average: 21.1
Connecticut average: 18.9%
Connecticut average: 19.2%
Connecticut average: 24.9%
Connecticut average: 3.5%
Connecticut average: 4.6%
Connecticut average: 1.7%
Connecticut average: 6.3%
Connecticut average: 15.2%
Connecticut average: 17.2%
Connecticut average: 87.5%
Connecticut average: 93.5%
Connecticut average: 2.10
Connecticut average: 1.53
Connecticut average: 70.1%
Connecticut average: 1.5%
Connecticut average: 69.8%
Connecticut average: 25.0%
Connecticut average: 11.1%
Connecticut average: 0.8%
Connecticut average: 53.7%
Connecticut average: 50.6%
Quality measures are calculated from Minimum Data Set (MDS) assessments. For most measures, lower percentages indicate better care quality.
Historical financial and operational data for Regency House Of Wallingford I based on CMS SNF Cost Reports.
Loading trend charts...
Care Cost Calculator: See Prices in Your Area
Nursing Home Data Explorer
Don’t Wait Too Long: 7 Red Flag Signs Your Parent Needs Assisted Living Now
The True Cost of Assisted Living in 2025 – And How Families Are Paying For It
Understanding Senior Living Costs: Pricing Models, Discounts & Financial Assistance

Touring a community? Use this expert-backed checklist to stay organized, ask the right questions, and find the perfect fit.
We'll send you a PDF version of the touring checklist.


