


Total staff
76
Employees
74
Contractors
2
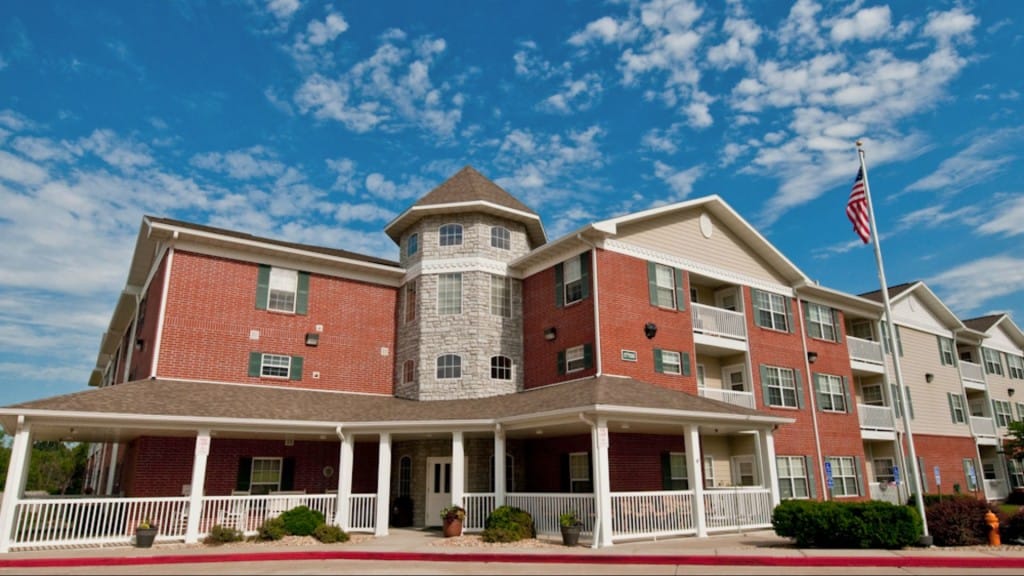


Regency Manor, located in Sterling Heights, Michigan, operates as a 39-bed nursing home. The facility accepts Medicare, Medicaid, and private-pay residents and currently houses 73 residents, with 89% covered by Medicaid and an average length of stay of 280 days. It holds a 1-star overall CMS rating.
Registered nurses provide 1 hour 37 minutes of care per resident daily; 83% above Michigan’s 53-minute average and an exceptionally high RN presence. Licensed practical nurses, by contrast, deliver only 6 minutes per resident per day, 88% below the state average of 49 minutes. Certified nursing aides average 2 hours 30 minutes daily, marginally below the state average. Weekend nursing dips to 2 hours 44 minutes per day, 28% below the state standard of 3 hours 47 minutes.
The facility’s staff-to-resident ratio of 1.04:1 underperforms the Michigan average of 1.70:1 by 39 percentage points, despite operating 76 full-time and part-time staff.
Falls with major injury occurred in 0.0% of short-stay residents versus the state average of 0.8%. At discharge, 61.5% of residents achieved or surpassed expected self-care ability, compared to the state average of 53.7%. Successful return to home or community was documented at 59.1%, outperforming the state average of 50.6%. Preventive metrics are strong: zero urinary tract infections, pneumococcal vaccination at 95.2%, and influenza vaccination at 87.5%.
Emergency department visits average 2.53 per 1,000 resident days; 68% worse than the Michigan average of 1.51.
Hospitalization rates of 1.68 per 1,000 days exceed the state average of 1.38 by 22 percent. Antipsychotic medication use reaches 18.8%, substantially exceeding the state average of 7.9%.
Functional decline composite scores are 20.7, 29% above the Michigan average of 16.0.
Increased need for daily activity assistance was documented in 24.3% of long-stay residents, double the state average of 16.2%.
Regulatory history includes one $9,000 civil money penalty in September 2023 and one payment denial; a serious action halting Medicare and Medicaid admissions for a period.
Occupancy dropped 6.4 percentage points year-over-year to 55.2%, below the Michigan average of 75.8%.
The facility operates at a loss of $380.1K, with payroll representing 44.7% of revenue, below the 51–63% range sustainable operations typically require.
Regency Manor serves primarily long-term Medicaid residents and shows measurable strengths in short-term rehabilitation outcomes, particularly discharge self-care ability and successful community return.
| Staff type | Hours / Day / Resident | vs state avg |
|---|---|---|
|
Registered Nurse (RN)
| 14m per day | ▼ 74% State avg: 53m per day · National avg: 41m per day |
|
LPN / LVN
| 38m per day | ▼ 22% State avg: 49m per day · National avg: 52m per day |
|
Nurse Aide
| 1h 50m per day | ▼ 32% State avg: 2h 41m per day · National avg: 2h 21m per day |
|
Weekend Total Nursing
| 2h 28m per day | ▼ 35% State avg: 3h 47m per day · National avg: 3h 26m per day |
|
Physical Therapist
| 4m per day | ▼ 23% State avg: 5m per day · National avg: 4m per day |
|
Weekend RN
| 10m per day | ▼ 74% State avg: 38m per day · National avg: 29m per day |
Reporting period: October 1 – December 31, 2025 (Q4 2025). Source: CMS Payroll-Based Journal report.
Manages medical care and health needs.
Assists with medical care and medications.
Helps with daily care and mobility.
Total hours from contractors
81 contractor hours this quarter
| Certified Nursing Assistant | 34 | 0 | 34 | 10,589 | 92 | 100% | 9.2 |
| Licensed Practical Nurse | 10 | 0 | 10 | 4,300 | 92 | 100% | 9.7 |
| Medication Aide/Technician | 10 | 0 | 10 | 2,757 | 91 | 99% | 10.9 |
| Physical Therapy Aide | 3 | 0 | 3 | 1,394 | 67 | 73% | 8 |
| Speech Language Pathologist | 2 | 0 | 2 | 906 | 67 | 73% | 7.4 |
| Dietitian | 2 | 0 | 2 | 730 | 66 | 72% | 8 |
| Qualified Social Worker | 2 | 0 | 2 | 729 | 69 | 75% | 7.3 |
| Clinical Nurse Specialist | 1 | 0 | 1 | 566 | 71 | 77% | 8 |
| Registered Nurse | 2 | 0 | 2 | 566 | 64 | 70% | 8.3 |
| Nurse Practitioner | 1 | 0 | 1 | 522 | 65 | 71% | 8 |
| Administrator | 1 | 0 | 1 | 512 | 64 | 70% | 8 |
| Mental Health Service Worker | 1 | 0 | 1 | 503 | 61 | 66% | 8.2 |
| Respiratory Therapy Technician | 1 | 0 | 1 | 465 | 61 | 66% | 7.6 |
| Physical Therapy Assistant | 1 | 0 | 1 | 463 | 62 | 67% | 7.5 |
| RN Director of Nursing | 2 | 0 | 2 | 312 | 41 | 45% | 7.2 |
| Other Dietary Services Staff | 1 | 0 | 1 | 174 | 24 | 26% | 7.3 |
| Occupational Therapy Aide | 0 | 1 | 1 | 51 | 15 | 16% | 3.4 |
| Occupational Therapy Assistant | 0 | 1 | 1 | 30 | 12 | 13% | 2.5 |
Includes penalties issued in 2023
Federal penalties imposed by CMS for regulatory violations, including civil money penalties (fines) and denials of payment for new Medicare/Medicaid admissions.
Source: CMS Penalties Database (Data as of Jan 2026)
Michigan average: $80K
Michigan average: 2.5
Michigan average: 0.2
Penalties are imposed by CMS for violations of federal nursing home regulations.
1 penalty in the past 3 years
Sep 23, 2023 · $9K
Last updated: Jan 2026
These measures show how residents usually do over time at this home, based on health outcomes and preventive care.
Michigan average: 8.6
Michigan average: 16.0
Michigan average: 16.2%
Michigan average: 16.2%
Michigan average: 15.7%
Michigan average: 3.2%
Michigan average: 4.4%
Michigan average: 0.8%
Michigan average: 3.5%
Michigan average: 2.9%
Michigan average: 7.9%
Michigan average: 97.3%
Michigan average: 97.9%
Michigan average: 1.38
Michigan average: 1.51
Michigan average: 90.4%
Michigan average: 1.4%
Michigan average: 19.9%
Michigan average: 13.2%
Michigan average: 0.8%
Michigan average: 53.7%
Michigan average: 50.6%
Quality measures are calculated from Minimum Data Set (MDS) assessments. For most measures, lower percentages indicate better care quality.
29% of new residents, usually for short-term rehab.
31% of new residents, often for short stays.
40% of new residents, often for long-term daily care.
Source: CMS Long-Term Care Facility Characteristics (Data as of Jan 2026)
Residents meet regularly to discuss policies, care quality, and activities
Organized group of residents that meets regularly to discuss facility policies, quality of life, and activities.
Data sourced from CMS Long-Term Care Facility Characteristics quarterly report. Payer mix reflects the current resident census by primary payment source.
Historical financial and operational data for Regency Manor from 2011–2023, based on CMS SNF Cost Reports.
Based on CMS SNF Cost Report for fiscal year ending in 12/2023.
Most residents stay for extended periods and receive ongoing daily care.
New residents most often arrive under Medicaid (40% of admissions), and a typical Medicaid stay runs around 2 years.
Coverage residents most often arrive under.
Coverage residents most often leave under.
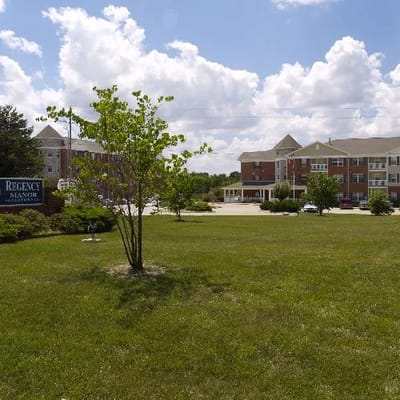
Regency Manor is located in Sterling Heights, Michigan.
Here are the financial assistance programs available to residents in Michigan.
Regency Manor has a walk score of 32. Somewhat walkable. A few nearby services may be reachable on foot, but most trips require transportation.
Regency Manor's occupancy is 55.2%.
Regency Manor is registered as a for-profit.
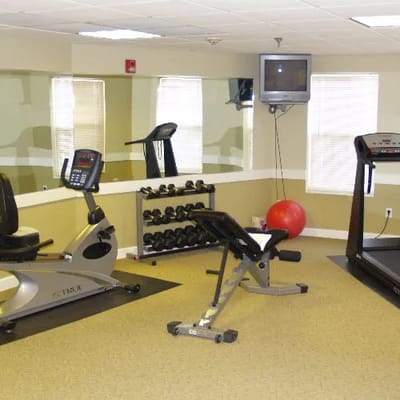
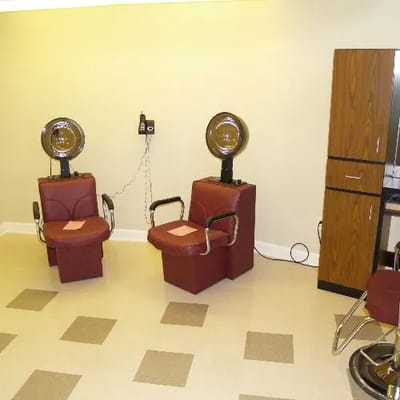
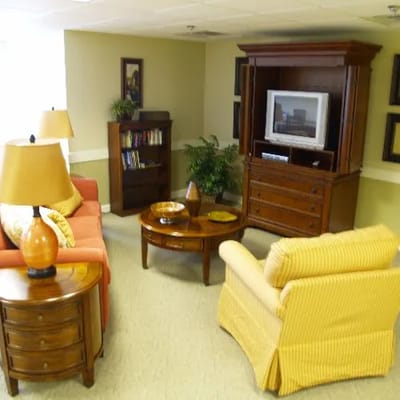
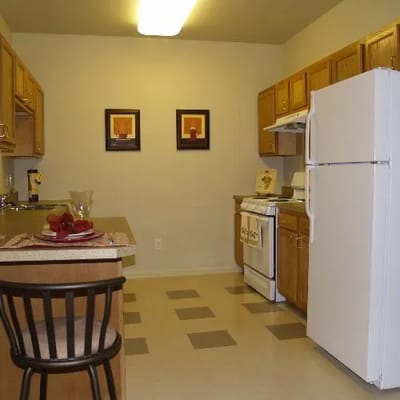
Yes — there are 11 photos of Regency Manor in the photo gallery on this page.
(509) 682-2551 will put you in contact with the team at Regency Manor.
Yes — Regency Manor is a CMS-certified provider of Medicare and Medicaid.
Care Cost Calculator: See Prices in Your Area
Nursing Home Data Explorer
Don’t Wait Too Long: 7 Red Flag Signs Your Parent Needs Assisted Living Now
The True Cost of Assisted Living in 2025 – And How Families Are Paying For It
Understanding Senior Living Costs: Pricing Models, Discounts & Financial Assistance


