Explore Open Rooms

1 Contact details
2 What type of senior care service are you looking for?
3 What budget do you have in mind for senior care?
4 How soon do you need to find care?
5 Additional details

Thank you for your interest!

Our team will be in touch shortly to help with next steps.

Memory Care Home

Riderwood Village

Memory Care Home

Riderwood Village

3140 Gracefield Rd, Silver Spring, MD 20904 View map
Overview of Riderwood Village

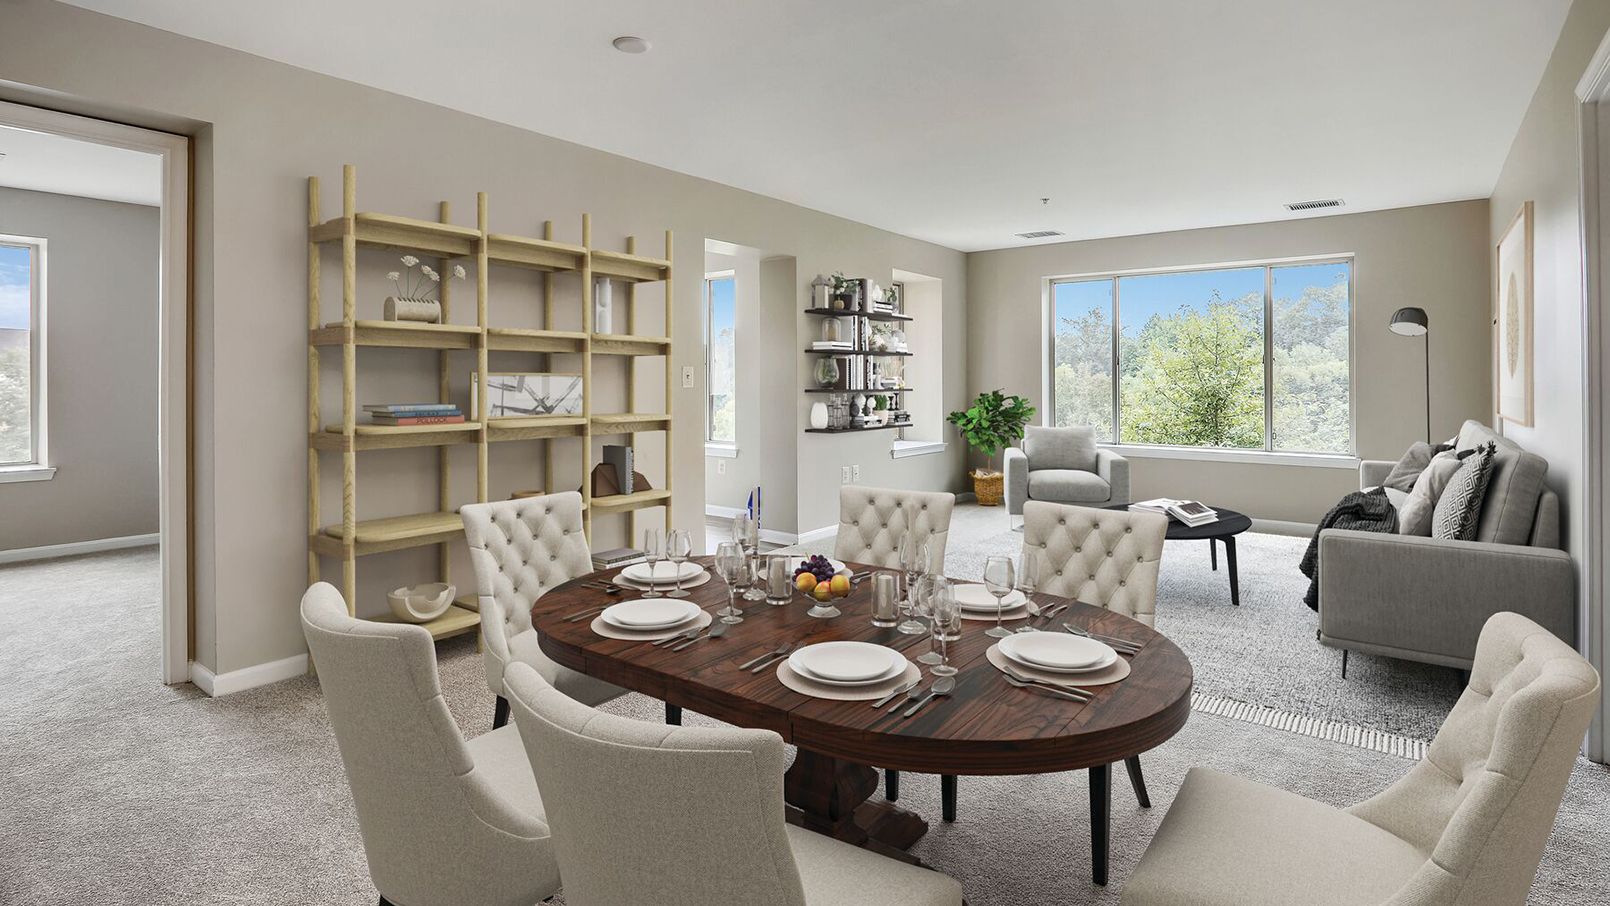
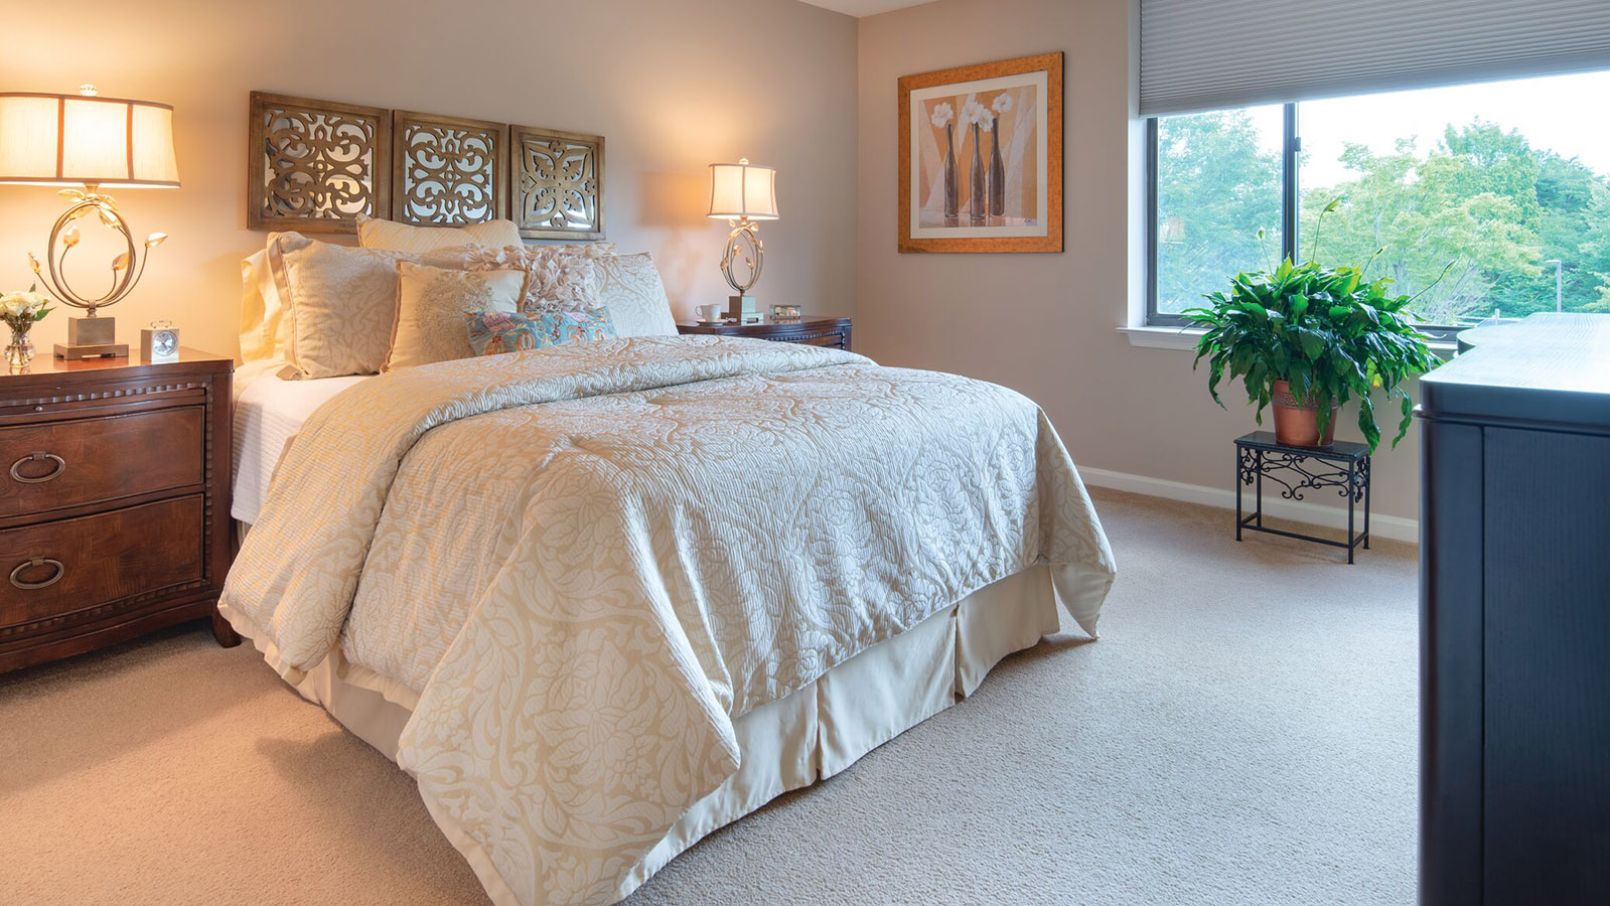
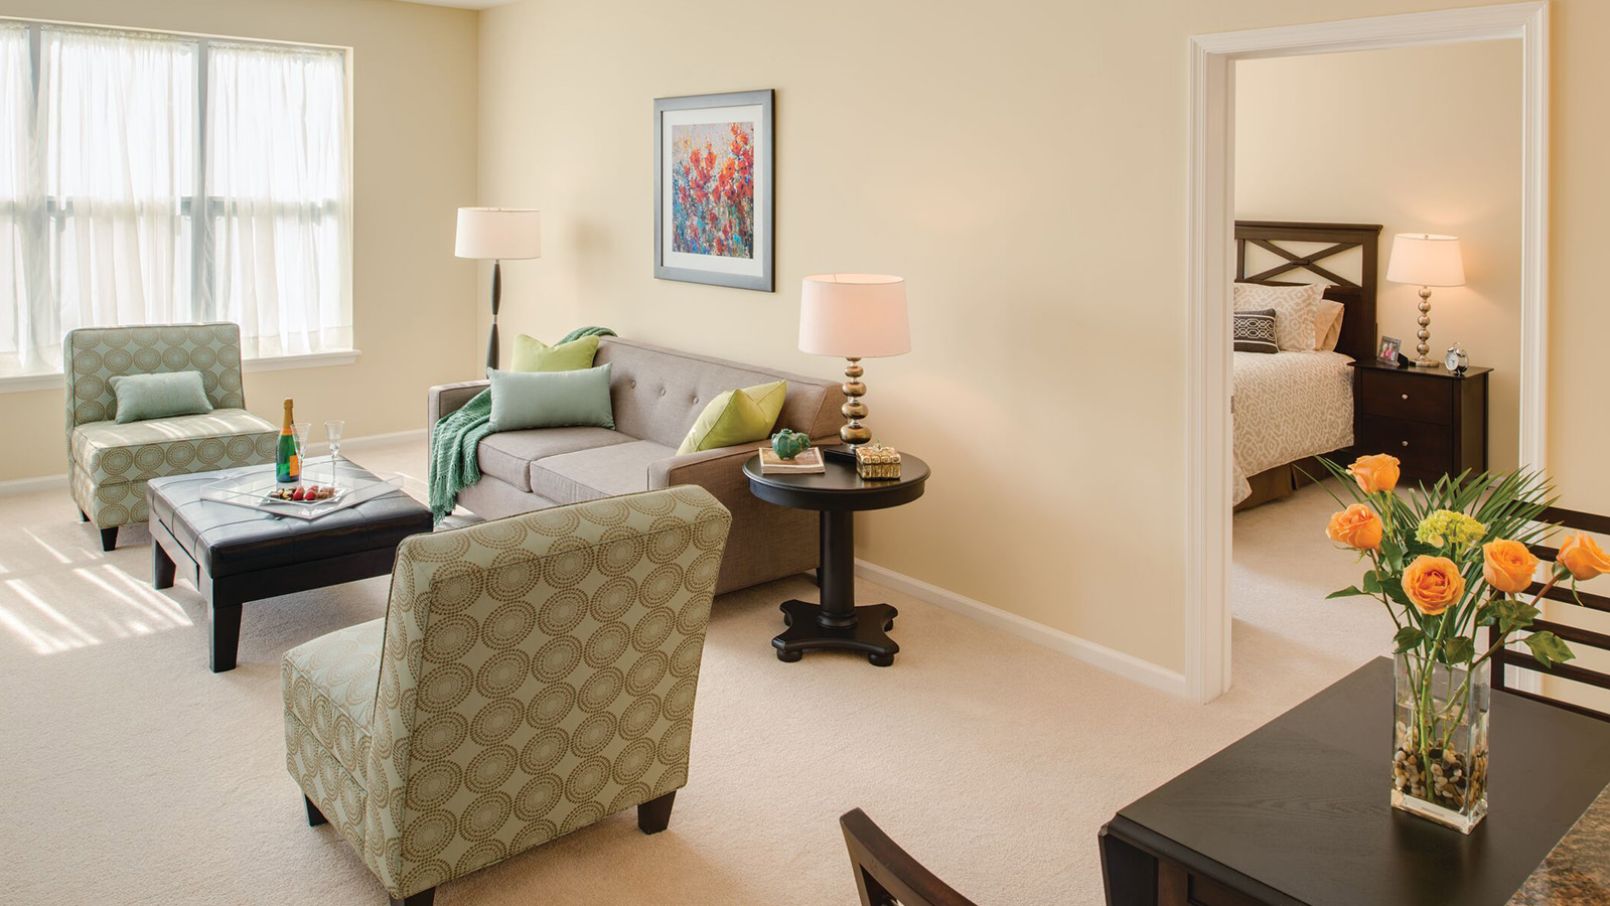
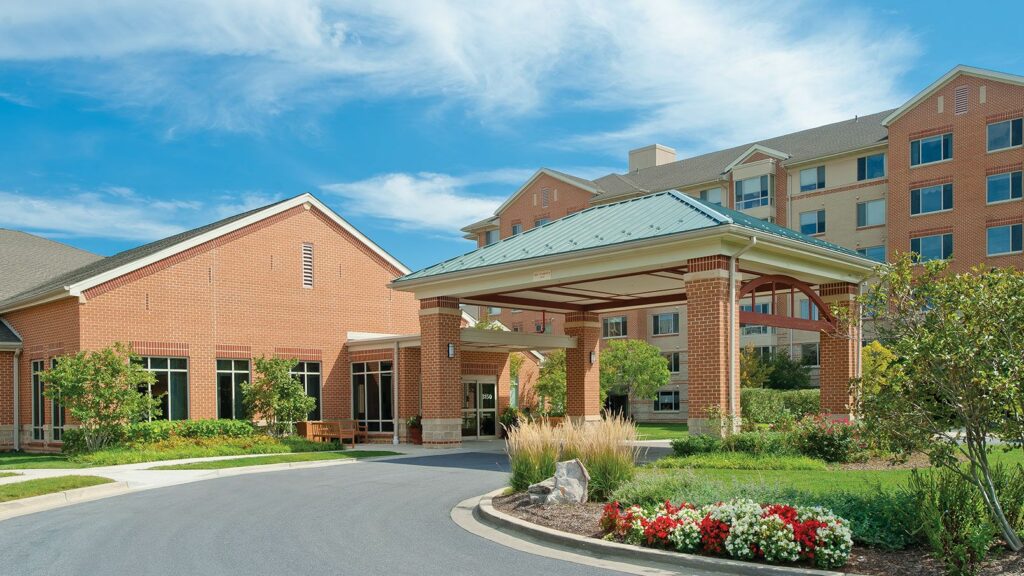
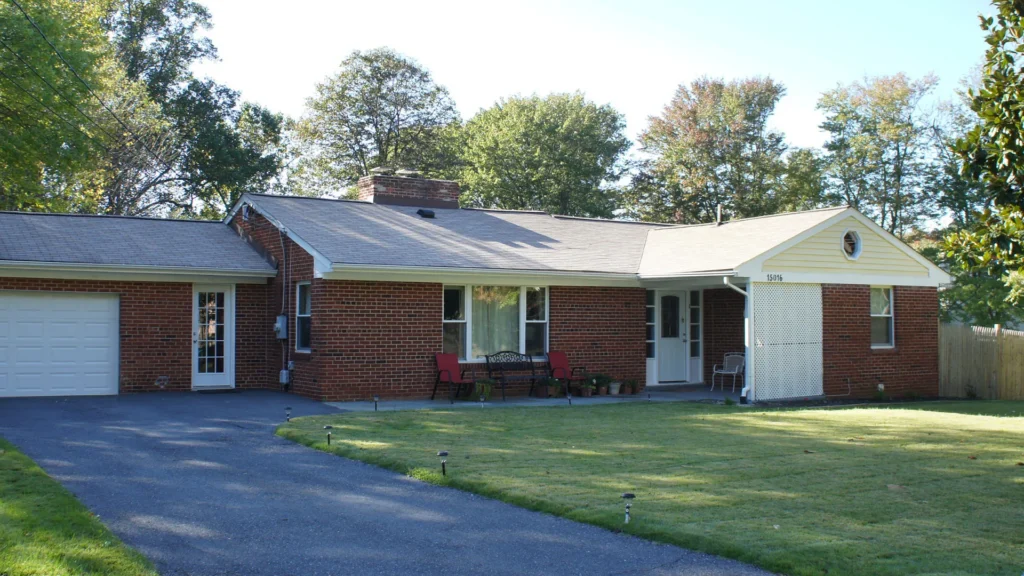
Riderwood Village is an ideal place that provides programs and activities that are enjoyable and nurturing. Offering assisted living, memory care, long-term care, and rehabilitation– their approach to modern senior living promotes a lifestyle centered on growth. Residents are able to learn to love life through the staff’s encouragement of purposeful living. At Riderwood Village, residents are able to feel comfortable and safe because of the welcoming environment that is balanced with the urban and vibrant atmosphere.

As an Erickson Senior Living Community, seniors are able to discover endless opportunities in the community: from having chef-prepared meals to digesting what they just ate by walking on the walking trails nearby; or from squeezing in a workout before getting a haircut at the salon/barbershop; or having personal care assistance with bathing and dressing to requesting transportation services to get to medical appointments. 

Quality ratings

Measured by Centers for Medicare & Medicaid Services (CMS)

Overall rating Info The Overall CMS Rating combines results from health inspections, staffing levels and quality measures. Health inspections carry the most weight. Staffing and quality scores can increase or decrease the final rating based on performance compared to state and national standards.
5/5
Maryland average: 3.4/5
Health Inspection Info Based on the results of the facility's three most recent standard inspections and any complaint investigations. CMS reviews the number, scope, and severity of deficiencies, with more recent findings weighted more heavily.
5/5
Maryland average: 3.2/5
Staffing Info Measures average nursing staff hours per resident per day, including Registered Nurses (RNs) and total nursing staff. Ratings are adjusted based on the level of care residents require and are compared to state and national benchmarks.
5/5
Maryland average: 3.5/5
Quality Measures Info Based on clinical and physical health indicators reported to CMS, such as hospital readmissions, falls, pressure ulcers, and improvements in mobility. These measures reflect how well residents' health needs are being managed.
4/5
Maryland average: 3.7/5

Nursing care per resident

Info This shows how many total hours of nursing staff time are available per resident each day. Higher numbers usually mean more staff support.
4h 54m per day

This home provides 14% more nursing time per resident than the Maryland average.

Maryland average: 4h 17m per day

Capacity and availability

High-capacity home

May provide extensive amenities, services and programs.

Total beds 275

This home usually has availability

Lower occupancy suggests more openings may be available.

Lower demand than the Maryland average
Occupancy rate 73.9%
Residents per day (avg) 70
Occupancy rate
73.9%
Residents per day (avg)
70

Who this home usually serves

TYPE OF STAY

Mostly short-term rehab stays

Most residents typically stay for a few weeks or months before returning home or moving on.

Might be optimal for
Short stays Recovery Medicare-covered care

Breakdown by payment type

Medicare

62% of new residents, usually for short-term rehab.

Typical stay 1 - 2 months

Private pay

38% of new residents, often for short stays.

Typical stay 4 - 5 months

Finances and operations

Voluntary non-profit community
Home revenue
$176.2M
Surplus of revenue
$27.8M
Voluntary non-profit community
Home revenue
$176,215,180.00
Surplus of revenue
$27,846,111.00
Payroll costs Info The portion of the home's budget spent on staff, including nurses, caregivers, and other employees who support care and operations.
$55.3M
31.4% of revenue
Other operating costs Info All remaining costs needed to run the home, such as food, utilities, building maintenance, supplies and administrative expenses.
$93.1M
Total costs $148.4M
Bed community size
275-bed community
A large-scale community that may provide a wide range of amenities, services, and structured programs.
Years in operation
23 years in operation
A longer operating history, which may indicate experience navigating regulations and delivering ongoing care.
Walk Score
Walk Score: 33 / 100
Somewhat walkable. A few nearby services may be reachable on foot, but most trips require transportation.

Services

Secure Alzheimer's Unit
24-hour Awake Staff
Alzheimer's Care
Barber Services
Beauty Services
Behavioral Management
Catheter Care
Colostomy Care

About this community

Occupancy

Occupancy rate
74%
23% higher than Maryland average

Maryland average: 60%

Occupied beds
203 / 275
Average residents 104 per day

License details

County: Prince George's

Additional licensing details

CMS Certification Number: 215343

Ownership & operating entity

Profit status: false

Room costs

Apartment $268 - $523 per day

Hospice Affiliations

Holy Cross Home Care & Hospice
Jewish Social Service Agency Hospice
Montgomery Hospice & Prince George's Hospice

Staffing

Key information about the people who lead and staff this community.

Leadership

CNA Training Program

Care Services

Mild Alzheimer's Level
Moderate Alzheimer's Level
Severe Alzheimer's Level

Additional Policies & Features

Continuing Care Retirement Community (CCRC)

Types of Care at Riderwood Village

Assisted Living Memory Care Skilled Nursing
Contact Riderwood Village

Demographics

Resident demographic information for this facility.

Gender

  • Female 71.3%
  • Male 28.7%

Age Distribution

  • 85-94 51.9%
  • 75-84 23.2%
  • 95+ 22.8%
  • 65-74 2.1%

Ethnicity

  • White 89.5%
  • African American 6.8%
  • Asian 3.4%
  • Hispanic 0.4%

Health Inspection History

Inspections
Total health inspections 3

Maryland average 3.9


Last Health inspection on Sep 2025

Total health citations 18

Maryland average 49.9

Citations per inspection
6

Maryland average 12.81


Health citations are formal notices following inspections when they fail to comply with safety and care standards.

17 of 18 citations resulted from standard inspections; and 1 of 18 came from combined inspections (standard and complaint).

Breakdown of citation severity (last 3 years)
Critical Health citations More info 0
100% better than Maryland average

Maryland average: 0.5


Serious Health citations More info 0
100% better than Maryland average

Maryland average: 0.6

0 critical citations More info Maryland average: 0.5

0 serious citations More info Maryland average: 0.6

17 moderate citations More info Maryland average: 47.2

1 minor citation More info Maryland average: 1.7
Citations history (last 3 years)
Environmental moderate citation Info Issues related to building safety, cleanliness, maintenance, and overall living conditions. Sep 22, 2025
Corrected

Environmental moderate citation Info Issues related to building safety, cleanliness, maintenance, and overall living conditions. Sep 22, 2025
Corrected

Infection Control moderate citation Info Issues related to preventing and controlling infections, including hygiene practices and safety protocols. Sep 22, 2025
Corrected

Quality of Care moderate citation Info Issues related to how well residents receive appropriate treatment and support for their medical and daily care needs. Sep 22, 2025
Corrected

Compare Assisted Living around Silver Spring The information below is reported by the Maryland Department of Health, Office of Health Care Quality.

Riderwood Village
AL

Assisted Living A licensed, long-term care setting for seniors or individuals with disabilities who need help with daily activities — like bathing, dressing, and medication management — but not 24-hour skilled nursing. Offers housing, meals, and around-the-clock support while aiming to maximize resident independence.

MC

Memory Care Secured, specialized care for people living with Alzheimer's or dementia. Staff trained in cognitive impairment, with higher staff-to-resident ratios and an environment designed to reduce confusion and wandering risk.

NH

Nursing Home Licensed facility providing 24/7 skilled nursing care for residents with complex, ongoing medical needs. Staffed by RNs, LPNs, and CNAs. Inspected and star-rated annually by CMS. Accepts Medicare (short-term rehab) and Medicaid (long-term care).

Silver Spring
117
No
33
-
Apple Blossoms Assisted Living
AL

Assisted Living A licensed, long-term care setting for seniors or individuals with disabilities who need help with daily activities — like bathing, dressing, and medication management — but not 24-hour skilled nursing. Offers housing, meals, and around-the-clock support while aiming to maximize resident independence.

Silver Spring
5
No
6
Private / Semi-Private Rooms
APEX Luxurious Living
AL

Assisted Living A licensed, long-term care setting for seniors or individuals with disabilities who need help with daily activities — like bathing, dressing, and medication management — but not 24-hour skilled nursing. Offers housing, meals, and around-the-clock support while aiming to maximize resident independence.

Silver Spring
5
No
68
Private / Semi-Private Rooms
Colesville Eldercare
AL

Assisted Living A licensed, long-term care setting for seniors or individuals with disabilities who need help with daily activities — like bathing, dressing, and medication management — but not 24-hour skilled nursing. Offers housing, meals, and around-the-clock support while aiming to maximize resident independence.

RC

Respite Care Short-term temporary care — days to weeks — to give family caregivers a break. Full care provided during the stay. Often used after hospitalization or to trial a facility before a permanent placement decision.

Silver Spring
5
No
70
Private Rooms
Montgomery Eldercare at Eastway Drive
AL

Assisted Living A licensed, long-term care setting for seniors or individuals with disabilities who need help with daily activities — like bathing, dressing, and medication management — but not 24-hour skilled nursing. Offers housing, meals, and around-the-clock support while aiming to maximize resident independence.

Silver Spring
-
No
-
-

Places of interest near Riderwood Village

Address 7.3 miles from city center — 4.31 miles to nearest hospital (UM Laurel Medical Center)

Address 3140 Gracefield Rd, Silver Spring, MD 20904

Calculate Travel Distance to Riderwood Village

Add your location

Address

Staffing Data (Q2 2025)

This data corresponds to Q2 2025 and is based on CMS Payroll-Based Journal.

Total staff 172
Employees 169
Contractors 3
Staff to resident ratio 2.39:1
32% better than Maryland average

Maryland average ratio: 1.81:1

Avg staff/day 53
Average shift 7.4 hours
8% worse than Maryland average

Maryland average: 8 hours

Total staff hours (quarter) 35,810
Nursing staff breakdown
Registered Nurse

Manages medical care and health needs.

Total count 17
Average shift length Info Average shift length. Calculated as total hours divided by days worked and average staff per day. 7.1 hours

No contractors work on this role.

Licensed Practical Nurse

Assists with medical care and medications.

Total count 14
Average shift length Info Average shift length. Calculated as total hours divided by days worked and average staff per day. 8.5 hours

No contractors work on this role.

Certified Nursing Assistant

Helps with daily care and mobility.

Total count 55
Average shift length Info Average shift length. Calculated as total hours divided by days worked and average staff per day. 7.6 hours

No contractors work on this role.

Contractor staffing

Total hours from contractors

1.2%

434 contractor hours this quarter

Respiratory Therapy Technician: 1 Occupational Therapy Assistant: 1 Medical Director: 1
Staff by category
Certified Nursing Assistant5505517,06791100%7.6
Clinical Nurse Specialist170174,4179099%7.6
Licensed Practical Nurse140144,09091100%8.5
Registered Nurse170173,22191100%7.1
Medication Aide/Technician360361,6128492%8.1
Respiratory Therapy Technician8197836774%6.1
Physical Therapy Assistant6067796976%5.3
Occupational Therapy Aide2027116571%7.1
Administrator2025766066%8
Nurse Practitioner1014806066%8
Dietitian1014725965%8
Other Dietary Services Staff1014725965%8
Mental Health Service Worker2024484853%8
Dental Services Staff1012963741%8
Qualified Social Worker4041523437%4.5
Medical Director0111301314%10
Speech Language Pathologist20264910%6.4
Occupational Therapy Assistant011404651%0.9
55 Certified Nursing Assistant
% of Days 100%
17 Clinical Nurse Specialist
% of Days 99%
14 Licensed Practical Nurse
% of Days 100%
17 Registered Nurse
% of Days 100%
36 Medication Aide/Technician
% of Days 92%
9 Respiratory Therapy Technician
% of Days 74%
6 Physical Therapy Assistant
% of Days 76%
2 Occupational Therapy Aide
% of Days 71%
2 Administrator
% of Days 66%
1 Nurse Practitioner
% of Days 66%
1 Dietitian
% of Days 65%
1 Other Dietary Services Staff
% of Days 65%
2 Mental Health Service Worker
% of Days 53%
1 Dental Services Staff
% of Days 41%
4 Qualified Social Worker
% of Days 37%
1 Medical Director
% of Days 14%
2 Speech Language Pathologist
% of Days 10%
1 Occupational Therapy Assistant
% of Days 51%

Facility Characteristics

Source: CMS Long-Term Care Facility Characteristics (Data as of Jan 2026)

Total census
72 residents
Residents by payment source
Medicare
11 residents (15.3%)
Medicaid
15 residents (20.8%)
Private pay or other
46 residents (63.9%)
Programs & Services
Residents' Group

Residents meet regularly to discuss policies, care quality, and activities

Family Member Group

Family members meet regularly to discuss policies, care quality, and activities

CCRC

Part of a Continuing Care Retirement Community offering multiple care levels

Active Family Council

Organized group of family members that meets regularly to discuss facility policies, resident care, and activities.

Active Resident Council

Organized group of residents that meets regularly to discuss facility policies, quality of life, and activities.

Quality of care over time

These measures show how residents usually do over time at this home, based on health outcomes and preventive care.

High-risk clinical events score Info A composite score based on pressure ulcers, falls with injury, weight loss, walking ability decline, and activities of daily living decline. 6.6
49% better than Maryland average

Maryland average: 12.9

Functional decline score Info A composite score based on activities of daily living decline, walking ability decline, and incontinence. 17.8
31% better than Maryland average

Maryland average: 25.7

Long-stay resident measures
Need for Help with Daily Activities Increased Info Percent of long-stay residents whose need for help with daily activities has increased 16.0%
33% better than Maryland average

Maryland average: 23.7%

Low Risk Residents with Bowel/Bladder Incontinence Info Percent of low risk long-stay residents who lose control of their bowels or bladder 19.6%
25% better than Maryland average

Maryland average: 25.9%

Falls with Major Injury Info Percent of long-stay residents experiencing one or more falls with major injury 1.5%
35% better than Maryland average

Maryland average: 2.3%

High Risk Residents with Pressure Ulcers Info Percent of long-stay high risk residents with pressure ulcers 4.2%
36% better than Maryland average

Maryland average: 6.5%

Urinary Tract Infection Info Percent of long-stay residents with a urinary tract infection 2.0%
25% worse than Maryland average

Maryland average: 1.6%

Lost Too Much Weight Info Percent of long-stay residents who lose too much weight 4.9%
16% better than Maryland average

Maryland average: 5.8%

Depressive Symptoms Info Percent of long-stay residents who have depressive symptoms 0.0%
100% better than Maryland average

Maryland average: 20.2%

Antipsychotic Use Info Percent of long-stay residents who received an antipsychotic medication 14.4%
11% worse than Maryland average

Maryland average: 12.9%

Pneumococcal Vaccine Info Percent of long-stay residents assessed and appropriately given the pneumococcal vaccine 99.0%
8% better than Maryland average

Maryland average: 92.0%

Influenza Vaccine Info Percent of long-stay residents assessed and appropriately given the seasonal influenza vaccine 96.4%
In line with Maryland average

Maryland average: 96.6%

Short-stay resident measures
Pneumococcal Vaccine Info Percent of short-stay residents assessed and appropriately given the pneumococcal vaccine 92.8%
18% better than Maryland average

Maryland average: 78.4%

Antipsychotic medication increase Info Percent of short-stay residents who newly received an antipsychotic medication 2.6%
88% worse than Maryland average

Maryland average: 1.4%

Influenza Vaccine Info Percent of short-stay residents assessed and appropriately given the seasonal influenza vaccine 86.8%
8% better than Maryland average

Maryland average: 80.6%

Guides for Better Senior Living

Care Cost Calculator: See Prices in Your Area

Nursing Home Data Explorer

Don’t Wait Too Long: 7 Red Flag Signs Your Parent Needs Assisted Living Now

The True Cost of Assisted Living in 2025 – And How Families Are Paying For It

Understanding Senior Living Costs: Pricing Models, Discounts & Financial Assistance

Financial Aid for Maryland Seniors

Get financial aid guidance

Community Options Waiver

Maryland Medicaid Community Options Waiver

Age 65+ or disabled, Maryland resident, Medicaid- eligible, nursing home-level care need.

~$2,829/month (300% FBR, individual).

$2,000 (individual), $3,000 (couple) (excludes home, car).

High urban demand; rural outreach efforts.

Senior Care Program

Maryland Senior Care

Age 65+, Maryland resident, at risk of nursing home placement.

~$2,000/month (individual, varies by county).

$11,000 (individual).

Limited funding; waitlists common in high-demand areas.

Maryland Nursing Home Medicaid

Maryland Medical Assistance (Medicaid) Nursing Home Program

Age 65+, Maryland resident, Medicaid-eligible, requires nursing home-level care.

$943/month (individual); most income applied to care costs.

$2,500 (individual), $3,000 (couple); spousal protections up to $155,356.

Home equity limit $636,000; estate recovery applies post-55.

Senior Assisted Living Subsidy Program

Maryland Senior Assisted Living Group Home Subsidy

Age 62+, Maryland resident, in or moving to approved assisted living, low/moderate income.

~$34,000/year (individual, varies by county).

Not strict; prioritizes low-income.

Not available statewide; facility must be licensed by MDH.

Veterans Aid and Attendance (A&A) Benefit

Maryland VA Aid and Attendance

Wartime veteran/spouse, age 65+ or disabled, needs ADL help, Maryland resident.

Net income minus medical expenses < $1,984/month (individual with A&A).

$155,356 (net worth limit).

High veteran population in suburban/rural areas.

Senior Prescription Drug Assistance Program (SPDAP)

Maryland Senior Prescription Drug Assistance Program

Age 65+, Maryland resident (6+ months), Medicare Part D enrolled.

$48,560/year (individual, 300% FPL).

None specified.

Supplements Medicare Part D; annual enrollment required.

Medicare Savings Programs (MSP)

Maryland Medicare Savings Programs

Age 65+, Maryland resident, Medicare Part A/B enrollee.

$2,014/month (QMB), $2,706/month (SLMB/QI, individual).

$9,090 (individual), $13,630 (couple).

Includes QMB, SLMB, QI categories.

Community Personal Assistance Services (CPAS)

Maryland Medicaid Community Personal Assistance Services

Age 65+, Maryland resident, Medicaid-eligible, needs ADL assistance.

$943/month (individual); spend-down available.

$2,500 (individual), $3,000 (couple).

Consumer-directed option allows hiring family caregivers.

Tour Icon
Planning a tour? Check our touring checklist.
Chat Icon
Thinking of living here? We can help you speak to a current resident