Riverview Rehabilitation & Healthcare Center

Nursing Home in Cranston

CMS overall rating Info The Overall CMS Rating is scored from 1 to 5 stars and combines results from health inspections, staffing levels, and quality measures. Health inspections carry the most weight. Staffing and quality scores can increase or decrease the final rating based on performance compared to state and national standards.
Calculator: See prices in your area
Riverview Rehabilitation & Healthcare Center accepts Medicare, Medicaid, and private pay.

Overview of Riverview Rehabilitation & Healthcare Center

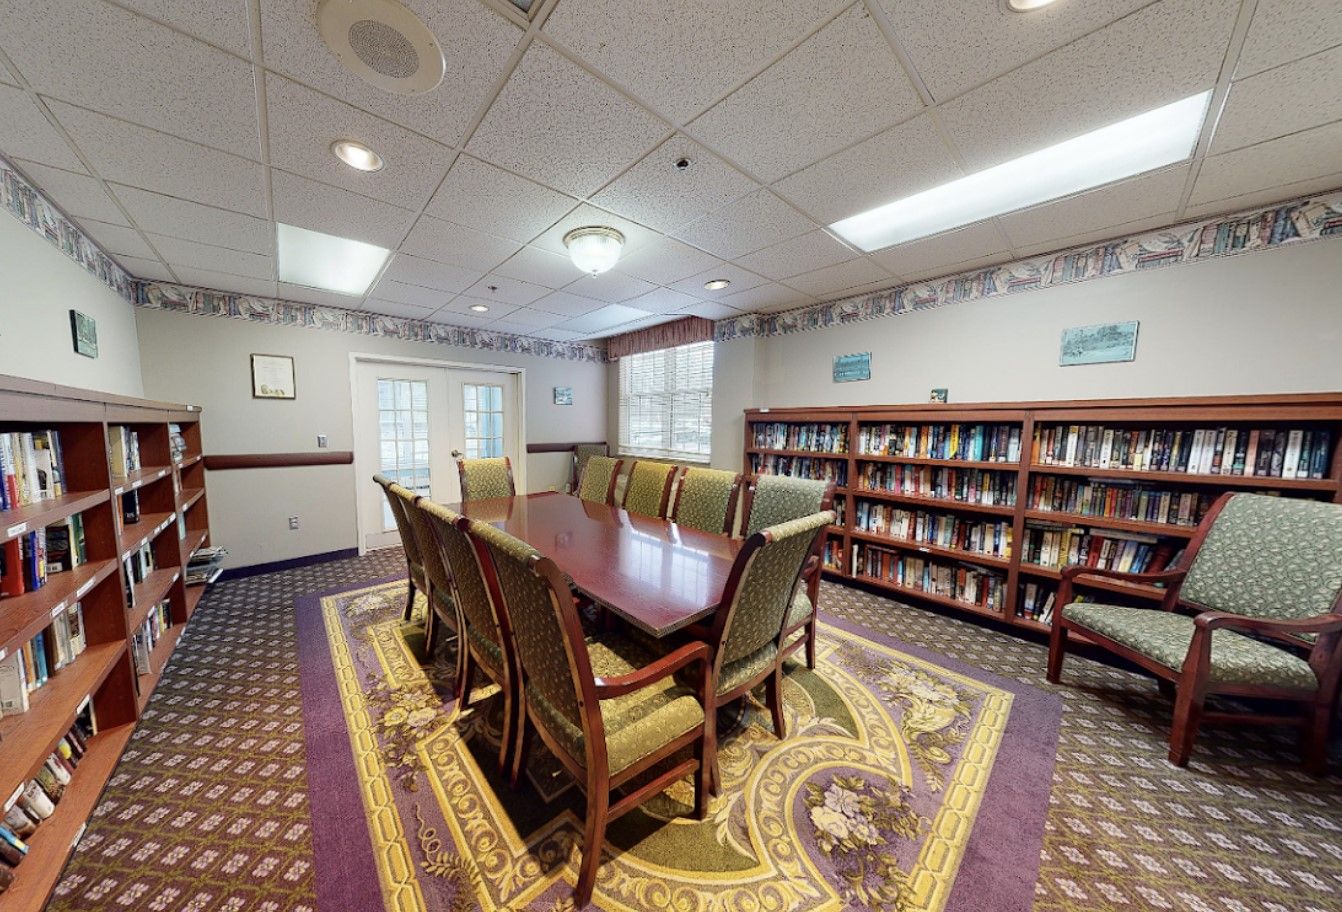
Offering nursing home care in Cranston, Rhode Island, Riverview Rehabilitation & Healthcare Center is an assisted living community known for its devoted team of compassionate physicians, nurses, and healthcare professionals. Their collective mission is to elevate and enrich the quality of life for each senior resident under their care. Their unwavering dedication extends to addressing all patients’ and residents’ physical, emotional, and spiritual needs, ensuring a holistic approach to healthcare and well-being.

(401) 821-6837

Managed by Gretchen Sechio

Administrator

Gretchen Sechio serves as the Administrator at Riverview Rehabilitation & Healthcare Center, overseeing clinical services and ensuring quality care for residents. She leads the community with a focus on compassionate and professional healthcare management.

Quality ratings

Measured by Centers for Medicare & Medicaid Services (CMS)

Overall rating Info The Overall CMS Rating combines results from health inspections, staffing levels and quality measures. Health inspections carry the most weight. Staffing and quality scores can increase or decrease the final rating based on performance compared to state and national standards.
3/5 ▲ 0.1 Rhode Island average: 2.9/5
Health Inspection Info Based on the results of the facility's three most recent standard inspections and any complaint investigations. CMS reviews the number, scope, and severity of deficiencies, with more recent findings weighted more heavily.
3/5 ▲ 0.3 Rhode Island average: 2.7/5
Staffing Info Measures average nursing staff hours per resident per day, including Registered Nurses (RNs) and total nursing staff. Ratings are adjusted based on the level of care residents require and are compared to state and national benchmarks.
3/5 ▼ 0.7 Rhode Island average: 3.7/5
Quality Measures Info Based on clinical and physical health indicators reported to CMS, such as hospital readmissions, falls, pressure ulcers, and improvements in mobility. These measures reflect how well residents' health needs are being managed.
4/5 ▲ 0.9 Rhode Island average: 3.1/5

Staffing hours breakdown

Info Daily nursing hours per resident by staff type, reported to CMS. Higher is generally better — compare this facility to state and national averages to see where staffing stands.

Hours per resident per day — compared to Rhode Island state averages

Total nursing care / resident Info This home is ranked 44th out of 53 homes in Rhode Island.

Total adjusted nursing hours per resident per day, combining RN, LPN, and aide time. CMS adjusts this for case-mix so facilities can be fairly compared.
3h 23m per day
Rank #44 / 53Nurse hours — state benchmarkedThis home is ranked 44th out of 53 homes in Rhode Island.Shows adjusted nurse hours per resident per day benchmarked to the Rhode Island average, with a ranking across 53 Rhode Island SNFs. More hours mean more direct care. The national average is about 3.5 hrs; below 3.0 is a red flag.
This facility Rhode Island avg (4h 6m per day)
vs Rhode Island avg
-17%

3 of 5 metrics below state avg

Standout metric LPN / LVN is +52% above state avg
Staff typeHours / dayvs state avg
Registered Nurse (RN) Info RNs hold the highest nursing license and can assess residents, interpret test results, and direct care plans. More RN hours per day often signals stronger clinical oversight and faster response to health changes. 32m per day ▼ 30% State avg: 46m per day · National avg: 41m per day
LPN / LVN Info Licensed Practical Nurses (LPNs) or Licensed Vocational Nurses (LVNs) deliver routine hands-on care — medication administration, wound dressing, and monitoring vital signs. They work under RN supervision and make up a large share of daily bedside care. 44m per day ▲ 52% State avg: 29m per day · National avg: 52m per day
Nurse Aide Info Certified Nurse Aides (CNAs) provide the most direct day-to-day assistance: bathing, dressing, feeding, and mobility. Nurse aide hours are typically the largest staffing category and directly affect residents' quality of life. 2h 15m per day ▼ 9% State avg: 2h 28m per day · National avg: 2h 21m per day
Total Nursing (Weekend) Info Combined nursing hours (RN + LPN + Nurse Aide) per resident per day on weekends. Staffing often drops on weekends — this figure reveals whether the facility maintains adequate coverage outside of weekday hours. 3h 23m per day ■ Avg State avg: 3h 18m per day · National avg: 3h 26m per day
RN (Weekend) Info Registered nurse hours specifically on weekends. Facilities sometimes reduce RN presence on Saturdays and Sundays — a low weekend RN figure compared to weekday hours can indicate reduced clinical oversight when most administrative staff are absent. 18m per day ▼ 47% State avg: 34m per day · National avg: 29m per day

Capacity and availability

Avg. Length of Stay
108 days

Who this home usually serves

TYPE OF STAY

Primarily short stays

Residents typically stay for brief periods, with frequent admissions and discharges throughout the year.

Breakdown by payment type

Medicare

19% of new residents, usually for short-term rehab.

Typical stay 26 days

Private pay

62% of new residents, often for short stays.

Typical stay 1 - 2 months

Medicaid

19% of new residents, often for long-term daily care.

Typical stay 1 years

Finances and operations

Privately-owned community
Operated by a business corporation.
Home revenue
$23.0M
Profit
$875.2K
Privately-owned community Operated by a business corporation.
Home revenue
$23.0M Rank #7 / 53Revenue — state benchmarkedThis home is ranked 7th out of 53 homes in Rhode Island.Shows this facility's annual revenue compared to the Rhode Island SNF average. Higher revenue generally means more resources for staffing and capital — read alongside Payroll %.
Profit
$875.2K
Payroll costs Info The portion of the home's budget spent on staff, including nurses, caregivers, and other employees who support care and operations. Rank #5 / 53Payroll — state benchmarkedThis home is ranked 5th out of 53 homes in Rhode Island.Shows total annual staff payroll benchmarked to the Rhode Island average. Higher payroll investment relative to peers often signals better staffing and less reliance on cheaper contract labor.
$8.8M
38.3% of revenue Rank #33 / 53Payroll % — state benchmarkedThis home is ranked 33rd out of 53 homes in Rhode Island.Shows payroll as a percentage of revenue versus the Rhode Island average. Well-run SNFs often land around 55–65%. Below 25% may signal understaffing or heavy agency use — read with Staffing ratings.
Other operating costs Info All remaining costs needed to run the home, such as food, utilities, building maintenance, supplies and administrative expenses.
$13.3M
Total costs $22.1M
Bed community size
190-bed community
A large-scale community that may provide a wide range of amenities, services, and structured programs.
Years in operation
4 years in operation
An established community with some operational experience and growing routines.
Walk Score
Walk Score: 24 / 100 Rank #25 / 31Walk Score — state benchmarkedThis home is ranked 25th out of 31 homes in Rhode Island.Shows how walkable this facility's neighborhood is compared to the average Walk Score across Rhode Island SNFs. Higher scores benefit residents, families, and staff.
Car-dependent. Most errands require a car, with limited nearby walkable options.

About this community

Occupancy

Occupancy rate
13%
Rank #52 / 54Occupancy rate — state benchmarkedThis home is ranked 52nd out of 54 homes in Rhode Island.Shows this facility's occupancy rate versus the Rhode Island average, with its statewide rank out of 54. Higher occupancy signals strong local demand and financial stability.
Lower than the Rhode Island average: 83.7%
Occupied beds
24 / 190
Average residents 95 per day

License Details

Facility TypeNursing Facility
StatusActive
IssuanceJanuary 12, 2022
ExpirationDecember 31, 2025
License NumberLTC00826

Ownership & Operating Entity

Riverview Rehabilitation & Healthcare Center is legally operated by Gretchen Sechio.

Types of Care at Riverview Rehabilitation & Healthcare Center

Nursing Home Memory Care

Contact Riverview Rehabilitation & Healthcare Center

Inspection History

In Rhode Island, the Department of Health, Center for Health Facilities Regulation is the primary authority for inspecting, licensing, and reporting on all long-term care facilities.

15 visits/inspections Info Inspections are mandatory, regular evaluations conducted by state health departments or regulatory agencies. They ensure the community provides safe, compliant care, covering areas like resident health, staff and management.

Latest inspection

Date December 5, 2025
Complaint Investigation

68 deficiencies

Deficiencies indicate regulatory issues. A higher number implies the facility had several areas requiring improvement.

Rhode Island average: 34 deficiencies

Inspection Report Summary for Riverview Rehabilitation & Healthcare Center

The most recent inspection on December 5, 2025, identified a deficiency related to insufficient nursing staff during the night shift on the subacute unit. Earlier inspections showed a pattern of deficiencies involving resident care, including wound care, medication management, infection control, and safety issues such as abuse investigations and environmental hazards. Several complaint investigations were substantiated, including cases of resident-to-resident sexual abuse, medication errors, and failure to notify providers of significant changes in resident condition. Enforcement actions such as fines or license suspensions were not listed in the available reports. The facility’s inspection history shows ongoing challenges, with some issues persisting over time and no clear overall improvement trend.

Health Inspection History

Inspections
Total health inspections 12

Rhode Island average 8.3


Last Health inspection on Jan 2025

Total health citations
45 Rank #45 / 53Health citations — state benchmarkedThis home is ranked 45th out of 53 homes in Rhode Island.Shows this facility's total health deficiency citations benchmarked to the Rhode Island state average, with a ranking across all 53 RI SNFs. Lower citation counts earn a better rank.

Rhode Island average 28.1

Citations per inspection
3.75 Rank #30 / 53Citations per inspection — state benchmarkedThis home is ranked 30th out of 53 homes in Rhode Island.Shows average deficiency citations per CMS inspection for this facility versus the Rhode Island mean across 53 SNFs with citation data. Lower is better.

Rhode Island average 3.48


Health citations are formal notices following inspections when they fail to comply with safety and care standards.

25 of 45 citations resulted from standard inspections; and 20 of 45 resulted from complaint investigations.

Breakdown of citation severity (last 3 years)
Critical Health citations More info
1
38% better than Rhode Island average

Rhode Island average: 1.6


Serious Health citations More info 0
100% better than Rhode Island average

Rhode Island average: 1.7

1 critical citation More info Rhode Island average: 1.6

0 serious citations More info Rhode Island average: 1.7

44 moderate citations More info Rhode Island average: 24.3

0 minor citations More info Rhode Island average: 0.5
Citations history (last 3 years)
Quality of Care moderate citation Info Issues related to how well residents receive appropriate treatment and support for their medical and daily care needs. Jan 28, 2025
Corrected

Environmental moderate citation Info Issues related to building safety, cleanliness, maintenance, and overall living conditions. Jan 03, 2025
Corrected

Infection Control moderate citation Info Issues related to preventing and controlling infections, including hygiene practices and safety protocols. Jan 03, 2025
Corrected

Nutrition moderate citation Info Issues related to food quality, meal service, and resident's nutritional needs. Jan 03, 2025
Corrected

Financial Assistance for
Nursing Home in Rhode Island

Riverview Rehabilitation & Healthcare Center is located in Coventry, Rhode Island.
Here are the financial assistance programs available to residents in Rhode Island.

Get Financial aid guidance

Rhode Island Home and Community Care Services

RI Medicaid HCCS

Age 65+ or disabled
General Rhode Island resident, Medicaid-eligible, nursing home-level care need.
Income Limits (2025) ~$2,829/month 300% FBR, individual
Asset Limits $4,000 individual, higher than most states
RI

Higher asset limit; small state aids quicker processing.

Benefits
Personal care (5-7 hours/day) Respite (240 hours/year) Adult day care ($65/day) Home modifications ($1,500 avg.)

Rhode Island Caregiver Support Program

RI NFCSP Respite

Age Caregiver of someone 60+ (or with dementia)
General Rhode Island resident.
Income Limits No strict limit; prioritizes low-income.
Asset Limits Not applicable.
RI

Limited slots; urban focus due to small size.

Benefits
In-home respite (4-6 hours/day) Adult day care (~$65/day) Short-term facility care (up to 5 days)

Program of All-Inclusive Care for the Elderly (PACE)

Rhode Island PACE

Age 55+
General RI resident (specific counties), NFLOC, safe with PACE support.
Income Limits (2025) ~$2,829/month (Medicaid-eligible); private pay option available.
Asset Limits $4,000 (individual), $6,000 (couple) for Medicaid enrollees.
RI

Operated by PACE Organization of Rhode Island; covers 4 counties (Providence, Kent, Washington, Newport).

Benefits
Personal care (5-7 hours/day) Medical care Meals Transportation Respite Therapies

@Home Cost Share Program

Rhode Island @Home Cost Share

Age 65+
General RI resident, need help with 1+ ADL/IADL, not Medicaid-eligible.
Income Limits (2025) ~$1,255-$2,829/month (100%-300% FPL); sliding scale fees.
Asset Limits Not strictly assessed; focus on income/need.
RI

Administered by Division of Elderly Affairs (DEA); complements Medicaid.

Benefits
Personal care (4-6 hours/week) Homemaker services Respite (~5 days/year) Transportation

SSI Enhanced Assisted Living Program

Rhode Island SSI Enhanced AL

Age 65+ (or disabled)
General RI resident, SSI-eligible, living in approved AL facility.
Income Limits (2025) $943/month (SSI federal rate) + state supplement ($332/month).
Asset Limits $2,000 (individual), $3,000 (couple).
RI

Supplement increases to ~$1,275/month total for AL residents; ~50 facilities participate.

Benefits
Financial aid (~$332/month extra) for AL costs (personal care, meals, activities)

Medicare Savings Program (MSP)

Rhode Island Medicare Savings Program

Age 65+ or disabled
General RI resident, Medicare Part A/B.
Income Limits (2025) ~$2,510/month (QMB), ~$3,380/month (SLMB), ~$3,598/month (QI)—individual.
Asset Limits $9,430 (individual), $14,130 (couple).
RI

Three tiers; includes Extra Help for Part D; no waitlist.

Benefits
Covers Part B premiums ($174.70/month) Deductibles ($240/year) Copays (~20%)

Low-Income Home Energy Assistance Program (LIHEAP)

Rhode Island LIHEAP

Age 60+ prioritized
General RI resident, low-income household.
Income Limits (2025) ~$3,970/month individual, 185% FPL
Asset Limits Not assessed; income-focused.
RI

Covers gas, electric, oil; emergency aid available.

Benefits
Heating/cooling aid ($300-$1,000/season) Emergency aid ($500 max)

VA Aid and Attendance (A&A) and Housebound Benefits

Rhode Island VA Aid and Attendance/Housebound

Age 65+ or disabled veteran/spouse
General RI resident, wartime service, need for ADL help (A&A) or homebound.
Income Limits (2025) Net income < ~$1,984/month (veteran with dependent, A&A); pension offsets income.
Asset Limits ~$155,356 net worth limit
RI

High veteran demand; supports rural/urban care needs.

Benefits
Cash (~$1,433-$2,642/month veteran, ~$951-$1,318 spouse) for care costs (e.g., in-home, assisted living)

Senior Farmers’ Market Nutrition Program (SFMNP)

Rhode Island SFMNP

Age 60+
General RI resident, low-income.
Income Limits (2025) ~$2,322/month individual, 185% FPL
Asset Limits Not assessed.
RI

Vouchers (~$50/season); serves ~10,000 annually.

Benefits
Vouchers (~$50/season) for fresh produce at approved markets

Property Tax Relief for Seniors

Rhode Island Property Tax Relief Credit

Age 65+ (or disabled)
General RI resident, homeowner/renter, low-income.
Income Limits (2025) ~$35,000/year household
Asset Limits Not assessed; income-focused.
RI

Credit up to $400; local exemptions vary by municipality.

Benefits
Tax credit (~$100-$400/year avg., depending on income)

Places of interest near Riverview Rehabilitation & Healthcare Center

Address 8.1 miles from city center Info Estimated distance in miles from Coventry's city center to Riverview Rehabilitation & Healthcare Center's address, calculated via Google Maps. — 6.07 miles to nearest hospital (University Neurology)

Calculate Travel Distance to Riverview Rehabilitation & Healthcare Center

Add your location

Address

Staffing Data (Q2 2025)

This data corresponds to Q2 2025 and is based on CMS Payroll-Based Journal.

Total staff 224
Employees 203
Contractors 21
Staff to resident ratio 1.29:1
27% worse than Rhode Island average

Rhode Island average ratio: 1.76:1

Avg staff/day 95
Average shift 7.8 hours
0% compared with Rhode Island average

Rhode Island average: 7.6 hours

Total staff hours (quarter) 67,385
Nursing staff breakdown
Registered Nurse

Manages medical care and health needs.

Total count 25
Average shift length Info Average shift length. Calculated as total hours divided by days worked and average staff per day. 7.3 hours

This role is partially covered by contractors.

Licensed Practical Nurse

Assists with medical care and medications.

Total count 34
Average shift length Info Average shift length. Calculated as total hours divided by days worked and average staff per day. 8.7 hours

No contractors work on this role.

Certified Nursing Assistant

Helps with daily care and mobility.

Total count 105
Average shift length Info Average shift length. Calculated as total hours divided by days worked and average staff per day. 7.7 hours

No contractors work on this role.

Contractor staffing

Total hours from contractors

5.4%

3,619 contractor hours this quarter

Physical Therapy Assistant: 6 Speech Language Pathologist: 6 Physical Therapy Aide: 4 Respiratory Therapy Technician: 3 Registered Nurse: 1 Qualified Social Worker: 1
Staff by category
Certified Nursing Assistant105010533,85591100%7.7
Licensed Practical Nurse3403410,86091100%8.7
Registered Nurse241255,61091100%7.3
Medication Aide/Technician110113,05291100%9.3
Clinical Nurse Specialist9092,7837481%7.9
Other Dietary Services Staff6062,55791100%7.2
Dental Services Staff5051,2438998%6
Physical Therapy Aide0441,2197077%7.1
Mental Health Service Worker3031,1296976%7.7
RN Director of Nursing2021,0216774%8.3
Speech Language Pathologist0661,0197077%7.3
Physical Therapy Assistant0664747178%6.2
Dietitian1014645864%8
Administrator1014605864%7.9
Nurse Practitioner1014245358%8
Respiratory Therapy Technician0334237582%5.5
Qualified Social Worker0114085055%8.2
Occupational Therapy Aide1013844853%8
105 Certified Nursing Assistant
% of Days 100%
34 Licensed Practical Nurse
% of Days 100%
25 Registered Nurse
% of Days 100%
11 Medication Aide/Technician
% of Days 100%
9 Clinical Nurse Specialist
% of Days 81%
6 Other Dietary Services Staff
% of Days 100%
5 Dental Services Staff
% of Days 98%
4 Physical Therapy Aide
% of Days 77%
3 Mental Health Service Worker
% of Days 76%
2 RN Director of Nursing
% of Days 74%
6 Speech Language Pathologist
% of Days 77%
6 Physical Therapy Assistant
% of Days 78%
1 Dietitian
% of Days 64%
1 Administrator
% of Days 64%
1 Nurse Practitioner
% of Days 58%
3 Respiratory Therapy Technician
% of Days 82%
1 Qualified Social Worker
% of Days 55%
1 Occupational Therapy Aide
% of Days 53%

Facility Characteristics

Source: CMS Long-Term Care Facility Characteristics (Data as of Jan 2026)

Total residents 174
Medicare
5
2.9% of residents
Medicaid
101
58% of residents
Private pay or other
68
39.1% of residents
Programs & Services
Residents Group

Residents meet regularly to discuss policies, care quality, and activities

Active Resident Council

Organized group of residents that meets regularly to discuss facility policies, quality of life, and activities.

Quality of care over time

These measures show how residents usually do over time at this home, based on health outcomes and preventive care.

High-risk clinical events score Info A composite score based on pressure ulcers, falls with injury, weight loss, walking ability decline, and activities of daily living decline. 8.6
17% better than Rhode Island average

Rhode Island average: 10.3

Functional decline score Info A composite score based on activities of daily living decline, walking ability decline, and incontinence. 18.3
9% better than Rhode Island average

Rhode Island average: 20.2

Long-stay resident measures
Above average Rhode Island avg: 3.2 Info CMS star rating based on long-stay quality measure performance. 5 stars = significantly above average, 1 star = significantly below average.
Need for Help with Daily Activities Increased Info Percent of long-stay residents whose need for help with daily activities has increased 17.4%
11% better than Rhode Island average

Rhode Island average: 19.5%

Walking Ability Worsened Info Percent of long-stay residents whose ability to move independently worsened 12.1%
34% better than Rhode Island average

Rhode Island average: 18.2%

Low Risk Residents with Bowel/Bladder Incontinence Info Percent of low risk long-stay residents who lose control of their bowels or bladder 25.3%
11% worse than Rhode Island average

Rhode Island average: 22.9%

Falls with Major Injury Info Percent of long-stay residents experiencing one or more falls with major injury 3.3%
11% better than Rhode Island average

Rhode Island average: 3.7%

High Risk Residents with Pressure Ulcers Info Percent of long-stay high risk residents with pressure ulcers 4.8%
In line with Rhode Island average

Rhode Island average: 4.7%

Urinary Tract Infection Info Percent of long-stay residents with a urinary tract infection 2.0%
12% better than Rhode Island average

Rhode Island average: 2.3%

Lost Too Much Weight Info Percent of long-stay residents who lose too much weight 5.3%
In line with Rhode Island average

Rhode Island average: 5.4%

Depressive Symptoms Info Percent of long-stay residents who have depressive symptoms 63.7%
373% worse than Rhode Island average

Rhode Island average: 13.5%

Antipsychotic Use Info Percent of long-stay residents who received an antipsychotic medication 19.0%
11% better than Rhode Island average

Rhode Island average: 21.5%

Pneumococcal Vaccine Info Percent of long-stay residents assessed and appropriately given the pneumococcal vaccine 99.4%
7% better than Rhode Island average

Rhode Island average: 93.1%

Influenza Vaccine Info Percent of long-stay residents assessed and appropriately given the seasonal influenza vaccine 97.6%
In line with Rhode Island average

Rhode Island average: 95.3%

Hospitalizations per 1,000 days Info Number of hospitalizations per 1,000 long-stay resident days. 0.55
62% better than Rhode Island average

Rhode Island average: 1.46

ED visits per 1,000 days Info Number of outpatient emergency department visits per 1,000 long-stay resident days. 1.42
17% better than Rhode Island average

Rhode Island average: 1.72

Short-stay resident measures
Above average Rhode Island avg: 2.4 Info CMS star rating based on short-stay quality measure performance. 5 stars = much above average, 1 star = much below average.
Pneumococcal Vaccine Info Percent of short-stay residents assessed and appropriately given the pneumococcal vaccine 84.9%
11% better than Rhode Island average

Rhode Island average: 76.2%

Antipsychotic medication increase Info Percent of short-stay residents who newly received an antipsychotic medication 0.7%
63% better than Rhode Island average

Rhode Island average: 2.0%

Influenza Vaccine Info Percent of short-stay residents assessed and appropriately given the seasonal influenza vaccine 89.6%
15% better than Rhode Island average

Rhode Island average: 78.2%

Re-hospitalized after SNF stay Info Percentage of short-stay residents who were re-hospitalized after their nursing home admission. 17.9%
29% better than Rhode Island average

Rhode Island average: 25.1%

Emergency department visits Info Percentage of short-stay residents who had an outpatient emergency department visit. 18.7%
18% worse than Rhode Island average

Rhode Island average: 15.8%

Falls with major injury Info Percentage of SNF residents who experience falls with major injury during their stay. 0.0%
100% better than Rhode Island average

Rhode Island average: 0.8%

Ability to care for self at discharge Info Percentage of residents at or above expected ability to care for themselves at discharge. 52.0%
In line with Rhode Island average

Rhode Island average: 53.7%

Successful return to home or community Info Rate of successful return to home or community from a skilled nursing facility. 49.1%
In line with Rhode Island average

Rhode Island average: 50.6%

Penalties and fines

Federal penalties imposed by CMS for regulatory violations, including civil money penalties (fines) and denials of payment for new Medicare/Medicaid admissions.

Source: CMS Penalties Database (Data as of Jan 2026)

Total fines amount $49K
48% lower than Rhode Island average

Rhode Island average: $94K

Number of fines 1
65% fewer fines than Rhode Island average

Rhode Island average: 2.8

Payment Denials Info Serious action where Medicare and/or Medicaid temporarily stops payments for new residents until issues are fixed. 0
100% fewer payment denials than Rhode Island average

Rhode Island average: 0.4

Fines amount comparison
This facility $49K
Rhode Island average $94K
Penalty History

Penalties are imposed by CMS for violations of federal nursing home regulations.

1 penalty in the past 3 years

Apr 15, 2024 · $49K

Civil Money Penalty Info Fines imposed for noncompliance, which can be assessed per day or per instance of violation. Apr 15, 2024
$49K

Last updated: Jan 2026

Compare Nursing Homes around Cranston The information below is reported by the Rhode Island Department of Health, Center for Health Facilities Regulation.

5 facilities compared · CMS & RI Dept. of Health data · Updated Apr 2026

Filter by care type
The Cedars
NH

Nursing Home Licensed facility providing 24/7 skilled nursing care for residents with complex, ongoing medical needs. Staffed by RNs, LPNs, and CNAs. Inspected and star-rated annually by CMS. Accepts Medicare (short-term rehab) and Medicaid (long-term care).

AL

Assisted Living A licensed, long-term care setting for seniors or individuals with disabilities who need help with daily activities — like bathing, dressing, and medication management — but not 24-hour skilled nursing. Offers housing, meals, and around-the-clock support while aiming to maximize resident independence.

HC

Home Care Professional care delivered in the person's own home — from companionship and errands to skilled nursing and therapy. Allows seniors to age in place. Medicare covers skilled home health when medically necessary.

MC

Memory Care Secured, specialized care for people living with Alzheimer's or dementia. Staff trained in cognitive impairment, with higher staff-to-resident ratios and an environment designed to reduce confusion and wandering risk.

RC

Respite Care Short-term temporary care — days to weeks — to give family caregivers a break. Full care provided during the stay. Often used after hospitalization or to trial a facility before a permanent placement decision.

Cranston- 54.4% -35%5.72 -+43%000.0034A+ 26 Neufeldt, April$10.8M$5.3M49%175380
Cra-Mar Meadows
AL

Assisted Living A licensed, long-term care setting for seniors or individuals with disabilities who need help with daily activities — like bathing, dressing, and medication management — but not 24-hour skilled nursing. Offers housing, meals, and around-the-clock support while aiming to maximize resident independence.

IL

Independent Living Lifestyle-focused communities for older adults offering dining, activities, and transportation with minimal personal care. Best for active, independent seniors who want community without medical support.

MC

Memory Care Secured, specialized care for people living with Alzheimer's or dementia. Staff trained in cognitive impairment, with higher staff-to-resident ratios and an environment designed to reduce confusion and wandering risk.

NH

Nursing Home Licensed facility providing 24/7 skilled nursing care for residents with complex, ongoing medical needs. Staffed by RNs, LPNs, and CNAs. Inspected and star-rated annually by CMS. Accepts Medicare (short-term rehab) and Medicaid (long-term care).

Hope41 82.2% -2%3.61 +80%-10%0338.3035- 10 Grzych, Scott$3.5M$1.9M52.5%415066
Riverview Rehabilitation & Healthcare Center
NH

Nursing Home Licensed facility providing 24/7 skilled nursing care for residents with complex, ongoing medical needs. Staffed by RNs, LPNs, and CNAs. Inspected and star-rated annually by CMS. Accepts Medicare (short-term rehab) and Medicaid (long-term care).

AL

Assisted Living A licensed, long-term care setting for seniors or individuals with disabilities who need help with daily activities — like bathing, dressing, and medication management — but not 24-hour skilled nursing. Offers housing, meals, and around-the-clock support while aiming to maximize resident independence.

Coventry (Arkwright)190 92.1% +10%3.39 -21%-16%1453.81170- 24 Sechio, Gretchen$23.0M$8.8M38.3%415082
Budlong Manor -
NH

Nursing Home Licensed facility providing 24/7 skilled nursing care for residents with complex, ongoing medical needs. Staffed by RNs, LPNs, and CNAs. Inspected and star-rated annually by CMS. Accepts Medicare (short-term rehab) and Medicaid (long-term care).

AL

Assisted Living A licensed, long-term care setting for seniors or individuals with disabilities who need help with daily activities — like bathing, dressing, and medication management — but not 24-hour skilled nursing. Offers housing, meals, and around-the-clock support while aiming to maximize resident independence.

Cranston---------000.00-- 70 -----
Scandinavian Communities Rehabilitation & Skilled Nursing -
NH

Nursing Home Licensed facility providing 24/7 skilled nursing care for residents with complex, ongoing medical needs. Staffed by RNs, LPNs, and CNAs. Inspected and star-rated annually by CMS. Accepts Medicare (short-term rehab) and Medicaid (long-term care).

AL

Assisted Living A licensed, long-term care setting for seniors or individuals with disabilities who need help with daily activities — like bathing, dressing, and medication management — but not 24-hour skilled nursing. Offers housing, meals, and around-the-clock support while aiming to maximize resident independence.

Cranston (Edgewood)---------000.00-- 74 -----

Guides for Better Senior Living

Care Cost Calculator: See Prices in Your Area

Nursing Home Data Explorer

Don’t Wait Too Long: 7 Red Flag Signs Your Parent Needs Assisted Living Now

The True Cost of Assisted Living in 2025 – And How Families Are Paying For It

Understanding Senior Living Costs: Pricing Models, Discounts & Financial Assistance

Explore Open Rooms
1 Contact details
2 What type of senior care service are you looking for?
3 What budget do you have in mind for senior care?
4 How soon do you need to find care?
5 Additional details

Thank you for your interest!

Our team will be in touch shortly to help with next steps.