


Total staff
115
Employees
94
Contractors
21
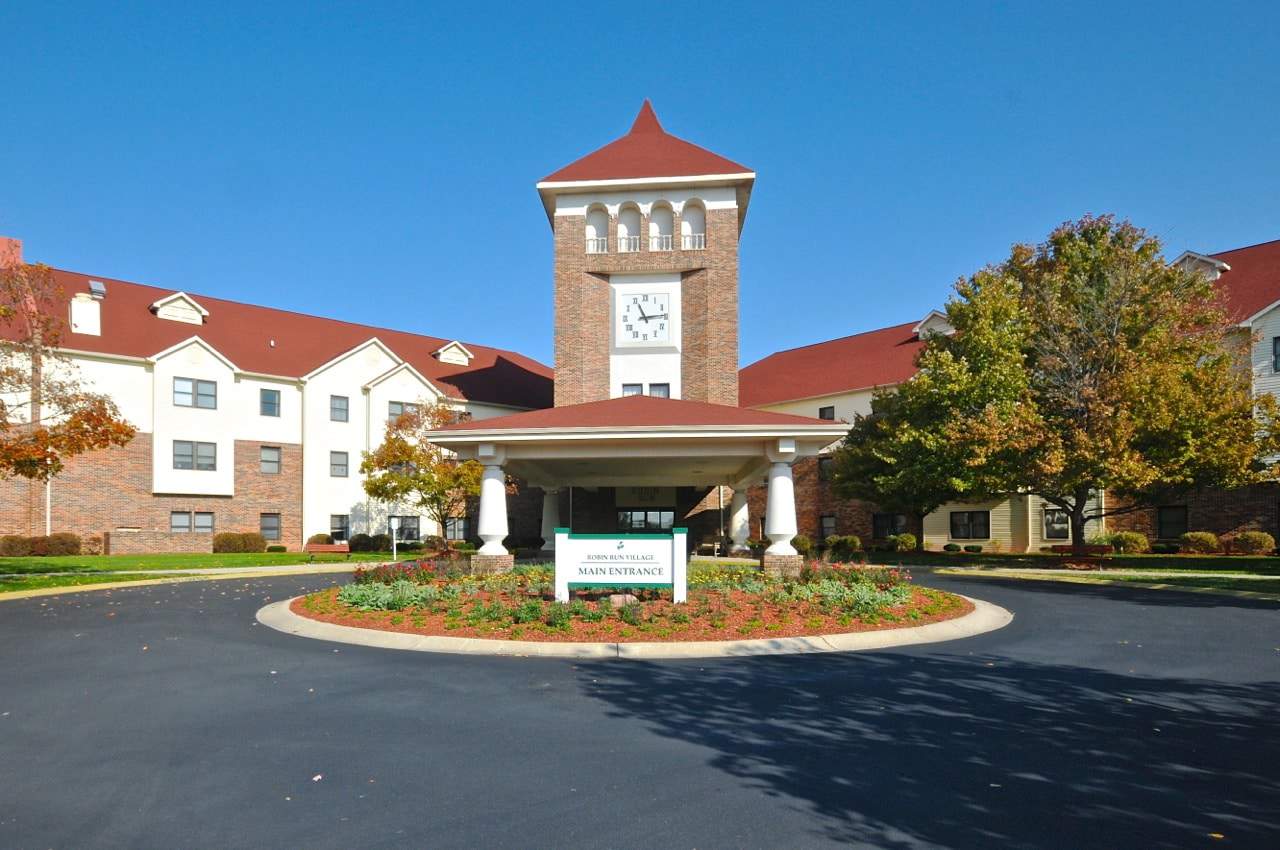
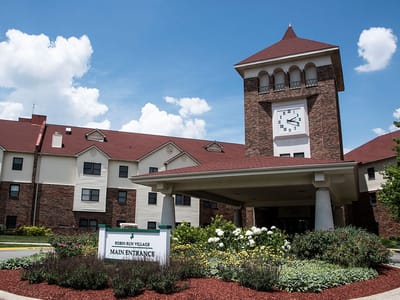
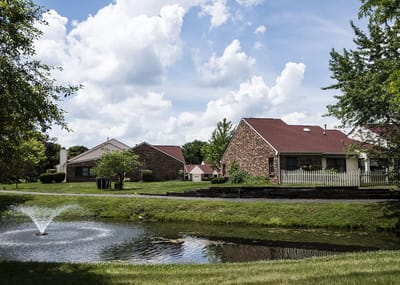
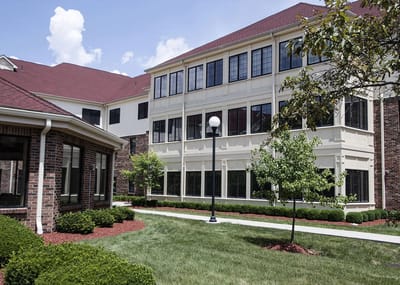
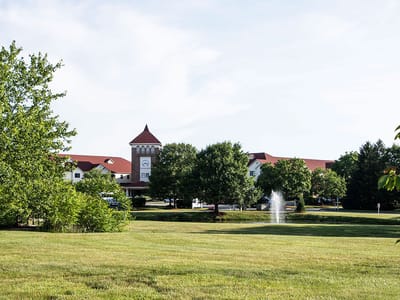
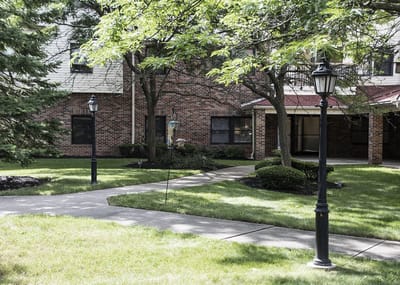
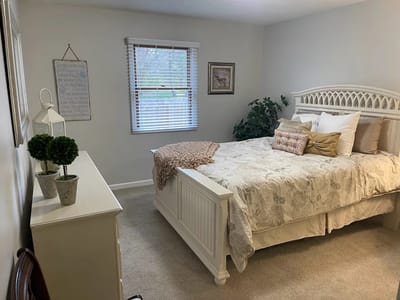
Welcome to Robin Run Village, an esteemed senior living community nestled in the heart of Indianapolis, Indiana, boasting an expansive 86-acre campus adorned with natural beauty and modern amenities. As a continuing care retirement community, Robin Run Village accommodates seniors seeking various levels of care, including independent living, personalized assisted living, and skilled nursing care. Its comprehensive array of services and amenities ensures that each resident enjoys a fulfilling lifestyle.
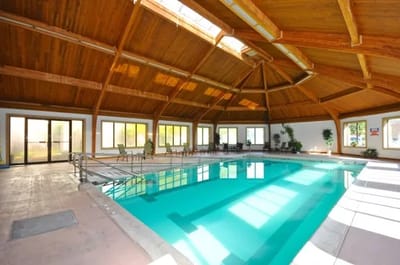
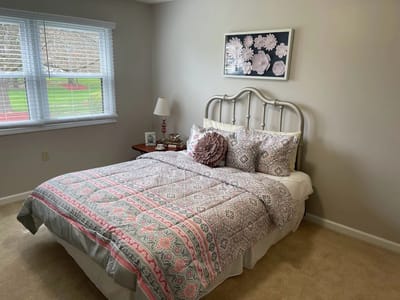
At Robin Run Village, compassion, respect, excellence, and integrity are at the core of their mission. For those seeking a purposeful and independent retirement lifestyle in Indianapolis, Robin Run Village offers peace of mind with the assurance of available assistance whenever needed, allowing residents to embrace life fully. Explore serene wooded trails, relish restaurant-style dining, and engage in activities that ignite passion and purpose. Robin Run Village isn’t just a place to reside; it’s a vibrant community where residents thrive. At Robin Run Village, the true heartbeat of this exceptional community is its residents, who have contributed to its ongoing growth and vibrancy. Offering wellness opportunities, and a diverse range of cultural and social events, the community thrives on catering to the evolving needs of its residents.
Staffing hours
![]() Daily nursing hours per resident by staff type, reported to CMS. Higher is generally better — compare this facility to state and national averages to see where staffing stands.
Daily nursing hours per resident by staff type, reported to CMS. Higher is generally better — compare this facility to state and national averages to see where staffing stands.
Hours per resident per day vs Indiana averages
Total nursing care
![]() This home is ranked 44th out of 277 homes in Indiana for nurse hours. Total adjusted nursing hours per resident per day, combining RN, LPN, and aide time. CMS adjusts this for case-mix so facilities can be fairly compared.
This home is ranked 44th out of 277 homes in Indiana for nurse hours. Total adjusted nursing hours per resident per day, combining RN, LPN, and aide time. CMS adjusts this for case-mix so facilities can be fairly compared.
4h 3m
18% above state avg1 of 6 metrics below state avg
Reporting period: October 1 – December 31, 2025 (Q4 2025). Source: CMS Payroll-Based Journal report.
Manages medical care and health needs.
Assists with medical care and medications.
Helps with daily care and mobility.
Total hours from contractors
2,609 contractor hours this quarter
| Certified Nursing Assistant | 38 | 0 | 38 | 11,840 | 92 | 100% | 8.3 |
| Medication Aide/Technician | 13 | 0 | 13 | 4,030 | 92 | 100% | 8.8 |
| Registered Nurse | 15 | 0 | 15 | 3,278 | 92 | 100% | 8.1 |
| Licensed Practical Nurse | 11 | 0 | 11 | 2,506 | 89 | 97% | 8 |
| Other Dietary Services Staff | 9 | 0 | 9 | 1,686 | 92 | 100% | 6.7 |
| RN Director of Nursing | 2 | 0 | 2 | 1,058 | 68 | 74% | 8.6 |
| Physical Therapy Aide | 0 | 3 | 3 | 892 | 67 | 73% | 5.6 |
| Nurse Practitioner | 2 | 0 | 2 | 752 | 64 | 70% | 8 |
| Mental Health Service Worker | 1 | 0 | 1 | 540 | 65 | 71% | 8.3 |
| Dietitian | 1 | 0 | 1 | 512 | 64 | 70% | 8 |
| Speech Language Pathologist | 0 | 5 | 5 | 510 | 64 | 70% | 5.2 |
| Administrator | 1 | 0 | 1 | 472 | 59 | 64% | 8 |
| Respiratory Therapy Technician | 0 | 5 | 5 | 350 | 69 | 75% | 4.4 |
| Qualified Social Worker | 0 | 1 | 1 | 321 | 62 | 67% | 5.2 |
| Physical Therapy Assistant | 0 | 3 | 3 | 291 | 65 | 71% | 4.4 |
| Clinical Nurse Specialist | 1 | 0 | 1 | 275 | 35 | 38% | 7.9 |
| Feeding Assistant | 0 | 2 | 2 | 113 | 25 | 27% | 4.5 |
| Occupational Therapy Aide | 0 | 1 | 1 | 96 | 13 | 14% | 7.4 |
| Medical Director | 0 | 1 | 1 | 36 | 13 | 14% | 2.8 |
Includes penalties issued in 2024
Federal penalties imposed by CMS for regulatory violations, including civil money penalties (fines) and denials of payment for new Medicare/Medicaid admissions.
Source: CMS Penalties Database (Data as of Jan 2026)
Indiana average: $27K
Indiana average: 1.4
Indiana average: 0.4
Penalties are imposed by CMS for violations of federal nursing home regulations.
1 penalty in the past 3 years
Nov 15, 2024 · 2 days
Last updated: Jan 2026
These measures show how residents usually do over time at this home, based on health outcomes and preventive care.
Indiana average: 8.0
Indiana average: 17.1
Indiana average: 12.0%
Indiana average: 14.4%
Indiana average: 24.6%
Indiana average: 3.9%
Indiana average: 4.4%
Indiana average: 1.2%
Indiana average: 5.7%
Indiana average: 24.1%
Indiana average: 12.4%
Indiana average: 93.7%
Indiana average: 95.4%
Indiana average: 81.7%
Indiana average: 1.4%
Indiana average: 79.0%
Quality measures are calculated from Minimum Data Set (MDS) assessments. For most measures, lower percentages indicate better care quality.
40% of new residents, usually for short-term rehab.
32% of new residents, often for short stays.
28% of new residents, often for long-term daily care.
Source: CMS Long-Term Care Facility Characteristics (Data as of Jan 2026)
Residents meet regularly to discuss policies, care quality, and activities
Part of a Continuing Care Retirement Community offering multiple care levels
Organized group of residents that meets regularly to discuss facility policies, quality of life, and activities.
Data sourced from CMS Long-Term Care Facility Characteristics quarterly report. Payer mix reflects the current resident census by primary payment source.
Historical financial and operational data for Robin Run Village Senior Living from 2011–2022, based on CMS SNF Cost Reports.
Key figures below are for fiscal year ending in 03/2022 — the home's most recent complete cost report, an older period than most facilities report.
Based on the home's most recent complete CMS SNF Cost Report — fiscal year ending in 03/2022. This is an older period than most facilities report, so compare with that in mind.
Pets Allowed
Most residents typically stay for a few weeks or months before returning home or moving on.
New residents most often arrive under Medicare (40% of admissions), and a typical Medicare stay runs around 1 - 2 months.
Coverage residents most often arrive under.
Coverage residents most often leave under.

![]() 8.7 miles from city center
8.7 miles from city center
![]() Estimated distance in miles from Indianapolis's city center to Robin Run Village Senior Living's address, calculated via Google Maps.
— 3.92 miles to nearest hospital (Ascension St. Vincent Hospital - Indianapolis)
Estimated distance in miles from Indianapolis's city center to Robin Run Village Senior Living's address, calculated via Google Maps.
— 3.92 miles to nearest hospital (Ascension St. Vincent Hospital - Indianapolis)
Add your location
Info below is compiled from CMS reports & the IN Dept. of Health (IDOH), senior community websites & trusted data sources such as Walk Score & BBB.
Communities are listed from highest to lowest based on our ranking methodology.
| American Village | NH AL HOS IL MC RC SNF | Indianapolis (Canterbury-Chatard) | 229
Facility
229
IN AVG
116
Rank
#18 / 432 |
53.3%
Facility
53.3%
IN AVG
65.3
Rank
#314 / 422 | -18% | 3.36
Facility
3.36
IN AVG
3.44
Rank
#128 / 277 | +11% | -2% | $0
Facility
$0
IN AVG
$31.4k
Rank
#1 / 279 | 69
Facility
69
IN AVG
83
Rank
#367 / 393 | 55
Facility
55
IN AVG
25.0
Rank
#265 / 279 | 6.1
Facility
6.1
IN AVG
4.1
Rank
#232 / 279 | - | 122 | A+ |
70
Facility
70
IN AVG
40
Rank
#71 / 552 | Gina Couch | $18.7MFiscal year ending 12/2023
Facility
$18.7MFiscal year ending 12/2023
IN AVG
$10.5M
Rank
#15 / 268 | $10.7MFiscal year ending 12/2023
Facility
$10.7MFiscal year ending 12/2023
IN AVG
$5.2M
Rank
#13 / 268 | 57.1%Fiscal year ending 12/2023
Facility
57.1%Fiscal year ending 12/2023
IN AVG
51.1%
Rank
#59 / 268 | 155292 | ||||
| Altenheim Family-first Senior Living | NH AL IL SNF | Indianapolis (Perry Township) | 87
Facility
87
IN AVG
116
Rank
#292 / 432 |
88.7%
Facility
88.7%
IN AVG
65.3
Rank
#40 / 422 | +36% | 3.37
Facility
3.37
IN AVG
3.44
Rank
#128 / 277 | -17% | -2% | $0
Facility
$0
IN AVG
$31.4k
Rank
#1 / 279 | - | 10
Facility
10
IN AVG
25.0
Rank
#40 / 279 | 1.3
Facility
1.3
IN AVG
4.1
Rank
#6 / 279 | - | 77 | A |
24
Facility
24
IN AVG
40
Rank
#366 / 552 | - | $15.1MFiscal year ending 12/2023
Facility
$15.1MFiscal year ending 12/2023
IN AVG
$10.5M
Rank
#44 / 268 | $7.0MFiscal year ending 12/2023
Facility
$7.0MFiscal year ending 12/2023
IN AVG
$5.2M
Rank
#52 / 268 | 46.6%Fiscal year ending 12/2023
Facility
46.6%Fiscal year ending 12/2023
IN AVG
51.1%
Rank
#166 / 268 | 155196 | ||||
| Marquette Senior Living | NH AL IL MC SNF | Indianapolis (Westchester Estates) | 134
Facility
134
IN AVG
116
Rank
#128 / 432 |
92.5%
Facility
92.5%
IN AVG
65.3
Rank
#19 / 422 | +42% | 4.69
Facility
4.69
IN AVG
3.44
Rank
#23 / 277 | +19% | +36% | $0
Facility
$0
IN AVG
$31.4k
Rank
#1 / 279 | 76
Facility
76
IN AVG
83
Rank
#281 / 393 | 26
Facility
26
IN AVG
25.0
Rank
#161 / 279 | 6.5
Facility
6.5
IN AVG
4.1
Rank
#243 / 279 | 3 | 124 | A+ |
22
Facility
22
IN AVG
40
Rank
#384 / 552 | Retirement Living Inc | $33.6MFiscal year ending 12/2023
Facility
$33.6MFiscal year ending 12/2023
IN AVG
$10.5M
Rank
#1 / 268 | $15.2MFiscal year ending 12/2023
Facility
$15.2MFiscal year ending 12/2023
IN AVG
$5.2M
Rank
#2 / 268 | 45.1%Fiscal year ending 12/2023
Facility
45.1%Fiscal year ending 12/2023
IN AVG
51.1%
Rank
#188 / 268 | 155198 | ||||
| Spring Mill Meadows | NH HOS IL RC SNF | Indianapolis (North Willow Farms) | 130
Facility
130
IN AVG
116
Rank
#140 / 432 |
63.8%
Facility
63.8%
IN AVG
65.3
Rank
#243 / 422 | -2% | 3.66
Facility
3.66
IN AVG
3.44
Rank
#72 / 277 | +11% | +6% | $0
Facility
$0
IN AVG
$31.4k
Rank
#1 / 279 | 79
Facility
79
IN AVG
83
Rank
#247 / 393 | 27
Facility
27
IN AVG
25.0
Rank
#171 / 279 | 3.4
Facility
3.4
IN AVG
4.1
Rank
#116 / 279 | 3 | 83 | A+ |
68
Facility
68
IN AVG
40
Rank
#81 / 552 | Cynthia Kump | $10.3MFiscal year ending 12/2023
Facility
$10.3MFiscal year ending 12/2023
IN AVG
$10.5M
Rank
#123 / 268 | $5.4MFiscal year ending 12/2023
Facility
$5.4MFiscal year ending 12/2023
IN AVG
$5.2M
Rank
#101 / 268 | 52.8%Fiscal year ending 12/2023
Facility
52.8%Fiscal year ending 12/2023
IN AVG
51.1%
Rank
#107 / 268 | 155154 | ||||
| Robin Run Village Senior Living | NH AL IL MC SNF | Indianapolis (Snacks / Guion Creek) | 84
Facility
84
IN AVG
116
Rank
#310 / 432 |
73.8%
Facility
73.8%
IN AVG
65.3
Rank
#157 / 422 | +13% | 4.06
Facility
4.06
IN AVG
3.44
Rank
#44 / 277 | +33% | +18% | $0
Facility
$0
IN AVG
$31.4k
Rank
#1 / 279 | - | 43
Facility
43
IN AVG
25.0
Rank
#239 / 279 | 4.8
Facility
4.8
IN AVG
4.1
Rank
#195 / 279 | 1 | 62 | - |
17
Facility
17
IN AVG
40
Rank
#410 / 552 | Indianapolis Senior Care LLC | $7.2M*Fiscal year ending 03/2022These figures are from this home's most recent complete cost report — an older period than most facilities report. Compare with that in mind. | $9.9M*Fiscal year ending 03/2022These figures are from this home's most recent complete cost report — an older period than most facilities report. Compare with that in mind. | 137.7%*Fiscal year ending 03/2022These figures are from this home's most recent complete cost report — an older period than most facilities report. Compare with that in mind. | 155505 |
Robin Run Village Senior Living is located in Indianapolis, Indiana.
Here are the financial assistance programs available to residents in Indiana.
Robin Run Village Senior Living is in the Snacks / Guion Creek neighborhood.
Robin Run Village Senior Living has a walk score of 17. Car-dependent. Most errands require a car, with limited nearby walkable options.
Robin Run Village Senior Living's occupancy is 55.2%.
Yes, Robin Run Village Senior Living allows residents to bring their pets.
Robin Run Village Senior Living is registered as a non-profit.
Yes — there are 9 photos of Robin Run Village Senior Living in the photo gallery on this page.
Robin Run Village Senior Living is located at 5354 W 62Nd St, Indianapolis, IN 46268.
Care Cost Calculator: See Prices in Your Area
Nursing Home Data Explorer
Don’t Wait Too Long: 7 Red Flag Signs Your Parent Needs Assisted Living Now
The True Cost of Assisted Living in 2025 – And How Families Are Paying For It
Understanding Senior Living Costs: Pricing Models, Discounts & Financial Assistance


