Royal Park Retirement Center
Nursing Home, Assisted Living & Independent Living · Spokane, WA
CMS overall rating Info CMS (the Centers for Medicare & Medicaid Services) is the federal agency that rates nursing home quality. Its Overall Rating runs from 1 to 5 stars, combining health inspections, staffing, and quality measures, with inspections weighted most heavily.

Royal Park Retirement Center

Nursing Home, Assisted Living & Independent Living · Spokane, WA
CMS overall rating Info CMS (the Centers for Medicare & Medicaid Services) is the federal agency that rates nursing home quality. Its Overall Rating runs from 1 to 5 stars, combining health inspections, staffing, and quality measures, with inspections weighted most heavily.
Calculator: See prices in your area
Royal Park Retirement Center accepts Medicaid, Medicare, and private pay.

Overview of Royal Park Retirement Center

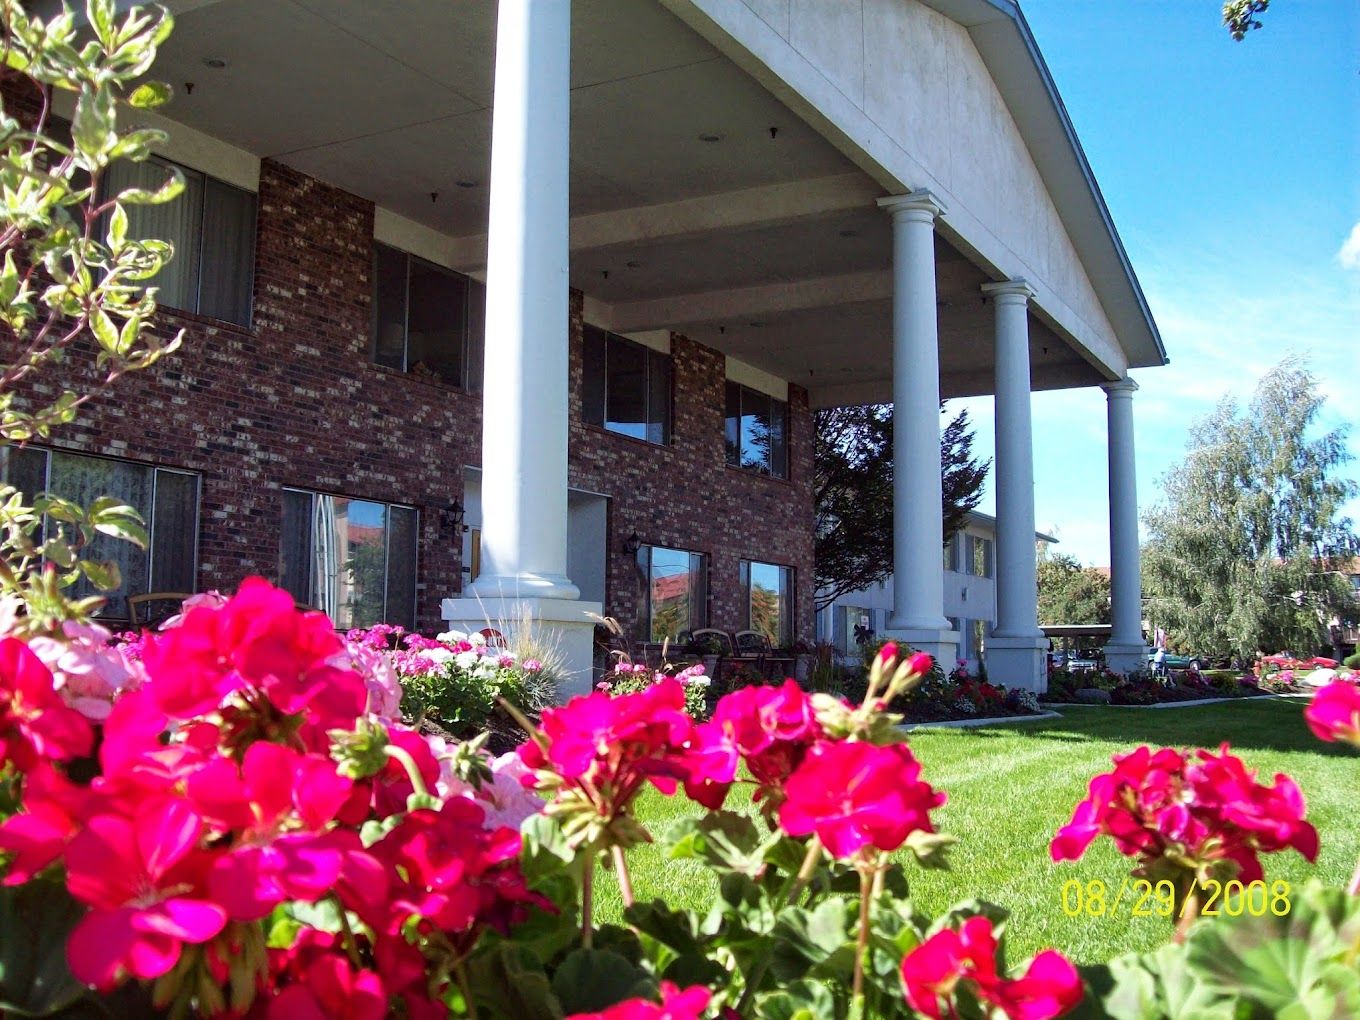
Located in Spokane, Washington, Royal Park Retirement Center is a premier senior living community offering a range of housing options to meet the needs and preferences of residents. With a focus on quality, comfort, and care, Royal Park Retirement Center provides a retirement experience fit for royalty.
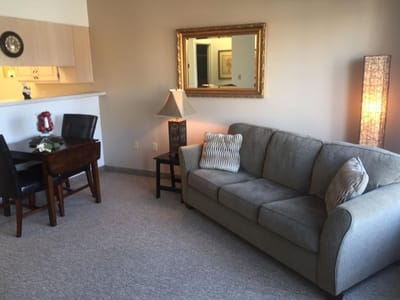
For those seeking extra assistance, Wedgewood Plaza offers pet-friendly assisted living apartments. Here, residents can enjoy the support they need while maintaining their independence in a safe and welcoming environment.

The assisted living options at Wedgewood Plaza include studio, one-bedroom, and two-bedroom apartments, each thoughtfully designed to meet the unique needs of residents. With personalized support services, including assistance with daily living activities, residents can rest assured that their well-being is a top priority. Billing for support services is based on individual usage, ensuring a tailored and cost-effective approach to care.

Quality ratings

Measured by Centers for Medicare & Medicaid Services (CMS)

Overall rating Info The Overall CMS Rating combines results from health inspections, staffing levels and quality measures. Health inspections carry the most weight. Staffing and quality scores can increase or decrease the final rating based on performance compared to state and national standards.
▲ 24.0% Above WA avg. ▲ 24.0% Above WA avg.WA average: 3.2Click the badge to see the full State ranking.Click here to see the full State ranking.
Health Inspection Info Based on the results of the facility's three most recent standard inspections and any complaint investigations. CMS reviews the number, scope, and severity of deficiencies, with more recent findings weighted more heavily.
▲ 42.1% Above WA avg. ▲ 42.1% Above WA avg.WA average: 2.8Click the badge to see the full State ranking.Click here to see the full State ranking.
Staffing Info Measures average nursing staff hours per resident per day, including Registered Nurses (RNs) and total nursing staff. Ratings are adjusted based on the level of care residents require and are compared to state and national benchmarks.
▼ 12.4% Below WA avg. ▼ 12.4% Below WA avg.WA average: 3.4Click the badge to see the full State ranking.Click here to see the full State ranking.
Quality Measures Info Based on clinical and physical health indicators reported to CMS, such as hospital readmissions, falls, pressure ulcers, and improvements in mobility. These measures reflect how well residents' health needs are being managed.
▲ 1.7% Above WA avg. ▲ 1.7% Above WA avg.WA average: 3.9Click the badge to see the full State ranking.Click here to see the full State ranking.

Staffing hours breakdown

Info Daily nursing hours per resident by staff type, reported to CMS. Higher is generally better — compare this facility to state and national averages to see where staffing stands.

Hours per resident per day — compared to Washington state averages

Total nursing care / resident Info This home is ranked 28th out of 90 homes in Washington for nurse hours. Total adjusted nursing hours per resident per day, combining RN, LPN, and aide time. CMS adjusts this for case-mix so facilities can be fairly compared.
4h 17m per day
Rank #28 / 90Nurse hours — State benchmarkedThis home is ranked 28th out of 90 homes in Washington. Shows adjusted nurse hours per resident per day benchmarked to the Washington average, with a ranking across 90 Washington facilities. More hours mean more direct care. The national average is about 3.5 hrs; below 3.0 is a red flag.Rankings are based only on facilities in Washington that report data for that category. Facilities without available data are excluded from the ranking.Click the rank badge to see the full State ranking.Click here to see the full State ranking.
This facility Washington avg (4h 13m per day)
vs Washington avg
+1%

3 of 6 metrics below state avg

Standout metric LPN / LVN is +35% above state avg
Staff type Hours / Day / Resident vs state avg
Registered Nurse (RN) Info RNs hold the highest nursing license and can assess residents, interpret test results, and direct care plans. More RN hours per day often signals stronger clinical oversight and faster response to health changes. 24m per day ▼ 57% State avg: 54m per day · National avg: 41m per day
LPN / LVN Info Licensed Practical Nurses (LPNs) or Licensed Vocational Nurses (LVNs) deliver routine hands-on care — medication administration, wound dressing, and monitoring vital signs. They work under RN supervision and make up a large share of daily bedside care. 1h 4m per day ▲ 35% State avg: 48m per day · National avg: 52m per day
Nurse Aide Info Certified Nurse Aides (CNAs) provide the most direct day-to-day assistance: bathing, dressing, feeding, and mobility. Nurse aide hours are typically the largest staffing category and directly affect residents' quality of life. 2h 53m per day ▲ 8% State avg: 2h 41m per day · National avg: 2h 20m per day
Weekend Total Nursing Info Combined nursing hours (RN + LPN + Nurse Aide) per resident per day on weekends. Staffing often drops on weekends — this figure reveals whether the facility maintains adequate coverage outside of weekday hours. 4h 1m per day ■ Avg State avg: 3h 57m per day · National avg: 3h 27m per day
Physical Therapist Info Hours per resident per day provided by licensed Physical Therapists (PTs) or PT Assistants. PT services help residents recover mobility after injury or illness and are especially important for post-acute (short-stay) rehabilitation. 2m per day ▼ 72% State avg: 6m per day · National avg: 4m per day
Weekend RN Info Registered nurse hours specifically on weekends. Facilities sometimes reduce RN presence on Saturdays and Sundays — a low weekend RN figure compared to weekday hours can indicate reduced clinical oversight when most administrative staff are absent. 10m per day ▼ 74% State avg: 39m per day · National avg: 29m per day

Capacity and availability

Avg. Length of Stay
92 days
Bed community size
100-bed community Rank #93 / 366Bed count — State benchmarkedThis home is ranked 93rd out of 366 homes in Washington. Shows this facility's certified or reported bed count compared to other Washington facilities. Larger communities may offer more amenities, programs, and on-site services for residents and families.Rankings are based only on facilities in Washington that report data for that category. Facilities without available data are excluded from the ranking.Click the rank badge to see the full State ranking.Click here to see the full State ranking.
A larger shared setting that may offer more common spaces and organized community services.
Years in operation
42 years in operation
A longer operating history, which may indicate experience navigating regulations and delivering ongoing care.
Walk Score
Walk Score: 66 / 100 Rank #183 / 628Walk Score — State benchmarkedThis home is ranked 183rd out of 628 homes in Washington. Shows how walkable this facility's neighborhood is compared to the average Walk Score across Washington facilities. Higher scores benefit residents, families, and staff.Rankings are based only on facilities in Washington that report data for that category. Facilities without available data are excluded from the ranking.Click the rank badge to see the full State ranking.Click here to see the full State ranking.
Moderately walkable. Some errands can be accomplished on foot, with a mix of nearby amenities.
BBB Rating
BBB Rating: A+ (Not Accredited)
An independent rating from the Better Business Bureau based on factors such as complaint history, transparency, and business practices.
How BBB ratings work

About this community

License Details

Facility TypeBoarding Home
StatusOperating
ExpirationDecember 31, 2026
CountySpokane
License Number2671

Staffing

Key information about the people who lead and staff this community.

Leadership

ContactStafford, Amy

Contact Royal Park Retirement Center

Inspection History

In Washington, the Department of Social and Health Services, Residential Care Services conducts unannounced inspections and issues reports on the quality of care in all licensed settings.

Since 2024 · 2 years of data 5 deficiencies 1 inspection

Inspection Scorecard Info This scorecard compares key inspection, deficiency, and complaint metrics at this facility against the Washington state average. Metrics rated ≥15% worse than average are highlighted in red; those ≥15% better are highlighted in green.

Since 2024 vs. Washington state average
Overall vs. WA average 1 Worse Metrics worse than Washington average:
• Deficiencies per inspection (47% above)
3 Better Metrics better than Washington average:
• Total deficiencies (84% below)
• Deficiencies per year (84% below)
• Total inspections (89% below)
Latest Inspection February 15, 2024 Inspection Multiple deficiencies

Deficiencies Info Deficiencies are formal regulatory issues recorded during state inspections.

This Facility WA Average vs. WA Avg
Total deficiencies Info Formal regulatory issues recorded by inspectors across all inspection types. 5 31 This facility has 84% fewer total deficiencies than a typical Washington assisted living residence (5 vs. WA avg 31).↓ 84% better
Deficiencies per year Info Average deficiencies per year since 2024. 2.5 15.5 This facility has 84% fewer deficiencies per year than a typical Washington assisted living residence (2.5 vs. WA avg 15.5).↓ 84% better
Deficiencies per inspection Info Average deficiencies per inspection. 5 3.4 This facility has 47% more deficiencies per inspection than a typical Washington assisted living residence (5 vs. WA avg 3.4).↑ 47% worse

Inspections Info State inspections evaluate whether the facility meets health and safety standards.

This Facility WA Average vs. WA Avg
Total inspections Info Combined count of all routine and focused inspections. Excludes complaint investigations. 1 9 This facility has 89% fewer total inspections than a typical Washington assisted living residence (1 vs. WA avg 9).↓ 89% better

Inspection Reports Summary Info An editor-reviewed summary of the themes and findings across this facility's recent inspection reports.

  • February 15, 2024 complaint inspection found five deficiencies including lack of tuberculosis testing, missing staff CPR certification, respirator fit testing, and unsafe emergency exit flooring.
  • Follow-up inspection on April 3, 2024 found no deficiencies, confirming all prior issues were corrected.
  • Deficiencies centered on staff training, infection control, and maintenance, with risks to resident safety and compliance before correction.

Health Inspection History

Inspections since 2023
Total health inspections 7

Washington average 7.8


Last Health inspection on Sep 2025

Total health citations
16 Rank #5 / 92Health citations — State benchmarkedThis home is ranked 5th out of 92 homes in Washington. Shows this facility's total health deficiency citations benchmarked to the Washington State average, with a ranking across all 92 WA facilities. Lower citation counts earn a better rank.Rankings are based only on facilities in Washington that report data for that category. Facilities without available data are excluded from the ranking.Click the rank badge to see the full State ranking.Click here to see the full State ranking.

Washington average 48.9

Citations per inspection
2.29 Rank #1 / 92Citations per inspection — State benchmarkedThis home is ranked 1st out of 92 homes in Washington. Shows average deficiency citations per CMS inspection for this facility versus the Washington mean across 92 facilities with citation data. Lower is better.Rankings are based only on facilities in Washington that report data for that category. Facilities without available data are excluded from the ranking.Click the rank badge to see the full State ranking.Click here to see the full State ranking.

Washington average 6.92


Health citations are formal notices following inspections when they fail to comply with safety and care standards.

10 of 16 citations resulted from standard inspections; 4 of 16 resulted from complaint investigations; and 2 of 16 came from combined inspections (standard and complaint).

Breakdown of citation severity (last 3 years)
Critical health citations
0
100% better than Washington average

Washington average: 0.3


Serious health citations
0
100% better than Washington average

Washington average: 1.7

0 critical citations Washington average: 0.3

0 serious citations Washington average: 1.7

16 moderate citations Washington average: 46.3

0 minor citations Washington average: 0.5
Citations history (last 3 years)
Quality of Care moderate citation Sep 03, 2025
Corrected

Administration moderate citation Aug 07, 2025
Corrected

Abuse/Neglect moderate citation Mar 19, 2025
Corrected

Environmental moderate citation Mar 19, 2025
Corrected

Staffing Data

Reporting period: October 1 – December 31, 2025 (Q4 2025). Source: CMS Payroll-Based Journal report.

Total staff 117
Employees 80
Contractors 37
Staff to resident ratio 1.92 : 1
0% compared with Washington average
Washington average ratio: 1.86 : 1 Washington average ratio: 1.86 : 1See full Washington ranking
Avg staff/day 43
Average shift 7.8 hours
0% compared with Washington average
Washington average: 8.1 hours Washington average shift: 8.1 hoursSee full Washington ranking
Total staff hours (quarter) 30,999

Nursing staff breakdown

Q4 2025 · Oct 1 – Dec 31 More info This data comes from the CMS Payroll-Based Journal report covering October 1 – December 31, 2025.
Registered Nurse

Manages medical care and health needs.

RN Staff Info All 7 RN Staff are full-time employees. No contractors work on this role. 7
Average shift length Info Average shift length. Calculated as total hours divided by days worked and average staff per day. 7.5 hours
Licensed Practical Nurse

Assists with medical care and medications.

LPN Staff Info 16 total: 14 full-time employees and 2 contractors. 16
Average shift length Info Average shift length. Calculated as total hours divided by days worked and average staff per day. 10.2 hours
Certified Nursing Assistant

Helps with daily care and mobility.

CNA Staff Info 61 total: 45 full-time employees and 16 contractors. 61
Average shift length Info Average shift length. Calculated as total hours divided by days worked and average staff per day. 7.9 hours

Contractor staffing

Q4 2025 · Oct 1 – Dec 31 More info This data comes from the CMS Payroll-Based Journal report covering October 1 – December 31, 2025.

Total hours from contractors

15.3%

4,735 contractor hours this quarter

Certified Nursing Assistant: 16 Respiratory Therapy Technician: 6 Physical Therapy Assistant: 5 Speech Language Pathologist: 3 Licensed Practical Nurse: 2 Occupational Therapy Assistant: 2 Physical Therapy Aide: 2 Qualified Social Worker: 1

Staff by category

Q4 2025 · Oct 1 – Dec 31 More info This data comes from the CMS Payroll-Based Journal report covering October 1 – December 31, 2025.
Certified Nursing Assistant 45 16 61 17,588 92 100% 7.9
Licensed Practical Nurse 14 2 16 5,323 92 100% 10.2
Registered Nurse 7 0 7 1,203 90 98% 7.5
RN Director of Nursing 3 0 3 1,195 80 87% 8.8
Other Dietary Services Staff 2 0 2 748 86 93% 7.1
Speech Language Pathologist 0 3 3 711 67 73% 7.1
Clinical Nurse Specialist 2 0 2 710 63 68% 7.8
Dietitian 1 0 1 558 65 71% 8.6
Dental Services Staff 2 0 2 516 54 59% 6.4
Nurse Practitioner 1 0 1 490 59 64% 8.3
Qualified Social Worker 0 1 1 472 59 64% 8
Administrator 1 0 1 438 56 61% 7.8
Mental Health Service Worker 1 0 1 421 60 65% 7
Physical Therapy Assistant 0 5 5 216 52 57% 3.9
Respiratory Therapy Technician 0 6 6 159 56 61% 2.3
Occupational Therapy Aide 1 0 1 151 20 22% 7.5
Physical Therapy Aide 0 2 2 60 16 17% 3.7
Occupational Therapy Assistant 0 2 2 40 46 50% 0.8
61 Certified Nursing Assistant
% of Days 100%
16 Licensed Practical Nurse
% of Days 100%
7 Registered Nurse
% of Days 98%
3 RN Director of Nursing
% of Days 87%
2 Other Dietary Services Staff
% of Days 93%
3 Speech Language Pathologist
% of Days 73%
2 Clinical Nurse Specialist
% of Days 68%
1 Dietitian
% of Days 71%
2 Dental Services Staff
% of Days 59%
1 Nurse Practitioner
% of Days 64%
1 Qualified Social Worker
% of Days 64%
1 Administrator
% of Days 61%
1 Mental Health Service Worker
% of Days 65%
5 Physical Therapy Assistant
% of Days 57%
6 Respiratory Therapy Technician
% of Days 61%
1 Occupational Therapy Aide
% of Days 22%
2 Physical Therapy Aide
% of Days 17%
2 Occupational Therapy Assistant
% of Days 50%

Penalties and fines

Federal penalties imposed by CMS for regulatory violations, including civil money penalties (fines) and denials of payment for new Medicare/Medicaid admissions.

Source: CMS Penalties Database (Data as of Jan 2026)

Total fines amount $8K Rank #1 / 92Federal fines — State benchmarkedThis home is ranked 1st out of 92 homes in Washington. Shows this facility's cumulative CMS federal fine dollars versus the Washington average among facilities with fines, and where it ranks among 92 facilities in the pool. Lower total dollars mean a better rank.Rankings are based only on facilities in Washington that report data for that category. Facilities without available data are excluded from the ranking.Click the rank badge to see the full State ranking.Click here to see the full State ranking.
90% lower than Washington average

Washington average: $82K

Number of fines 1
46% fewer fines than Washington average

Washington average: 1.8

Payment Denials Info Serious action where Medicare and/or Medicaid temporarily stops payments for new residents until issues are fixed. 0
100% fewer payment denials than Washington average

Washington average: 0.3

Fines amount comparison
This facility $8K
Washington average $82K

No penalties in the past 3 years

No civil money penalties or payment denials were reported in the last 3 years.

Quality of care over time

These measures show how residents usually do over time at this home, based on health outcomes and preventive care.

High-risk clinical events score Info A composite score based on pressure ulcers, falls with injury, weight loss, walking ability decline, and activities of daily living decline. 8.9
12% better than Washington average

Washington average: 10.0

Functional decline score Info A composite score based on activities of daily living decline, walking ability decline, and incontinence. 19.2
8% better than Washington average

Washington average: 20.9

Long-stay resident measures
Need for Help with Daily Activities Increased Info Percent of long-stay residents whose need for help with daily activities has increased 13.1%
20% better than Washington average

Washington average: 16.4%

Walking Ability Worsened Info Percent of long-stay residents whose ability to move independently worsened 21.1%
In line with Washington average

Washington average: 21.8%

Low Risk Residents with Bowel/Bladder Incontinence Info Percent of low risk long-stay residents who lose control of their bowels or bladder 23.3%
In line with Washington average

Washington average: 24.3%

Falls with Major Injury Info Percent of long-stay residents experiencing one or more falls with major injury 0.0%
100% better than Washington average

Washington average: 2.6%

High Risk Residents with Pressure Ulcers Info Percent of long-stay high risk residents with pressure ulcers 2.9%
41% better than Washington average

Washington average: 4.9%

Urinary Tract Infection Info Percent of long-stay residents with a urinary tract infection 0.0%
100% better than Washington average

Washington average: 1.7%

Lost Too Much Weight Info Percent of long-stay residents who lose too much weight 7.3%
25% worse than Washington average

Washington average: 5.8%

Depressive Symptoms Info Percent of long-stay residents who have depressive symptoms 5.6%
66% better than Washington average

Washington average: 16.2%

Antipsychotic Use Info Percent of long-stay residents who received an antipsychotic medication 11.8%
18% better than Washington average

Washington average: 14.5%

Pneumococcal Vaccine Info Percent of long-stay residents assessed and appropriately given the pneumococcal vaccine 99.4%
In line with Washington average

Washington average: 96.2%

Influenza Vaccine Info Percent of long-stay residents assessed and appropriately given the seasonal influenza vaccine 100.0%
7% better than Washington average

Washington average: 93.8%

Short-stay resident measures
Pneumococcal Vaccine Info Percent of short-stay residents assessed and appropriately given the pneumococcal vaccine 92.6%
5% better than Washington average

Washington average: 88.1%

Antipsychotic medication increase Info Percent of short-stay residents who newly received an antipsychotic medication 1.9%
33% worse than Washington average

Washington average: 1.4%

Influenza Vaccine Info Percent of short-stay residents assessed and appropriately given the seasonal influenza vaccine 92.8%
13% better than Washington average

Washington average: 82.0%

Breakdown by payment type

Medicare

67% of new residents, usually for short-term rehab.

Typical stay 1 - 2 months

Private pay

21% of new residents, often for short stays.

Typical stay 3 months

Medicaid

12% of new residents, often for long-term daily care.

Typical stay 1 - 2 years

Facility Characteristics

Source: CMS Long-Term Care Facility Characteristics (Data as of Jan 2026)

Total residents 61
Medicare
18
29.5% of residents
Medicaid
36
59% of residents
Private pay or other
7
11.5% of residents
Programs & Services
Residents Group

Residents meet regularly to discuss policies, care quality, and activities

Active Resident Council

Organized group of residents that meets regularly to discuss facility policies, quality of life, and activities.

Finances and operations

Based on CMS SNF Cost Report for fiscal year ending in 12/2023.

For-profit
Corporation
Net patient revenue Info Net patient revenue — what the home actually collects for resident care, after contractual allowances, bad debt and discounts are subtracted from its gross charges (CMS cost report, Worksheet G-3). It covers resident care only; money the home earns from other sources is shown separately as "Other income."
$10.6M
Net patient income Info Net patient income: net patient revenue minus the home's total operating expenses. A positive figure means it earns more from resident care than it spends to deliver it; a negative figure means the opposite. It excludes non-operating "other income."
-$107.1K
For-profit Corporation
Net patient revenue Info Net patient revenue — what the home actually collects for resident care, after contractual allowances, bad debt and discounts are subtracted from its gross charges (CMS cost report, Worksheet G-3). It covers resident care only; money the home earns from other sources is shown separately as "Other income."
$10.6M Rank #39 / 94Revenue — State benchmarkedThis home is ranked 39th out of 94 homes in Washington. Shows this facility's annual revenue compared to the Washington average. Higher revenue generally means more resources for staffing and capital — read alongside Payroll %.Rankings are based only on facilities in Washington that report data for that category. Facilities without available data are excluded from the ranking.Click the rank badge to see the full State ranking.Click here to see the full State ranking.
Net patient income Info Net patient income: net patient revenue minus the home's total operating expenses. A positive figure means it earns more from resident care than it spends to deliver it; a negative figure means the opposite. It excludes non-operating "other income."
-$107.1K
Other income Info Money the home earns outside of resident care — such as investments, grants, rentals and other non-operating sources (CMS cost report, Worksheet G-3). It is tracked separately from net patient revenue: it is not part of that figure, and it is not included in net patient income.
$70.8K
Payroll costs Info Staff salaries plus wage-related costs — benefits such as payroll taxes, health insurance and retirement — from the home's own accounting records (CMS cost report, Worksheet A). Contract or agency labor is counted separately, under other operating costs. Rank #53 / 94Payroll — State benchmarkedThis home is ranked 53rd out of 94 homes in Washington. Shows total annual staff payroll benchmarked to the Washington average. Higher payroll investment relative to peers often signals better staffing and less reliance on cheaper contract labor.Rankings are based only on facilities in Washington that report data for that category. Facilities without available data are excluded from the ranking.Click the rank badge to see the full State ranking.Click here to see the full State ranking.
$4.9M 46.3% of net patient revenue Info Payroll as a share of revenue: staff salaries and wage-related benefits divided by net patient revenue. A higher figure means more of each revenue dollar goes to staff pay. Rank #65 / 94Payroll % — State benchmarkedThis home is ranked 65th out of 94 homes in Washington. Shows payroll as a percentage of revenue versus the Washington average. Well-run Washington facilities typically land around 53–61% — the top third Statewide. Below 25% may signal understaffing or heavy agency use — read with Staffing ratings.Rankings are based only on facilities in Washington that report data for that category. Facilities without available data are excluded from the ranking.Click the rank badge to see the full State ranking.Click here to see the full State ranking.
Other operating costs Info Everything it costs to run the home apart from payroll — food, utilities, supplies, maintenance, contract labor and administration. Calculated as total operating expense minus payroll (staff salaries and wage-related benefits).
$5.8M
Total costs Info The home's total operating expense for the year — all the costs of running it, salaries included (CMS cost report, Worksheet G-3).
$10.7M

What does this home offer?

Housing options icon

Housing Options: Studio / 1 Bed / 2 Bed

Building type icon
Building type icon

Building Type: 2-story

Transportation services icon

Transportation Services

Fitness and recreation icon

Fitness and Recreation

Who this home usually serves

TYPE OF STAY

Mostly short-term rehab stays

Most residents typically stay for a few weeks or months before returning home or moving on.

Most new residents arrive under Medicare (67% of admissions), and a typical Medicare stay runs around 1 - 2 months.

Admissions
226 total

Coverage residents most often arrive under.

Medicare 67%
Private pay 21%
Medicaid 12%
Discharges
263 total

Coverage residents most often leave under.

Medicare 67%
Private pay 21%
Medicaid 13%

Places of interest near Royal Park Retirement Center

Address 5.8 miles from city center Info Estimated distance in miles from Spokane's city center to Royal Park Retirement Center's address, calculated via Google Maps. — 0.71 miles to nearest hospital (Fresenius Medical Care at Providence Holy Family Hospital-Icu)

Calculate Travel Distance to Royal Park Retirement Center

Add your location

Address

Compare Assisted Living around Spokane

The information below is reported by the Washington Department of Social and Health Services, Residential Care Services.

Royal Park Retirement Center
AL
NH
IL
Spokane (Shiloh Hills) -
100
Facility 100
WA AVG 82
Rank #93 / 366
A+
66
Facility 66
WA AVG 51
Rank #183 / 628
Studio / 1 Bed / 2 Bed
Rockwood South Hill
AL
IL
MC
NH
Spokane (Downtown Spokane) -
90
Facility 90
WA AVG 82
Rank #134 / 366
-
96
Facility 96
WA AVG 51
Rank #15 / 628
-
Spokane Veterans Home
AL
NH
Spokane (East Central) -
100
Facility 100
WA AVG 82
Rank #93 / 366
-
77
Facility 77
WA AVG 51
Rank #97 / 628
-

Financial Assistance for
Assisted Living in Washington

Royal Park Retirement Center is located in Spokane, Washington.
Here are the financial assistance programs available to residents in Washington.

Get Financial aid guidance

Community Options Program Entry System (COPES)

WA Medicaid COPES

Age 65+ or disabled
General Washington resident, Medicaid-eligible, nursing home-level care need.
Income Limits (2025) ~$2,829/month 300% FBR, individual
Asset Limits $2,000 (individual), $3,000 (couple).
WA

High demand in urban areas (e.g., Seattle).

Benefits
Personal care (5-7 hours/day) Respite (240 hours/year) Adult day care ($70/day) Home modifications ($1,500 avg.)

Washington Family Caregiver Support Program

WA NFCSP

Age Caregiver of someone 60+ (or with dementia)
General Washington resident.
Income Limits No strict limit; prioritizes low-income.
Asset Limits Not applicable.
WA

High urban demand; rural outreach.

Benefits
In-home respite (4-6 hours/day) Adult day care (~$70/day) Short-term facility care (up to 5 days)

Community First Choice (CFC)

Washington Community First Choice

Age 65+ (or disabled 18+)
General WA resident, Medicaid-eligible, need help with 2+ ADLs/IADLs.
Income Limits (2025) ~$2,829/month; QIT optional.
Asset Limits $2,000 (individual), $3,000 (couple).
WA

Broader than COPES; serves ~20,000; self-directed option.

Benefits
Personal care (4-6 hours/day) Respite (~240 hours/year) Assistive devices Training Transportation

Older Americans Act (OAA) Services

Washington OAA Services

Age 60+
General WA resident; no income/asset limits.
Income Limits (2025) None; donations encouraged.
Asset Limits Not assessed.
WA

13 AAAs; includes Meals on Wheels; rural focus.

Benefits
Meals (~$5-$7/meal) Transportation Homemaker services (~4 hours/week) Respite (~5 days/year) Legal aid

Medicare Savings Program (MSP)

Washington Medicare Savings Program

Age 65+ or disabled
General WA resident, Medicare Part A/B.
Income Limits (2025) ~$2,510/month (QMB), ~$3,380/month (SLMB), ~$3,598/month (QI)—individual.
Asset Limits $9,430 (individual), $14,130 (couple).
WA

Includes Extra Help for Part D; no waitlist.

Benefits
Covers Part B premiums ($174.70/month) Deductibles ($240/year) Copays (~20%)

VA Aid and Attendance (A&A) and Housebound Benefits

Washington VA Aid and Attendance/Housebound

Age 65+ or disabled veteran/spouse
General WA resident, wartime service, ADL help (A&A) or homebound.
Income Limits (2025) Net income < ~$1,984/month (veteran with dependent, A&A); pension offsets income.
Asset Limits ~$155,356 net worth
WA

High veteran use; supports rural/urban needs.

Benefits
Cash (~$1,433-$2,642/month veteran, ~$951-$1,318 spouse) for care costs

Senior Citizens Property Tax Exemption

Washington Senior Property Tax Exemption

Age 61+ or disabled retiree
General WA resident, homeowner, income-based.
Income Limits (2025) ~$45,000-$70,000/year varies by county, e.g., King: $70,000
Asset Limits Not assessed; home value cap varies ~$250,000-$400,000
WA

Saves ~$500-$1,500/year; offered statewide.

Benefits
Tax exemption (~$500-$1,500/year depending on county)

Senior Farmers’ Market Nutrition Program (SFMNP)

Washington SFMNP

Age 60+
General WA resident, low-income.
Income Limits (2025) ~$2,322/month 185% FPL
Asset Limits Not assessed.
WA

Vouchers (~$80/season); serves ~20,000 via AAAs.

Benefits
Vouchers (~$80/season) for produce at farmers’ markets

Frequently Asked Questions about Royal Park Retirement Center

What neighborhood is Royal Park Retirement Center in?

Royal Park Retirement Center is in the Shiloh Hills neighborhood of Spokane.

Is Royal Park Retirement Center in a walkable area?

Royal Park Retirement Center has a walk score of 66. Moderately walkable. Some errands can be accomplished on foot, with a mix of nearby amenities.

What is the license number of Royal Park Retirement Center?

According to WA state health department records, Royal Park Retirement Center's license number is 2671.

When does Royal Park Retirement Center's license expire?

According to WA state health department records, Royal Park Retirement Center's license expires on December 31, 2026.

What is the occupancy rate at Royal Park Retirement Center?

Royal Park Retirement Center's occupancy is 63.5%.

Does Royal Park Retirement Center operate as a for-profit or non-profit?

Royal Park Retirement Center is registered as a for-profit in WA.

How many beds does Royal Park Retirement Center have?

Royal Park Retirement Center has 100 beds.

Guides for Better Senior Living

Care Cost Calculator: See Prices in Your Area

Nursing Home Data Explorer

Don’t Wait Too Long: 7 Red Flag Signs Your Parent Needs Assisted Living Now

The True Cost of Assisted Living in 2025 – And How Families Are Paying For It

Understanding Senior Living Costs: Pricing Models, Discounts & Financial Assistance