Seaside Nursing & Retirement
Nursing Home & Assisted Living · South Portland, ME
CMS overall rating Info CMS (the Centers for Medicare & Medicaid Services) is the federal agency that rates nursing home quality. Its Overall Rating runs from 1 to 5 stars, combining health inspections, staffing, and quality measures, with inspections weighted most heavily.

Seaside Nursing & Retirement

Nursing Home & Assisted Living · South Portland, ME
CMS overall rating Info CMS (the Centers for Medicare & Medicaid Services) is the federal agency that rates nursing home quality. Its Overall Rating runs from 1 to 5 stars, combining health inspections, staffing, and quality measures, with inspections weighted most heavily.
Calculator: See prices in your area
Seaside Nursing & Retirement accepts Medicare, Medicaid, and private pay.

Overview of Seaside Nursing & Retirement

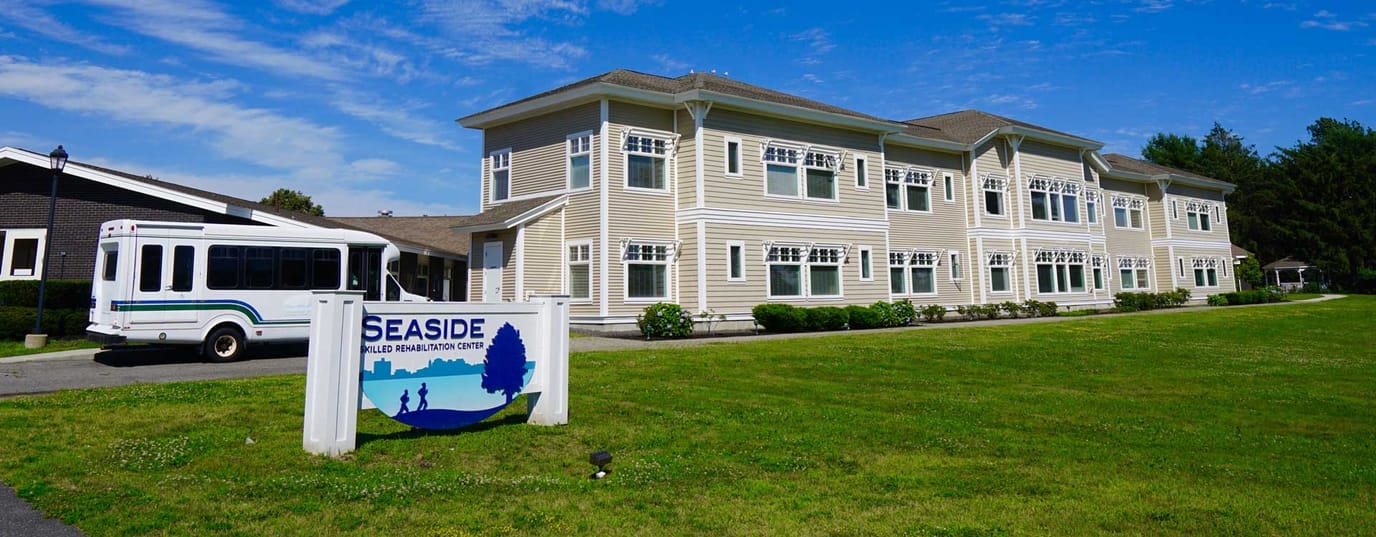
Discover Seaside Nursing & Retirement, a distinguished assisted living community nestled in the heart of Portland, Maine. Within the confines of Seaside Nursing & Retirement, residents are presented with a vibrant array of activities conducted on-site. These engaging activities play a pivotal role in fostering the health and well-being of senior residents, actively promoting physical movement and social interaction.
At Seaside Nursing & Retirement, the dedicated staff remains vigilant and accessible round-the-clock, providing a sense of security and reassurance to residents and their loved ones. With a commitment to unwavering care, emergencies are met with prompt assistance regardless of the hour, ensuring residents’ safety and peace of mind.

Quality ratings

Measured by Centers for Medicare & Medicaid Services (CMS)

Overall rating Info The Overall CMS Rating combines results from health inspections, staffing levels and quality measures. Health inspections carry the most weight. Staffing and quality scores can increase or decrease the final rating based on performance compared to state and national standards.
▲ 31.6% Above ME avg. ▲ 31.6% Above ME avg.ME average: 3.0Click the badge to see the full State ranking.Click here to see the full State ranking.
Health Inspection Info Based on the results of the facility's three most recent standard inspections and any complaint investigations. CMS reviews the number, scope, and severity of deficiencies, with more recent findings weighted more heavily.
▲ 40.6% Above ME avg. ▲ 40.6% Above ME avg.ME average: 2.8Click the badge to see the full State ranking.Click here to see the full State ranking.
Staffing Info Measures average nursing staff hours per resident per day, including Registered Nurses (RNs) and total nursing staff. Ratings are adjusted based on the level of care residents require and are compared to state and national benchmarks.
At ME avg. At ME avg.ME average: 4.0Click the badge to see the full State ranking.Click here to see the full State ranking.
Quality Measures Info Based on clinical and physical health indicators reported to CMS, such as hospital readmissions, falls, pressure ulcers, and improvements in mobility. These measures reflect how well residents' health needs are being managed.
▼ 26.7% Below ME avg. ▼ 26.7% Below ME avg.ME average: 2.7Click the badge to see the full State ranking.Click here to see the full State ranking.

Staffing hours breakdown

Info Daily nursing hours per resident by staff type, reported to CMS. Higher is generally better — compare this facility to state and national averages to see where staffing stands.

Hours per resident per day — compared to Maine state averages

Total nursing care / resident Info This home is ranked 11th out of 34 homes in Maine for nurse hours. Total adjusted nursing hours per resident per day, combining RN, LPN, and aide time. CMS adjusts this for case-mix so facilities can be fairly compared.
4h 34m per day
Rank #11 / 34Nurse hours — State benchmarkedThis home is ranked 11th out of 34 homes in Maine. Shows adjusted nurse hours per resident per day benchmarked to the Maine average, with a ranking across 34 Maine facilities. More hours mean more direct care. The national average is about 3.5 hrs; below 3.0 is a red flag.Rankings are based only on facilities in Maine that report data for that category. Facilities without available data are excluded from the ranking.Click the rank badge to see the full State ranking.Click here to see the full State ranking.
This facility Maine avg (4h 30m per day)
vs Maine avg
+1%

3 of 6 metrics below state avg

Standout metric LPN / LVN is +60% above state avg
Staff typeHours / Day / Residentvs state avg
Registered Nurse (RN) Info RNs hold the highest nursing license and can assess residents, interpret test results, and direct care plans. More RN hours per day often signals stronger clinical oversight and faster response to health changes. 45m per day ▼ 28% State avg: 1h 3m per day · National avg: 41m per day
LPN / LVN Info Licensed Practical Nurses (LPNs) or Licensed Vocational Nurses (LVNs) deliver routine hands-on care — medication administration, wound dressing, and monitoring vital signs. They work under RN supervision and make up a large share of daily bedside care. 43m per day ▲ 60% State avg: 27m per day · National avg: 52m per day
Nurse Aide Info Certified Nurse Aides (CNAs) provide the most direct day-to-day assistance: bathing, dressing, feeding, and mobility. Nurse aide hours are typically the largest staffing category and directly affect residents' quality of life. 2h 47m per day ■ Avg State avg: 2h 51m per day · National avg: 2h 21m per day
Weekend Total Nursing Info Combined nursing hours (RN + LPN + Nurse Aide) per resident per day on weekends. Staffing often drops on weekends — this figure reveals whether the facility maintains adequate coverage outside of weekday hours. 3h 46m per day ▼ 4% State avg: 3h 55m per day · National avg: 3h 26m per day
Physical Therapist Info Hours per resident per day provided by licensed Physical Therapists (PTs) or PT Assistants. PT services help residents recover mobility after injury or illness and are especially important for post-acute (short-stay) rehabilitation. 6m per day ▲ 59% State avg: 4m per day · National avg: 4m per day
Weekend RN Info Registered nurse hours specifically on weekends. Facilities sometimes reduce RN presence on Saturdays and Sundays — a low weekend RN figure compared to weekday hours can indicate reduced clinical oversight when most administrative staff are absent. 22m per day ▼ 50% State avg: 44m per day · National avg: 29m per day

Capacity and availability

This home usually has availability

Lower occupancy than the Maine average: 83.1%
Occupancy rate
75.9% Rank #194 / 251Occupancy rate — State benchmarkedThis home is ranked 194th out of 251 homes in Maine. Shows this facility's occupancy rate versus the Maine average, with its Statewide rank out of 251. Higher occupancy signals strong local demand and financial stability.Rankings are based only on facilities in Maine that report data for that category. Facilities without available data are excluded from the ranking.Click the rank badge to see the full State ranking.Click here to see the full State ranking.
Avg. Length of Stay
130 days
Bed community size
147-bed community Rank #4 / 357Bed count — State benchmarkedThis home is ranked 4th out of 357 homes in Maine. Shows this facility's certified or reported bed count compared to other Maine facilities. Larger communities may offer more amenities, programs, and on-site services for residents and families.Rankings are based only on facilities in Maine that report data for that category. Facilities without available data are excluded from the ranking.Click the rank badge to see the full State ranking.Click here to see the full State ranking.
A larger shared setting that may offer more common spaces and organized community services.
Walk Score
Walk Score: 87 / 100 Rank #14 / 422Walk Score — State benchmarkedThis home is ranked 14th out of 422 homes in Maine. Shows how walkable this facility's neighborhood is compared to the average Walk Score across Maine facilities. Higher scores benefit residents, families, and staff.Rankings are based only on facilities in Maine that report data for that category. Facilities without available data are excluded from the ranking.Click the rank badge to see the full State ranking.Click here to see the full State ranking.
Very walkable. Most errands can be accomplished on foot, and many essentials are within a short walk.

Contact Seaside Nursing & Retirement

Staffing Data

Reporting period: October 1 – December 31, 2025 (Q4 2025). Source: CMS Payroll-Based Journal report.

Total staff 181
Employees 135
Contractors 46
Staff to resident ratio 1.45 : 1
29% fewer staff per resident than Maine average
Maine average ratio: 2.03 : 1 Maine average ratio: 2.03 : 1See full Maine ranking
Avg staff/day 72
Average shift 8.9 hours
10% better than Maine average
Maine average: 8.1 hours Maine average shift: 8.1 hoursSee full Maine ranking
Total staff hours (quarter) 58,976

Nursing staff breakdown

Q4 2025 · Oct 1 – Dec 31 More info This data comes from the CMS Payroll-Based Journal report covering October 1 – December 31, 2025.
Registered Nurse

Manages medical care and health needs.

RN Staff Info 30 total: 23 full-time employees and 7 contractors. 30
Average shift length Info Average shift length. Calculated as total hours divided by days worked and average staff per day. 8.2 hours
Licensed Practical Nurse

Assists with medical care and medications.

LPN Staff Info 23 total: 13 full-time employees and 10 contractors. 23
Average shift length Info Average shift length. Calculated as total hours divided by days worked and average staff per day. 10.2 hours
Certified Nursing Assistant

Helps with daily care and mobility.

CNA Staff Info 78 total: 77 full-time employees and 1 contractor. 78
Average shift length Info Average shift length. Calculated as total hours divided by days worked and average staff per day. 9 hours

Contractor staffing

Q4 2025 · Oct 1 – Dec 31 More info This data comes from the CMS Payroll-Based Journal report covering October 1 – December 31, 2025.

Total hours from contractors

14.2%

8,365 contractor hours this quarter

Licensed Practical Nurse: 10 Physical Therapy Assistant: 10 Registered Nurse: 7 Respiratory Therapy Technician: 6 Speech Language Pathologist: 6 Qualified Social Worker: 2 Occupational Therapy Assistant: 2 Certified Nursing Assistant: 1 Physical Therapy Aide: 1 Occupational Therapy Aide: 1

Staff by category

Q4 2025 · Oct 1 – Dec 31 More info This data comes from the CMS Payroll-Based Journal report covering October 1 – December 31, 2025.
Certified Nursing Assistant7717827,30592100%9
Licensed Practical Nurse1310238,88692100%10.2
Registered Nurse237308,83692100%8.2
Medication Aide/Technician150156,93192100%10
Physical Therapy Assistant010101,4128491%7.2
Respiratory Therapy Technician0661,3037379%7.1
Speech Language Pathologist0668817683%6.9
Mental Health Service Worker2027896368%8
Dental Services Staff1015576672%8.4
Nurse Practitioner1014675964%7.9
Administrator1014665459%8.6
Other Dietary Services Staff1014085257%7.8
Dietitian1013794953%7.7
Qualified Social Worker0221673740%4.5
Occupational Therapy Assistant0221171921%5.9
Occupational Therapy Aide0114189%5.1
Physical Therapy Aide0113467%5.6
78 Certified Nursing Assistant
% of Days 100%
23 Licensed Practical Nurse
% of Days 100%
30 Registered Nurse
% of Days 100%
15 Medication Aide/Technician
% of Days 100%
10 Physical Therapy Assistant
% of Days 91%
6 Respiratory Therapy Technician
% of Days 79%
6 Speech Language Pathologist
% of Days 83%
2 Mental Health Service Worker
% of Days 68%
1 Dental Services Staff
% of Days 72%
1 Nurse Practitioner
% of Days 64%
1 Administrator
% of Days 59%
1 Other Dietary Services Staff
% of Days 57%
1 Dietitian
% of Days 53%
2 Qualified Social Worker
% of Days 40%
2 Occupational Therapy Assistant
% of Days 21%
1 Occupational Therapy Aide
% of Days 9%
1 Physical Therapy Aide
% of Days 7%

Penalties and fines

Federal penalties imposed by CMS for regulatory violations, including civil money penalties (fines) and denials of payment for new Medicare/Medicaid admissions.

Source: CMS Penalties Database (Data as of Jan 2026)

Total fines amount $3K Rank #1 / 34Federal fines — State benchmarkedThis home is ranked 1st out of 34 homes in Maine. Shows this facility's cumulative CMS federal fine dollars versus the Maine average among facilities with fines, and where it ranks among 34 facilities in the pool. Lower total dollars mean a better rank.Rankings are based only on facilities in Maine that report data for that category. Facilities without available data are excluded from the ranking.Click the rank badge to see the full State ranking.Click here to see the full State ranking.
87% lower than Maine average

Maine average: $24K

Number of fines 1
18% fewer fines than Maine average

Maine average: 1.2

Payment Denials Info Serious action where Medicare and/or Medicaid temporarily stops payments for new residents until issues are fixed. 0
100% fewer payment denials than Maine average

Maine average: 0.2

Fines amount comparison
This facility $3K
Maine average $24K

No penalties in the past 3 years

No civil money penalties or payment denials were reported in the last 3 years.

Quality of care over time

These measures show how residents usually do over time at this home, based on health outcomes and preventive care.

High-risk clinical events score Info A composite score based on pressure ulcers, falls with injury, weight loss, walking ability decline, and activities of daily living decline. 16.5
16% worse than Maine average

Maine average: 14.2

Functional decline score Info A composite score based on activities of daily living decline, walking ability decline, and incontinence. 34.7
19% worse than Maine average

Maine average: 29.1

Long-stay resident measures
Significantly below average Info CMS star rating based on long-stay quality measure performance. 5 stars = significantly above average, 1 star = significantly below average.
Need for Help with Daily Activities Increased Info Percent of long-stay residents whose need for help with daily activities has increased 28.8%
11% worse than Maine average

Maine average: 26.0%

Walking Ability Worsened Info Percent of long-stay residents whose ability to move independently worsened 37.3%
19% worse than Maine average

Maine average: 31.4%

Low Risk Residents with Bowel/Bladder Incontinence Info Percent of low risk long-stay residents who lose control of their bowels or bladder 37.9%
27% worse than Maine average

Maine average: 29.8%

Falls with Major Injury Info Percent of long-stay residents experiencing one or more falls with major injury 6.1%
38% worse than Maine average

Maine average: 4.4%

High Risk Residents with Pressure Ulcers Info Percent of long-stay high risk residents with pressure ulcers 6.2%
39% worse than Maine average

Maine average: 4.5%

Urinary Tract Infection Info Percent of long-stay residents with a urinary tract infection 0.3%
90% better than Maine average

Maine average: 2.8%

Lost Too Much Weight Info Percent of long-stay residents who lose too much weight 4.1%
25% better than Maine average

Maine average: 5.5%

Depressive Symptoms Info Percent of long-stay residents who have depressive symptoms 7.5%
28% better than Maine average

Maine average: 10.5%

Antipsychotic Use Info Percent of long-stay residents who received an antipsychotic medication 16.2%
18% better than Maine average

Maine average: 19.8%

Pneumococcal Vaccine Info Percent of long-stay residents assessed and appropriately given the pneumococcal vaccine 96.2%
7% better than Maine average

Maine average: 90.1%

Influenza Vaccine Info Percent of long-stay residents assessed and appropriately given the seasonal influenza vaccine 85.9%
10% worse than Maine average

Maine average: 95.5%

Hospitalizations per 1,000 days Info Number of hospitalizations per 1,000 long-stay resident days. 2.64
90% worse than Maine average

Maine average: 1.39

ED visits per 1,000 days Info Number of outpatient emergency department visits per 1,000 long-stay resident days. 1.43
31% better than Maine average

Maine average: 2.08

Short-stay resident measures
Average Info CMS star rating based on short-stay quality measure performance. 5 stars = much above average, 1 star = much below average.
Pneumococcal Vaccine Info Percent of short-stay residents assessed and appropriately given the pneumococcal vaccine 60.1%
15% worse than Maine average

Maine average: 70.8%

Antipsychotic medication increase Info Percent of short-stay residents who newly received an antipsychotic medication 1.5%
6% worse than Maine average

Maine average: 1.4%

Influenza Vaccine Info Percent of short-stay residents assessed and appropriately given the seasonal influenza vaccine 56.2%
25% worse than Maine average

Maine average: 74.5%

Re-hospitalized after SNF stay Info Percentage of short-stay residents who were re-hospitalized after their nursing home admission. 25.3%
23% worse than Maine average

Maine average: 20.5%

Emergency department visits Info Percentage of short-stay residents who had an outpatient emergency department visit. 12.5%
20% better than Maine average

Maine average: 15.6%

Falls with major injury Info Percentage of SNF residents who experience falls with major injury during their stay. 1.4%
75% worse than Maine average

Maine average: 0.8%

Ability to care for self at discharge Info Percentage of residents at or above expected ability to care for themselves at discharge. 51.3%
In line with Maine average

Maine average: 53.7%

Successful return to home or community Info Rate of successful return to home or community from a skilled nursing facility. 62.9%
24% better than Maine average

Maine average: 50.6%

Breakdown by payment type

Medicare

34% of new residents, usually for short-term rehab.

Typical stay 24 days

Private pay

54% of new residents, often for short stays.

Typical stay 1 - 2 months

Medicaid

12% of new residents, often for long-term daily care.

Typical stay 2 - 3 years

Facility Characteristics

Source: CMS Long-Term Care Facility Characteristics (Data as of Jan 2026)

Total residents 125
Medicare
12
9.6% of residents
Medicaid
70
56% of residents
Private pay or other
43
34.4% of residents
Programs & Services
Residents Group

Residents meet regularly to discuss policies, care quality, and activities

Nurse Aide Training

State-approved Nurse Aide Training and Competency Evaluation Program on-site

Active Resident Council

Organized group of residents that meets regularly to discuss facility policies, quality of life, and activities.

Finances and operations

Based on CMS SNF Cost Report for fiscal year ending in 12/2023.

For-profit
Corporation
Net patient revenue Info Net patient revenue — what the home actually collects for resident care, after contractual allowances, bad debt and discounts are subtracted from its gross charges (CMS cost report, Worksheet G-3). It covers resident care only; money the home earns from other sources is shown separately as "Other income."
$17.2M
Net patient income Info Net patient income: net patient revenue minus the home's total operating expenses. A positive figure means it earns more from resident care than it spends to deliver it; a negative figure means the opposite. It excludes non-operating "other income."
-$1.3M
For-profit Corporation
Net patient revenue Info Net patient revenue — what the home actually collects for resident care, after contractual allowances, bad debt and discounts are subtracted from its gross charges (CMS cost report, Worksheet G-3). It covers resident care only; money the home earns from other sources is shown separately as "Other income."
$17.2M Rank #6 / 40Revenue — State benchmarkedThis home is ranked 6th out of 40 homes in Maine. Shows this facility's annual revenue compared to the Maine average. Higher revenue generally means more resources for staffing and capital — read alongside Payroll %.Rankings are based only on facilities in Maine that report data for that category. Facilities without available data are excluded from the ranking.Click the rank badge to see the full State ranking.Click here to see the full State ranking.
Net patient income Info Net patient income: net patient revenue minus the home's total operating expenses. A positive figure means it earns more from resident care than it spends to deliver it; a negative figure means the opposite. It excludes non-operating "other income."
-$1.3M
Other income Info Money the home earns outside of resident care — such as investments, grants, rentals and other non-operating sources (CMS cost report, Worksheet G-3). It is tracked separately from net patient revenue: it is not part of that figure, and it is not included in net patient income.
$979.3K
Payroll costs Info Staff salaries plus wage-related costs — benefits such as payroll taxes, health insurance and retirement — from the home's own accounting records (CMS cost report, Worksheet A). Contract or agency labor is counted separately, under other operating costs. Rank #3 / 40Payroll — State benchmarkedThis home is ranked 3rd out of 40 homes in Maine. Shows total annual staff payroll benchmarked to the Maine average. Higher payroll investment relative to peers often signals better staffing and less reliance on cheaper contract labor.Rankings are based only on facilities in Maine that report data for that category. Facilities without available data are excluded from the ranking.Click the rank badge to see the full State ranking.Click here to see the full State ranking.
$7.1M 41.4% of net patient revenue Info Payroll as a share of revenue: staff salaries and wage-related benefits divided by net patient revenue. A higher figure means more of each revenue dollar goes to staff pay. Rank #16 / 40Payroll % — State benchmarkedThis home is ranked 16th out of 40 homes in Maine. Shows payroll as a percentage of revenue versus the Maine average. Well-run Maine facilities typically land around 60–66% — the top third Statewide. Below 25% may signal understaffing or heavy agency use — read with Staffing ratings.Rankings are based only on facilities in Maine that report data for that category. Facilities without available data are excluded from the ranking.Click the rank badge to see the full State ranking.Click here to see the full State ranking.
Other operating costs Info Everything it costs to run the home apart from payroll — food, utilities, supplies, maintenance, contract labor and administration. Calculated as total operating expense minus payroll (staff salaries and wage-related benefits).
$11.4M
Total costs Info The home's total operating expense for the year — all the costs of running it, salaries included (CMS cost report, Worksheet G-3).
$18.5M

Who this home usually serves

TYPE OF STAY

Mix of rehab and long-term care

This home supports both short-term rehab and long-term care, with residents staying for a wide range of durations.

Most new residents arrive under private pay (54% of admissions), and a typical private pay stay runs around 1 - 2 months.

Admissions
297 total

Coverage residents most often arrive under.

Medicare 34%
Private pay 54%
Medicaid 12%
Discharges
314 total

Coverage residents most often leave under.

Medicare 28%
Private pay 51%
Medicaid 21%

Compare Nursing Homes around South Portland

The information below is reported by the Maine Department of Health and Human Services, Division of Licensing and Certification.

2 facilities compared · CMS & ME Dept. of Health data

Barron Center
NH
AL
South Portland
219
Facility 219
ME AVG 20
Rank #1 / 357
41.6%
Facility 41.6%
ME AVG 83.1%
Rank #244 / 251
-50%
0.43
Facility 0.43
ME AVG 4.50
Rank #34 / 34
+40%-90%
$8.3k
Facility $8.3k
ME AVG $26.4k
Rank #21 / 34
19
Facility 19
ME AVG 28.5
Rank #6 / 34
4.8
Facility 4.8
ME AVG 5.9
Rank #10 / 34
-108-
56
Facility 56
ME AVG 31
Rank #85 / 422
City Of Portland
$14.3M
Facility $14.3M
ME AVG $16.9M
Rank #8 / 40
$12.0M
Facility $12.0M
ME AVG $4.7M
Rank #2 / 40
84%
Facility 84%
ME AVG 37.8%
Rank #4 / 40
205011
Seaside Nursing & Retirement
NH
AL
South Portland
147
Facility 147
ME AVG 20
Rank #4 / 357
75.9%
Facility 75.9%
ME AVG 83.1%
Rank #194 / 251
-9%
4.56
Facility 4.56
ME AVG 4.50
Rank #11 / 34
+11%+1%
$0
Facility $0
ME AVG $26.4k
Rank #1 / 34
18
Facility 18
ME AVG 28.5
Rank #5 / 34
3.6
Facility 3.6
ME AVG 5.9
Rank #5 / 34
-134-
87
Facility 87
ME AVG 31
Rank #14 / 422
-
$17.2M
Facility $17.2M
ME AVG $16.9M
Rank #6 / 40
$7.1M
Facility $7.1M
ME AVG $4.7M
Rank #3 / 40
41.4%
Facility 41.4%
ME AVG 37.8%
Rank #16 / 40
205074

Financial Assistance for
Nursing Home in Maine

Seaside Nursing & Retirement is located in South Portland, Maine.
Here are the financial assistance programs available to residents in Maine.

Get Financial aid guidance

Home and Community Benefits for the Elderly

MaineCare HCB Program

Age 65+ or 18+ with disability
General Maine resident, Medicaid- eligible, nursing home-level care need.
Income Limits (2025) ~$2,829/month 300% FBR, individual
Asset Limits $2,000 (individual), $3,000 (couple).
ME

Rural access emphasized.

Benefits
Personal care (5-7 hours/day) Respite (240 hours/year) Meals ($6/meal) Adult day services ($60/day)

Maine Statewide Respite Program

ME Respite Program

Age
General Caregiver of someone 60+ with dementia, Maine resident.
Income Limits ~$2,500/month individual, varies
Asset Limits $40,000 individual
ME

Limited to dementia caregivers; capped funding.

Benefits
In-home respite (up to 30 days/year) Adult day care (~$60/day)

MaineCare Long-Term Care (Nursing Facility Services)

MaineCare Nursing Facility Services

Age 65+
General Maine resident, Medicaid-eligible, requires nursing home-level care.
Income Limits (2025) $943/month (individual); must be less than nursing home cost for full coverage.
Asset Limits $2,000 (individual), $3,000 (couple); spousal allowance up to $155,356.
ME

Home equity limit of $636,000; estate recovery applies post-55.

Benefits
24/7 nursing care Meals Therapy Medications (hours unlimited per medical need)

Consumer-Directed Home-Based Care (CDHBC)

Maine Consumer-Directed Personal Assistance Services

Age 65+
General Maine resident, needs ADL assistance, income/asset limits apply.
Income Limits (2025) ~$2,000/month varies by AAA
Asset Limits Not strict; prioritizes low-income.
ME

Available through five Area Agencies on Aging.

Benefits
Personal care (20-30 hours/week) PERS Adult day care Home modifications

Home Accessibility and Repair Program

Maine State Housing Authority Home Accessibility and Repair

Age 62+
General Maine resident, homeowner, low-income.
Income Limits (2025) ~$34,000/year individual, 80% AMI, varies by county
Asset Limits Not specified; focus on income.
ME

Includes Elderly Hardship Grants for urgent repairs.

Benefits
Wheelchair ramps Grab bars Roof repairs (up to $20,000/project)

Program of All-Inclusive Care for the Elderly (PACE)

Maine PACE (not widely available yet)

Age 55+
General Maine resident, Medicare/Medicaid-eligible, nursing home-level care need, community-safe.
Income Limits (2025) No strict limit; Medicaid portion $2,901/month max.
Asset Limits $2,000 (individual) for Medicaid portion.
ME

Pilot phase; check availability with DHHS.

Benefits
Medical care Personal care Day center Transportation Respite (tailored to need)

Veterans Aid and Attendance (A&A) Benefit

Maine VA Aid and Attendance

Age
General Wartime veteran/spouse, age 65+ or disabled, needs ADL help, Maine resident.
Income Limits (2025) Net income minus medical expenses < $1,984/month individual with A&A
Asset Limits $155,356 net worth limit
ME

High veteran population in rural areas.

Benefits
Cash benefit ($1,478-$2,471/month, varies by status) for care costs

Medicare Savings Programs (MSP)

Maine Medicare Savings Programs

Age 65+
General Maine resident, Medicare Part A/B enrollee.
Income Limits (2025) $2,014/month (individual, QMB), $2,706/month (SLMB/QI).
Asset Limits $9,090 (individual), $13,630 (couple).
ME

Includes Qualified Medicare Beneficiary (QMB), Specified Low-Income Medicare Beneficiary (SLMB), and Qualified Individual (QI).

Benefits
Covers Medicare premiums (up to $174.70/month Part B) Co-pays Deductibles

Frequently Asked Questions about Seaside Nursing & Retirement

Is Seaside Nursing & Retirement in a walkable area?

Seaside Nursing & Retirement has a walk score of 87. Very walkable. Most errands can be accomplished on foot, and many essentials are within a short walk.

What is the occupancy rate at Seaside Nursing & Retirement?

Seaside Nursing & Retirement's occupancy is 75.9%.

Does Seaside Nursing & Retirement operate as a for-profit or non-profit?

Seaside Nursing & Retirement is registered as a for-profit.

Are there photos of Seaside Nursing & Retirement?

Yes — there is 1 photo of Seaside Nursing & Retirement in the photo gallery on this page.

What is the phone number of Seaside Nursing & Retirement?

(207) 774-7878 will put you in contact with the team at Seaside Nursing & Retirement.

Is Seaside Nursing & Retirement Medicare or Medicaid certified?

Yes — Seaside Nursing & Retirement is a CMS-certified provider of Medicare and Medicaid.

Guides for Better Senior Living

Care Cost Calculator: See Prices in Your Area

Nursing Home Data Explorer

Don’t Wait Too Long: 7 Red Flag Signs Your Parent Needs Assisted Living Now

The True Cost of Assisted Living in 2025 – And How Families Are Paying For It

Understanding Senior Living Costs: Pricing Models, Discounts & Financial Assistance