Senior Suites Healthcare
CMS overall rating Info CMS (the Centers for Medicare & Medicaid Services) is the federal agency that rates nursing home quality. Its Overall Rating runs from 1 to 5 stars, combining health inspections, staffing, and quality measures, with inspections weighted most heavily.

Senior Suites Healthcare

CMS overall rating Info CMS (the Centers for Medicare & Medicaid Services) is the federal agency that rates nursing home quality. Its Overall Rating runs from 1 to 5 stars, combining health inspections, staffing, and quality measures, with inspections weighted most heavily.
Calculator: See prices in your area
Senior Suites Healthcare accepts Medicare, Medicaid, and private pay.

Overview of Senior Suites Healthcare

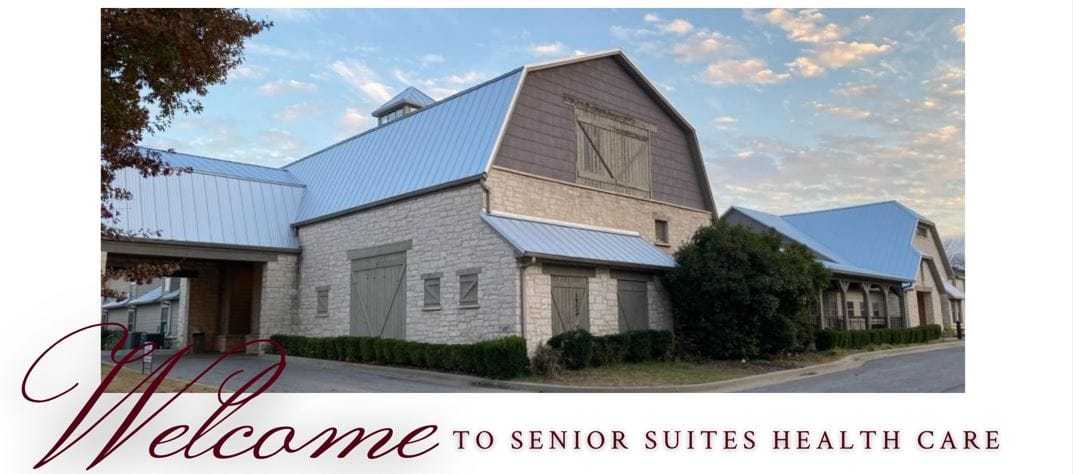
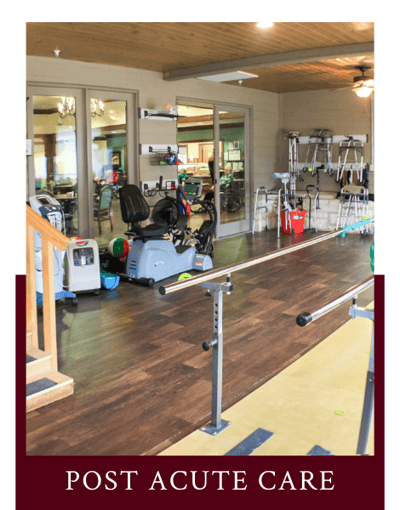
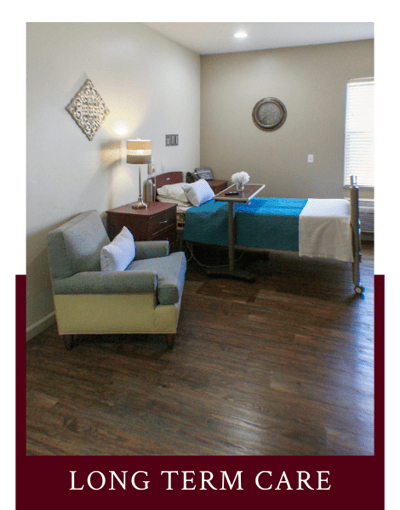
Senior Suites Health Care in Tulsa provides a comprehensive approach to long-term care nursing home services. Specializing in both post-hospital rehab and extended residence options, the facility focuses on creating an atmosphere that promotes wellness, healing, and independence. With amenities like kitchen-prepared meals, flat-screen TVs, and Wi-Fi, alongside a skilled and caring staff, Senior Suites offers a blend of luxury and quality care that caters to both short-term and long-term needs.
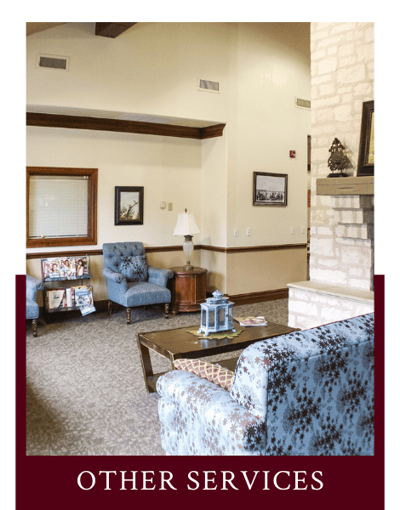
Residents of Senior Suites Health Care are given the opportunity to engage in a lifestyle that balances comfort, security, and independence. The all-suite community features spacious rooms, communal activity areas, and serene outdoor spaces for leisurely walks. Physician oversight, a nurse call system in all rooms, and daily organized activities ensure that residents experience a fulfilling and safe environment, making it a preferred choice for those seeking long-term care nursing home services.

Quality ratings

Measured by Centers for Medicare & Medicaid Services (CMS)

Overall rating Info The Overall CMS Rating combines results from health inspections, staffing levels and quality measures. Health inspections carry the most weight. Staffing and quality scores can increase or decrease the final rating based on performance compared to state and national standards.
▼ 61.9% Below OK avg. ▼ 61.9% Below OK avg.OK average: 2.6Click the badge to see the full State ranking.Click here to see the full State ranking.
Health Inspection Info Based on the results of the facility's three most recent standard inspections and any complaint investigations. CMS reviews the number, scope, and severity of deficiencies, with more recent findings weighted more heavily.
▼ 27.7% Below OK avg. ▼ 27.7% Below OK avg.OK average: 2.8Click the badge to see the full State ranking.Click here to see the full State ranking.
Staffing Info Measures average nursing staff hours per resident per day, including Registered Nurses (RNs) and total nursing staff. Ratings are adjusted based on the level of care residents require and are compared to state and national benchmarks.
▼ 61.5% Below OK avg. ▼ 61.5% Below OK avg.OK average: 2.6Click the badge to see the full State ranking.Click here to see the full State ranking.
Quality Measures Info Based on clinical and physical health indicators reported to CMS, such as hospital readmissions, falls, pressure ulcers, and improvements in mobility. These measures reflect how well residents' health needs are being managed.
▲ 41.4% Above OK avg. ▲ 41.4% Above OK avg.OK average: 2.8Click the badge to see the full State ranking.Click here to see the full State ranking.

Staffing hours breakdown

Info Daily nursing hours per resident by staff type, reported to CMS. Higher is generally better — compare this facility to state and national averages to see where staffing stands.

Hours per resident per day — compared to Oklahoma state averages

Total nursing care / resident Info This home is ranked 16th out of 51 homes in Oklahoma for nurse hours. Total adjusted nursing hours per resident per day, combining RN, LPN, and aide time. CMS adjusts this for case-mix so facilities can be fairly compared.
4h 59m per day
Rank #16 / 51Nurse hours — State benchmarkedThis home is ranked 16th out of 51 homes in Oklahoma. Shows adjusted nurse hours per resident per day benchmarked to the Oklahoma average, with a ranking across 51 Oklahoma facilities. More hours mean more direct care. The national average is about 3.5 hrs; below 3.0 is a red flag.Rankings are based only on facilities in Oklahoma that report data for that category. Facilities without available data are excluded from the ranking.Click the rank badge to see the full State ranking.Click here to see the full State ranking.
This facility Oklahoma avg (4h 34m per day)
vs Oklahoma avg
+9%

3 of 6 metrics below state avg

Standout metric Weekend Total Nursing is +23% above state avg
Staff typeHours / Day / Residentvs state avg
Registered Nurse (RN) Info RNs hold the highest nursing license and can assess residents, interpret test results, and direct care plans. More RN hours per day often signals stronger clinical oversight and faster response to health changes. 16m per day ▼ 20% State avg: 20m per day · National avg: 41m per day
LPN / LVN Info Licensed Practical Nurses (LPNs) or Licensed Vocational Nurses (LVNs) deliver routine hands-on care — medication administration, wound dressing, and monitoring vital signs. They work under RN supervision and make up a large share of daily bedside care. 54m per day ▼ 4% State avg: 56m per day · National avg: 52m per day
Nurse Aide Info Certified Nurse Aides (CNAs) provide the most direct day-to-day assistance: bathing, dressing, feeding, and mobility. Nurse aide hours are typically the largest staffing category and directly affect residents' quality of life. 2h 44m per day ▲ 6% State avg: 2h 34m per day · National avg: 2h 21m per day
Weekend Total Nursing Info Combined nursing hours (RN + LPN + Nurse Aide) per resident per day on weekends. Staffing often drops on weekends — this figure reveals whether the facility maintains adequate coverage outside of weekday hours. 4h 16m per day ▲ 23% State avg: 3h 29m per day · National avg: 3h 26m per day
Physical Therapist Info Hours per resident per day provided by licensed Physical Therapists (PTs) or PT Assistants. PT services help residents recover mobility after injury or illness and are especially important for post-acute (short-stay) rehabilitation. 1m per day ■ Avg State avg: 1m per day · National avg: 4m per day
Weekend RN Info Registered nurse hours specifically on weekends. Facilities sometimes reduce RN presence on Saturdays and Sundays — a low weekend RN figure compared to weekday hours can indicate reduced clinical oversight when most administrative staff are absent. 14m per day ▼ 18% State avg: 17m per day · National avg: 29m per day

Capacity and availability

This home usually has limited availability

Higher occupancy than the Oklahoma average: 60.6%
Occupancy rate
91.2% Rank #13 / 132Occupancy rate — State benchmarkedThis home is ranked 13th out of 132 homes in Oklahoma. Shows this facility's occupancy rate versus the Oklahoma average, with its Statewide rank out of 132. Higher occupancy signals strong local demand and financial stability.Rankings are based only on facilities in Oklahoma that report data for that category. Facilities without available data are excluded from the ranking.Click the rank badge to see the full State ranking.Click here to see the full State ranking.
Avg. Length of Stay
115 days
Bed community size
92-bed community Rank #38 / 141Bed count — State benchmarkedThis home is ranked 38th out of 141 homes in Oklahoma. Shows this facility's certified or reported bed count compared to other Oklahoma facilities. Larger communities may offer more amenities, programs, and on-site services for residents and families.Rankings are based only on facilities in Oklahoma that report data for that category. Facilities without available data are excluded from the ranking.Click the rank badge to see the full State ranking.Click here to see the full State ranking.
A larger shared setting that may offer more common spaces and organized community services.
Walk Score
Walk Score: 18 / 100 Rank #166 / 208Walk Score — State benchmarkedThis home is ranked 166th out of 208 homes in Oklahoma. Shows how walkable this facility's neighborhood is compared to the average Walk Score across Oklahoma facilities. Higher scores benefit residents, families, and staff.Rankings are based only on facilities in Oklahoma that report data for that category. Facilities without available data are excluded from the ranking.Click the rank badge to see the full State ranking.Click here to see the full State ranking.
Car-dependent. Most errands require a car, with limited nearby walkable options.

Contact Senior Suites Healthcare

Staffing Data

Reporting period: October 1 – December 31, 2025 (Q4 2025). Source: CMS Payroll-Based Journal report.

Total staff 113
Employees 105
Contractors 8
Staff to resident ratio 1.36 : 1
16% fewer staff per resident than Oklahoma average
Oklahoma average ratio: 1.61 : 1 Oklahoma average ratio: 1.61 : 1See full Oklahoma ranking
Avg staff/day 41
Average shift 8.9 hours
9% better than Oklahoma average
Oklahoma average: 8.2 hours Oklahoma average shift: 8.2 hoursSee full Oklahoma ranking
Total staff hours (quarter) 33,436

Nursing staff breakdown

Q4 2025 · Oct 1 – Dec 31 More info This data comes from the CMS Payroll-Based Journal report covering October 1 – December 31, 2025.
Registered Nurse

Manages medical care and health needs.

RN Staff Info All 4 RN Staff are full-time employees. No contractors work on this role. 4
Average shift length Info Average shift length. Calculated as total hours divided by days worked and average staff per day. 10.4 hours
Licensed Practical Nurse

Assists with medical care and medications.

LPN Staff Info All 21 LPN Staff are full-time employees. No contractors work on this role. 21
Average shift length Info Average shift length. Calculated as total hours divided by days worked and average staff per day. 9.3 hours
Certified Nursing Assistant

Helps with daily care and mobility.

CNA Staff Info All 31 CNA Staff are full-time employees. No contractors work on this role. 31
Average shift length Info Average shift length. Calculated as total hours divided by days worked and average staff per day. 9.8 hours

Contractor staffing

Q4 2025 · Oct 1 – Dec 31 More info This data comes from the CMS Payroll-Based Journal report covering October 1 – December 31, 2025.

Total hours from contractors

0.8%

260 contractor hours this quarter

Medical Director: 2 Physician Assistant: 2 Other Physician: 1 Occupational Therapy Aide: 1 Feeding Assistant: 1 Occupational Therapy Assistant: 1

Staff by category

Q4 2025 · Oct 1 – Dec 31 More info This data comes from the CMS Payroll-Based Journal report covering October 1 – December 31, 2025.
Certified Nursing Assistant3103112,33292100%9.8
Medication Aide/Technician170174,7488997%8.4
Licensed Practical Nurse210214,31692100%9.3
Physical Therapist8083,97392100%8.6
Nurse Aide in Training8082,11792100%9.2
Registered Nurse4041,57992100%10.4
Speech Language Pathologist3038726773%6.8
Administrator1015286672%8
RN Director of Nursing2025216571%8
Physical Therapy Aide1014946975%7.2
Occupational Therapy Aide2134585358%7.4
Dental Services Staff1014306470%6.7
Therapeutic Recreation Specialist1013496166%5.7
Medical Director1232283740%5.3
Nurse Practitioner1011842325%8
Other Dietary Services Staff1011071314%8.2
Physician Assistant022522628%2
Occupational Therapy Assistant0114567%7.5
Respiratory Therapy Technician101441921%2.3
Other Physician011261314%2
Qualified Social Worker101211516%1.4
Feeding Assistant0111478%2
31 Certified Nursing Assistant
% of Days 100%
17 Medication Aide/Technician
% of Days 97%
21 Licensed Practical Nurse
% of Days 100%
8 Physical Therapist
% of Days 100%
8 Nurse Aide in Training
% of Days 100%
4 Registered Nurse
% of Days 100%
3 Speech Language Pathologist
% of Days 73%
1 Administrator
% of Days 72%
2 RN Director of Nursing
% of Days 71%
1 Physical Therapy Aide
% of Days 75%
3 Occupational Therapy Aide
% of Days 58%
1 Dental Services Staff
% of Days 70%
1 Therapeutic Recreation Specialist
% of Days 66%
3 Medical Director
% of Days 40%
1 Nurse Practitioner
% of Days 25%
1 Other Dietary Services Staff
% of Days 14%
2 Physician Assistant
% of Days 28%
1 Occupational Therapy Assistant
% of Days 7%
1 Respiratory Therapy Technician
% of Days 21%
1 Other Physician
% of Days 14%
1 Qualified Social Worker
% of Days 16%
1 Feeding Assistant
% of Days 8%

Penalties and fines

Federal penalties imposed by CMS for regulatory violations, including civil money penalties (fines) and denials of payment for new Medicare/Medicaid admissions.

Source: CMS Penalties Database

No penalties in the past 3 years

No civil money penalties or payment denials were reported in the last 3 years.

Quality of care over time

These measures show how residents usually do over time at this home, based on health outcomes and preventive care.

High-risk clinical events score Info A composite score based on pressure ulcers, falls with injury, weight loss, walking ability decline, and activities of daily living decline. 8.2
7% better than Oklahoma average

Oklahoma average: 8.9

Functional decline score Info A composite score based on activities of daily living decline, walking ability decline, and incontinence. 14.5
11% better than Oklahoma average

Oklahoma average: 16.3

Long-stay resident measures
Significantly above average Oklahoma avg: 3.7 Info CMS star rating based on long-stay quality measure performance. 5 stars = significantly above average, 1 star = significantly below average.
Need for Help with Daily Activities Increased Info Percent of long-stay residents whose need for help with daily activities has increased 14.8%
In line with Oklahoma average

Oklahoma average: 14.4%

Walking Ability Worsened Info Percent of long-stay residents whose ability to move independently worsened 19.1%
14% worse than Oklahoma average

Oklahoma average: 16.8%

Low Risk Residents with Bowel/Bladder Incontinence Info Percent of low risk long-stay residents who lose control of their bowels or bladder 9.7%
45% better than Oklahoma average

Oklahoma average: 17.8%

Falls with Major Injury Info Percent of long-stay residents experiencing one or more falls with major injury 0.7%
84% better than Oklahoma average

Oklahoma average: 4.4%

High Risk Residents with Pressure Ulcers Info Percent of long-stay high risk residents with pressure ulcers 4.4%
16% better than Oklahoma average

Oklahoma average: 5.2%

Urinary Tract Infection Info Percent of long-stay residents with a urinary tract infection 0.8%
74% better than Oklahoma average

Oklahoma average: 3.0%

Lost Too Much Weight Info Percent of long-stay residents who lose too much weight 2.1%
44% better than Oklahoma average

Oklahoma average: 3.7%

Depressive Symptoms Info Percent of long-stay residents who have depressive symptoms 0.5%
86% better than Oklahoma average

Oklahoma average: 3.3%

Antipsychotic Use Info Percent of long-stay residents who received an antipsychotic medication 8.0%
49% better than Oklahoma average

Oklahoma average: 15.5%

Pneumococcal Vaccine Info Percent of long-stay residents assessed and appropriately given the pneumococcal vaccine 100.0%
10% better than Oklahoma average

Oklahoma average: 90.6%

Influenza Vaccine Info Percent of long-stay residents assessed and appropriately given the seasonal influenza vaccine 98.7%
In line with Oklahoma average

Oklahoma average: 94.6%

Hospitalizations per 1,000 days Info Number of hospitalizations per 1,000 long-stay resident days. 2.39
5% worse than Oklahoma average

Oklahoma average: 2.28

ED visits per 1,000 days Info Number of outpatient emergency department visits per 1,000 long-stay resident days. 1.64
44% better than Oklahoma average

Oklahoma average: 2.91

Short-stay resident measures
Average Oklahoma avg: 2.9 Info CMS star rating based on short-stay quality measure performance. 5 stars = much above average, 1 star = much below average.
Pneumococcal Vaccine Info Percent of short-stay residents assessed and appropriately given the pneumococcal vaccine 98.4%
31% better than Oklahoma average

Oklahoma average: 75.0%

Antipsychotic medication increase Info Percent of short-stay residents who newly received an antipsychotic medication 0.0%
100% better than Oklahoma average

Oklahoma average: 2.0%

Influenza Vaccine Info Percent of short-stay residents assessed and appropriately given the seasonal influenza vaccine 84.4%
14% better than Oklahoma average

Oklahoma average: 74.0%

Re-hospitalized after SNF stay Info Percentage of short-stay residents who were re-hospitalized after their nursing home admission. 29.7%
10% worse than Oklahoma average

Oklahoma average: 27.0%

Emergency department visits Info Percentage of short-stay residents who had an outpatient emergency department visit. 28.9%
69% worse than Oklahoma average

Oklahoma average: 17.1%

Successful return to home or community Info Rate of successful return to home or community from a skilled nursing facility. 53.9%
6% better than Oklahoma average

Oklahoma average: 50.6%

Breakdown by payment type

Medicare

21% of new residents, usually for short-term rehab.

Typical stay 1 - 2 months

Private pay

69% of new residents, often for short stays.

Typical stay 1 - 2 months

Medicaid

9% of new residents, often for long-term daily care.

Typical stay 2 - 3 years

Facility Characteristics

Source: CMS Long-Term Care Facility Characteristics (Data as of Jan 2026)

Total residents 83
Medicare
6
7.2% of residents
Medicaid
52
62.7% of residents
Private pay or other
25
30.1% of residents
Programs & Services
Residents Group

Residents meet regularly to discuss policies, care quality, and activities

Active Resident Council

Organized group of residents that meets regularly to discuss facility policies, quality of life, and activities.

Finances and operations

Based on CMS SNF Cost Report for fiscal year ending in 12/2023.

For-profit
Operated by a single business entity.
Net patient revenue Info Net patient revenue — what the home actually collects for resident care, after contractual allowances, bad debt and discounts are subtracted from its gross charges (CMS cost report, Worksheet G-3). It covers resident care only; money the home earns from other sources is shown separately as "Other income."
$7.8M
Net patient income Info Net patient income: net patient revenue minus the home's total operating expenses. A positive figure means it earns more from resident care than it spends to deliver it; a negative figure means the opposite. It excludes non-operating "other income."
$993.6K
For-profit Operated by a single business entity.
Net patient revenue Info Net patient revenue — what the home actually collects for resident care, after contractual allowances, bad debt and discounts are subtracted from its gross charges (CMS cost report, Worksheet G-3). It covers resident care only; money the home earns from other sources is shown separately as "Other income."
$7.8M Rank #36 / 55Revenue — State benchmarkedThis home is ranked 36th out of 55 homes in Oklahoma. Shows this facility's annual revenue compared to the Oklahoma average. Higher revenue generally means more resources for staffing and capital — read alongside Payroll %.Rankings are based only on facilities in Oklahoma that report data for that category. Facilities without available data are excluded from the ranking.Click the rank badge to see the full State ranking.Click here to see the full State ranking.
Net patient income Info Net patient income: net patient revenue minus the home's total operating expenses. A positive figure means it earns more from resident care than it spends to deliver it; a negative figure means the opposite. It excludes non-operating "other income."
$993.6K
Other income Info Money the home earns outside of resident care — such as investments, grants, rentals and other non-operating sources (CMS cost report, Worksheet G-3). It is tracked separately from net patient revenue: it is not part of that figure, and it is not included in net patient income.
$296.6K
Payroll costs Info Staff salaries plus wage-related costs — benefits such as payroll taxes, health insurance and retirement — from the home's own accounting records (CMS cost report, Worksheet A). Contract or agency labor is counted separately, under other operating costs. Rank #34 / 55Payroll — State benchmarkedThis home is ranked 34th out of 55 homes in Oklahoma. Shows total annual staff payroll benchmarked to the Oklahoma average. Higher payroll investment relative to peers often signals better staffing and less reliance on cheaper contract labor.Rankings are based only on facilities in Oklahoma that report data for that category. Facilities without available data are excluded from the ranking.Click the rank badge to see the full State ranking.Click here to see the full State ranking.
$3.9M 49.3% of net patient revenue Info Payroll as a share of revenue: staff salaries and wage-related benefits divided by net patient revenue. A higher figure means more of each revenue dollar goes to staff pay. Rank #36 / 55Payroll % — State benchmarkedThis home is ranked 36th out of 55 homes in Oklahoma. Shows payroll as a percentage of revenue versus the Oklahoma average. Well-run Oklahoma facilities typically land around 55–61% — the top third Statewide. Below 25% may signal understaffing or heavy agency use — read with Staffing ratings.Rankings are based only on facilities in Oklahoma that report data for that category. Facilities without available data are excluded from the ranking.Click the rank badge to see the full State ranking.Click here to see the full State ranking.
Other operating costs Info Everything it costs to run the home apart from payroll — food, utilities, supplies, maintenance, contract labor and administration. Calculated as total operating expense minus payroll (staff salaries and wage-related benefits).
$3.0M
Total costs Info The home's total operating expense for the year — all the costs of running it, salaries included (CMS cost report, Worksheet G-3).
$6.8M

Who this home usually serves

TYPE OF STAY

Primarily short stays

Residents typically stay for brief periods, with frequent admissions and discharges throughout the year.

Most new residents arrive under private pay (69% of admissions), and a typical private pay stay runs around 1 - 2 months.

Admissions
215 total

Coverage residents most often arrive under.

Medicare 21%
Private pay 69%
Medicaid 9%
Discharges
236 total

Coverage residents most often leave under.

Medicare 19%
Private pay 65%
Medicaid 16%

Senior Suites Healthcare Reviews

Treeza Presgrove
My Mom is at Senior Suites, she’s had great help here-especially Josiah, he’s s super goof nurse-and even goes the extra mile plus. Feels like a big family here!!What do you like most about living here? Answer: the family atmosphere Are there enough caregivers to handle the residents' needs, especially during emergencies? Answer: Yes Are the common areas pleasant and comfortable for socializing or relaxing? Answer: Yes How would you rate the quality and variety of the meals? (1-5) Answer: 4 Are special diets handled well? Answer: Yes Is the dining schedule flexible enough to meet your preferences? Answer: Yes How do you feel about the level of social interaction available with other residents? Answer: It’s really good, like family! How was the units offered in this community? Answer: Don’t know Do you feel safe living in this community? Answer: Yes How well do you think the community handles emergencies or unexpected events? Answer: Very well Are there any hidden fees or unexpected charges? Answer: No Would you recommend this community to others looking for senior living options? Answer: Yes Is there anything you wish you knew before moving in? Answer: No

Places of interest near Senior Suites Healthcare

Address 4.0 miles from city center Info Estimated distance in miles from Broken Arrow's city center to Senior Suites Healthcare's address, calculated via Google Maps. — 1.47 miles to nearest hospital (Saint Francis Hospital South)

Calculate Travel Distance to Senior Suites Healthcare

Add your location

Address

Compare Nursing Homes around Broken Arrow

The information below is reported by the Oklahoma State Department of Health, Protective Health Services.

5 facilities compared · CMS & OK Dept. of Health data

Cedarcrest Care Center
NH
HC
MC
RC
Broken Arrow
89
Facility 89
OK AVG 74
Rank #43 / 141
64.7%
Facility 64.7%
OK AVG 60.6%
Rank #101 / 132
+7%
5.34
Facility 5.34
OK AVG 4.57
Rank #15 / 51
-44%+17%
$0
Facility $0
OK AVG $48.8k
Rank #1 / 53
27
Facility 27
OK AVG 23.5
Rank #37 / 53
3.0
Facility 3.0
OK AVG 5.0
Rank #17 / 53
-61-
30
Facility 30
OK AVG 38
Rank #123 / 208
Shelly Bagwell
$4.6M
Facility $4.6M
OK AVG $6.4M
Rank #48 / 55
$2.8M
Facility $2.8M
OK AVG $2.8M
Rank #42 / 55
60.8%
Facility 60.8%
OK AVG 47.7%
Rank #5 / 55
375233
Franciscan Villa
NH
AL
Broken Arrow (Lynn Lane)
71
Facility 71
OK AVG 74
Rank #62 / 141
100.0%
Facility 100.0%
OK AVG 60.6%
Rank #1 / 132
+65%
4.91
Facility 4.91
OK AVG 4.57
Rank #18 / 51
-54%+7%
$12.7k
Facility $12.7k
OK AVG $48.8k
Rank #35 / 53
8
Facility 8
OK AVG 23.5
Rank #9 / 53
4.0
Facility 4.0
OK AVG 5.0
Rank #29 / 53
193-
9
Facility 9
OK AVG 38
Rank #179 / 208
Jennifer Hart
$9.7M
Facility $9.7M
OK AVG $6.4M
Rank #25 / 55
$5.0M
Facility $5.0M
OK AVG $2.8M
Rank #25 / 55
51.2%
Facility 51.2%
OK AVG 47.7%
Rank #25 / 55
375525
Forest Hills Care and Rehab
NH
RC
Broken Arrow
159
Facility 159
OK AVG 74
Rank #4 / 141
88.1%
Facility 88.1%
OK AVG 60.6%
Rank #20 / 132
+45%
4.21
Facility 4.21
OK AVG 4.57
Rank #33 / 51
-50%-8%
$0
Facility $0
OK AVG $48.8k
Rank #1 / 53
35
Facility 35
OK AVG 23.5
Rank #43 / 53
8.8
Facility 8.8
OK AVG 5.0
Rank #51 / 53
-141A+
47
Facility 47
OK AVG 38
Rank #82 / 208
Oklahoma Acquisitions, LLC
$11.9M
Facility $11.9M
OK AVG $6.4M
Rank #14 / 55
$6.3M
Facility $6.3M
OK AVG $2.8M
Rank #14 / 55
52.9%
Facility 52.9%
OK AVG 47.7%
Rank #21 / 55
375392
Aspen Health and Rehab
NH
RC
Broken Arrow
126
Facility 126
OK AVG 74
Rank #12 / 141
73.8%
Facility 73.8%
OK AVG 60.6%
Rank #74 / 132
+22%
5.40
Facility 5.40
OK AVG 4.57
Rank #12 / 51
-47%+18%
$35.7k
Facility $35.7k
OK AVG $48.8k
Rank #46 / 53
18
Facility 18
OK AVG 23.5
Rank #28 / 53
2.3
Facility 2.3
OK AVG 5.0
Rank #8 / 53
1104A+
55
Facility 55
OK AVG 38
Rank #54 / 208
Debora Inks
$11.4M
Facility $11.4M
OK AVG $6.4M
Rank #10 / 55
$6.3M
Facility $6.3M
OK AVG $2.8M
Rank #13 / 55
55.5%
Facility 55.5%
OK AVG 47.7%
Rank #43 / 55
375351
Senior Suites Healthcare
NH
Broken Arrow
92
Facility 92
OK AVG 74
Rank #38 / 141
91.2%
Facility 91.2%
OK AVG 60.6%
Rank #13 / 132
+51%
4.99
Facility 4.99
OK AVG 4.57
Rank #16 / 51
-42%+9%
$0
Facility $0
OK AVG $48.8k
Rank #1 / 53
24
Facility 24
OK AVG 23.5
Rank #34 / 53
3.4
Facility 3.4
OK AVG 5.0
Rank #24 / 53
-76-
18
Facility 18
OK AVG 38
Rank #166 / 208
Cox Building Company, Inc
$7.8M
Facility $7.8M
OK AVG $6.4M
Rank #36 / 55
$3.9M
Facility $3.9M
OK AVG $2.8M
Rank #34 / 55
49.3%
Facility 49.3%
OK AVG 47.7%
Rank #36 / 55
375528

Financial Assistance for
Nursing Home in Oklahoma

Senior Suites Healthcare is located in Broken Arrow, Oklahoma.
Here are the financial assistance programs available to residents in Oklahoma.

Get Financial aid guidance

ADvantage Waiver

Oklahoma Medicaid ADvantage

Age 65+ or disabled
General Oklahoma resident, Medicaid- eligible, nursing home-level care need.
Income Limits (2025) ~$2,829/month 300% FBR, individual
Asset Limits $2,000 (individual), $3,000 (couple).
OK

High rural demand; waitlists possible.

Benefits
Personal care (5-7 hours/day) Respite (240 hours/year) Adult day care ($60/day) Home modifications ($1,500 avg.)

Oklahoma Respite Voucher Program

OK Respite Vouchers

Age Caregiver of someone 60+
General Oklahoma resident.
Income Limits ~$2,500/month individual, varies
Asset Limits $40,000 individual
OK

Limited vouchers; rural focus.

Benefits
In-home respite (up to 30 days/year) Adult day care (~$60/day) Facility respite (up to 5 days)

Personal Care Program

Oklahoma Personal Care Program

Age 65+ (or disabled)
General OK resident, Medicaid-eligible, need help with 1+ ADL.
Income Limits (2025) ~$1,255/month (100% FPL, individual); QIT optional.
Asset Limits $2,000 (individual), $3,000 (couple).
OK

No NFLOC required (less stringent than ADvantage); statewide via SoonerCare.

Benefits
Personal care (5-20 hours/week) Bathing Grooming Light housekeeping Meal prep

Older Americans Act (OAA) Services

Oklahoma OAA Services

Age 60+
General OK resident (or spouse of any age); no income/asset limits.
Income Limits (2025) None; donations encouraged for some services.
Asset Limits Not assessed.
OK

11 AAAs; services vary by region (e.g., urban vs. rural).

Benefits
Meals (home-delivered or congregate, ~$5-$7/meal value) Transportation Homemaker services (~4 hours/week) Respite (~5 days/year) Legal aid

Medicare Savings Program (MSP)

Oklahoma Medicare Savings Program

Age 65+ or disabled
General OK resident, Medicare Part A/B.
Income Limits (2025) ~$2,510/month (QMB), ~$3,380/month (SLMB), ~$3,598/month (QI)—individual.
Asset Limits $9,430 (individual), $14,130 (couple).
OK

Three tiers; includes Extra Help for Part D; no waitlist.

Benefits
Covers Part B premiums ($174.70/month) Deductibles ($240/year) Copays (~20%)

VA Aid and Attendance (A&A) and Housebound Benefits

Oklahoma VA Aid and Attendance/Housebound

Age 65+ or disabled veteran/spouse
General OK resident, wartime service, need for ADL help (A&A) or homebound.
Income Limits (2025) Net income < ~$1,984/month (veteran with dependent, A&A); pension offsets income.
Asset Limits ~$155,356 net worth limit
OK

High veteran population; supports rural/urban care needs.

Benefits
Cash (~$1,433-$2,642/month veteran, ~$951-$1,318 spouse) for care costs (e.g., in-home, assisted living)

Senior Farmers’ Market Nutrition Program (SFMNP)

Oklahoma SFMNP

Age 60+
General OK resident, low-income.
Income Limits (2025) ~$2,322/month individual, 185% FPL
Asset Limits Not assessed.
OK

Vouchers (~$50/season) via 11 AAAs; farmers’ market focus.

Benefits
Vouchers (~$50/season) for fresh produce at approved markets

Property Tax Exemption for Seniors

Oklahoma Senior Property Tax Exemption

Age 65+
General OK resident, homeowner, low-income.
Income Limits (2025) ~$25,000/year individual, adjusted annually
Asset Limits Not assessed; home value < $1M.
OK

Exemption up to $1,000 of assessed value; homestead required.

Benefits
Tax reduction (~$100-$200/year avg., varies by county)

Frequently Asked Questions about Senior Suites Healthcare

Is Senior Suites Healthcare in a walkable area?

Senior Suites Healthcare has a walk score of 18. Car-dependent. Most errands require a car, with limited nearby walkable options.

What is the occupancy rate at Senior Suites Healthcare?

Senior Suites Healthcare's occupancy is 91.2%.

Does Senior Suites Healthcare operate as a for-profit or non-profit?

Senior Suites Healthcare is registered as a for-profit.

Are there photos of Senior Suites Healthcare?

Yes — there are 4 photos of Senior Suites Healthcare in the photo gallery on this page.

What is the address of Senior Suites Healthcare?

Senior Suites Healthcare is located at 3501 West Washington St S, Broken Arrow, OK 74012.

What is the phone number of Senior Suites Healthcare?

(918) 250-5405 will put you in contact with the team at Senior Suites Healthcare.

Is Senior Suites Healthcare Medicare or Medicaid certified?

Yes — Senior Suites Healthcare is a CMS-certified provider of Medicare and Medicaid.

Guides for Better Senior Living

Care Cost Calculator: See Prices in Your Area

Nursing Home Data Explorer

Don’t Wait Too Long: 7 Red Flag Signs Your Parent Needs Assisted Living Now

The True Cost of Assisted Living in 2025 – And How Families Are Paying For It

Understanding Senior Living Costs: Pricing Models, Discounts & Financial Assistance