

Total health inspections
9
Ohio average 6.7
Last Health inspection on Sep 2025

We arrange tours, appointments, and even moving support so you don’t have to
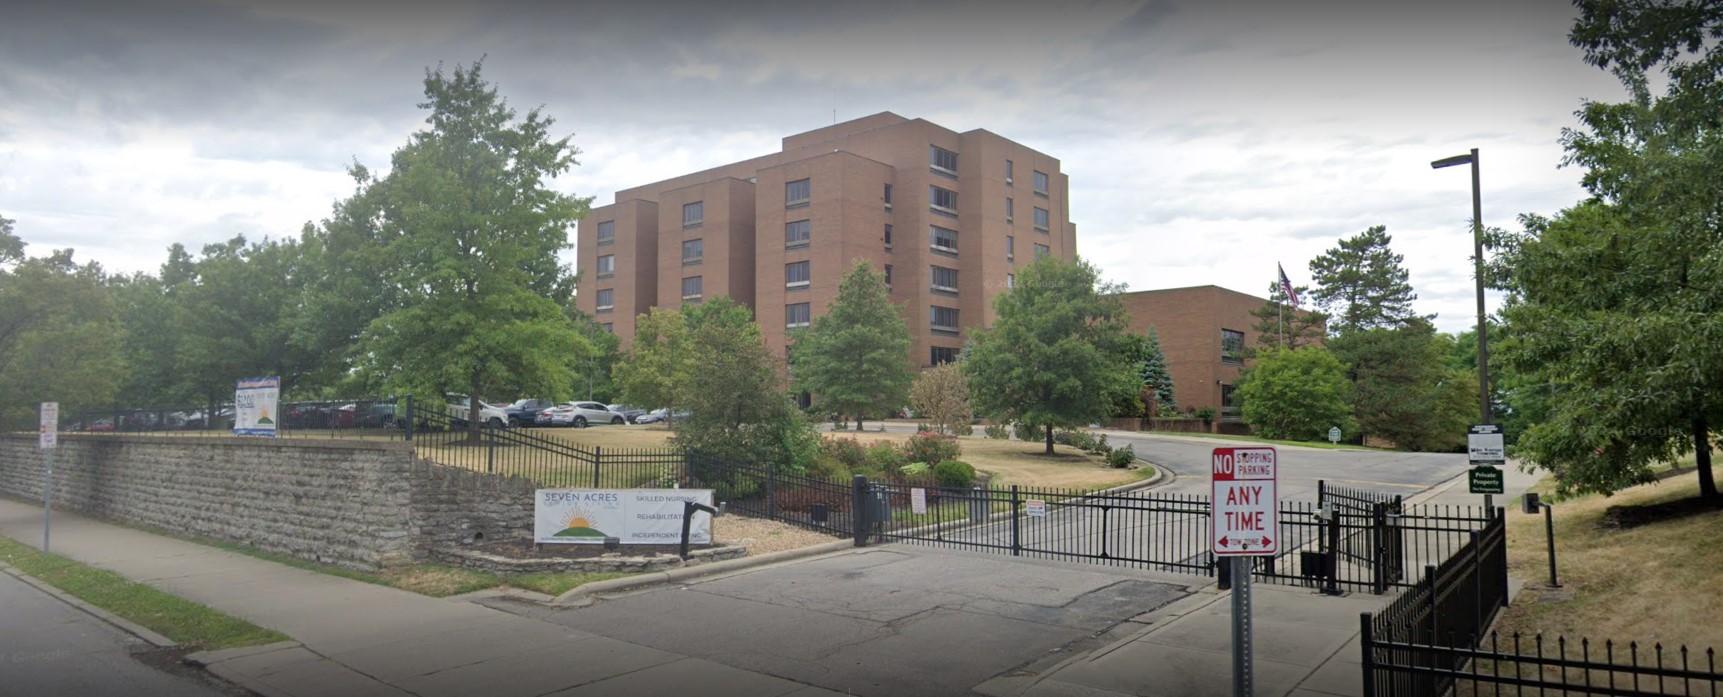
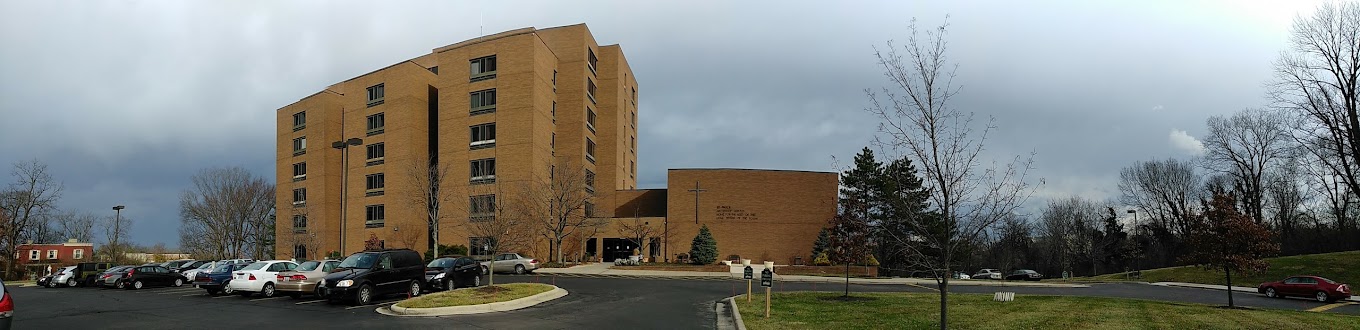

Settled in the tranquil residential grounds of Riddle Road, Cincinnati, OH, Seven Acres Senior Living at Clifton is a venerable senior living community offering independent living, rehabilitation, and skilled nursing. Featuring 58 purposely designed accommodations for skilled care residents and 35 cozy apartments for independent living, the community ensures seniors have a wide selection to choose the right residence for their preferences. A team of responsible and specially trained professionals provides top-notch care and assistance around the clock for seniors to flourish and reach their potential.
Gain meaningful experiences and do the things you live with the utmost guidance from the community. Occupational, physical, and speech therapy, alongside wound care and social services, are provided to enhance seniors’ quality of life. Seven Acres Senior Living at Clifton is a good place to find all the care you require with its extensive amenities and comprehensive services.
 Official CMS rating based on health inspections, staffing and quality measures.
Official CMS rating based on deficiencies found during state health inspections.
Official CMS rating based on nurse staffing hours per resident per day.
Official CMS rating based on clinical outcomes for residents.
Average daily nursing hours per resident (adjusted for acuity). Higher values indicate more nursing time per resident.
Hours of care per resident per day, broken down by staff type. Data from CMS Medicare.
Registered nurse hours per resident per day.
Official CMS rating based on health inspections, staffing and quality measures.
Official CMS rating based on deficiencies found during state health inspections.
Official CMS rating based on nurse staffing hours per resident per day.
Official CMS rating based on clinical outcomes for residents.
Average daily nursing hours per resident (adjusted for acuity). Higher values indicate more nursing time per resident.
Hours of care per resident per day, broken down by staff type. Data from CMS Medicare.
Registered nurse hours per resident per day.
May offer a more intimate, personalized care environment.
Lower occupancy suggests more openings may be available.
Most residents stay for extended periods and receive ongoing daily care.
14% of new residents, usually for short-term rehab.
55% of new residents, often for short stays.
30% of new residents, often for long-term daily care.
The portion of the home's budget spent on staff, including nurses, caregivers, and other employees who support care and operations.
All remaining costs needed to run the home, such as food, utilities, building maintenance, supplies and administrative expenses.
Total Residents: 91
Building Type: Mid-rise
Ohio average 6.7
Last Health inspection on Sep 2025
Health citations are formal notices following inspections when they fail to comply with safety and care standards.
15 of 26 citations resulted from standard inspections; and 11 of 26 resulted from complaint investigations.
Ohio average: 0.3
Ohio average: 0.9
Data sourced from CMS Health Deficiencies reports. Citation severity codes range from A (least serious) to L (most serious). Immediate Jeopardy (J-L) citations indicate situations where the facility's noncompliance has placed residents at risk of death or serious harm.
Assisted Living For seniors needing help with daily tasks but not full-time nursing.
Independent Living For self-sufficient seniors seeking community and minimal assistance.
Memory Care Specialized care for those with Memory Loss, Alzheimer's, or dementia, ensuring safety and support.
Nursing Homes 24/7 care needed
Nursing Home 24/7 care needed
Assisted Living For seniors needing help with daily tasks but not full-time nursing.
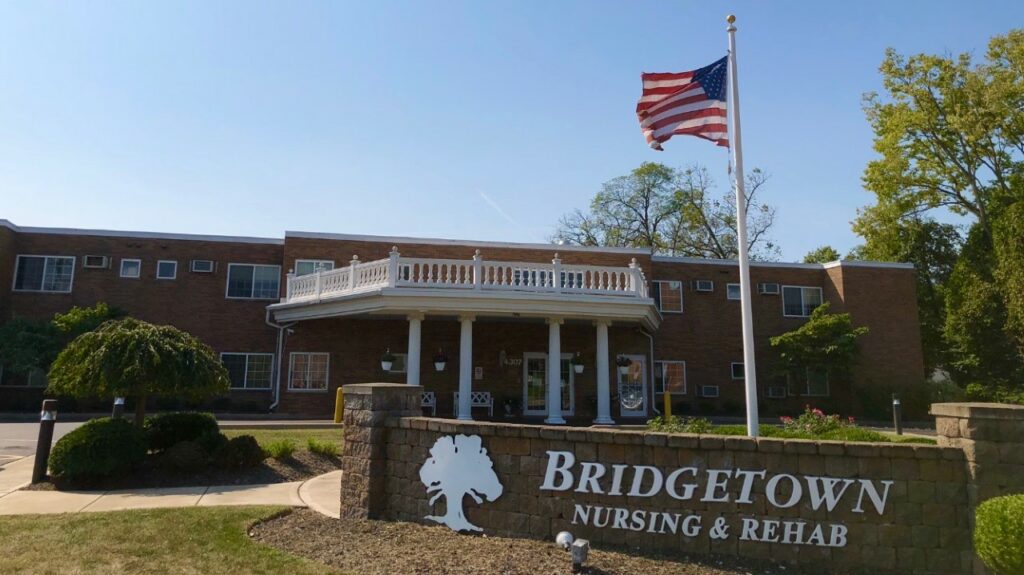 Bridgetown Nursing and Rehabilitation
 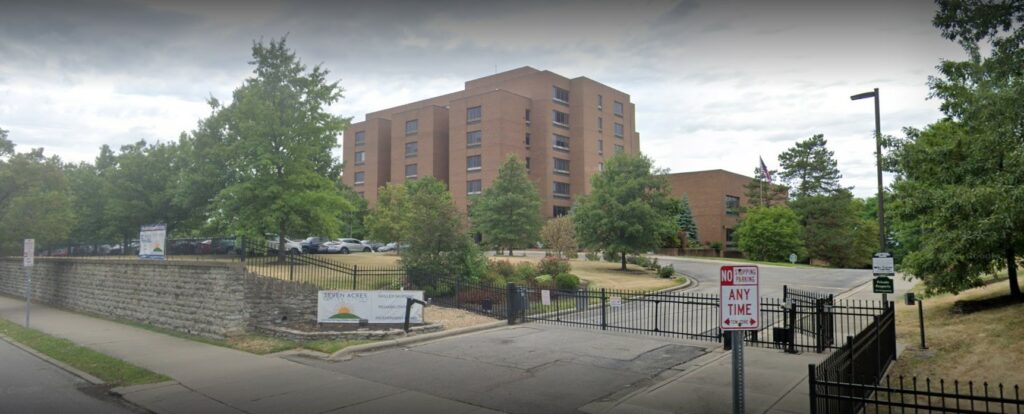 Seven Acres Senior Living at Clifton
 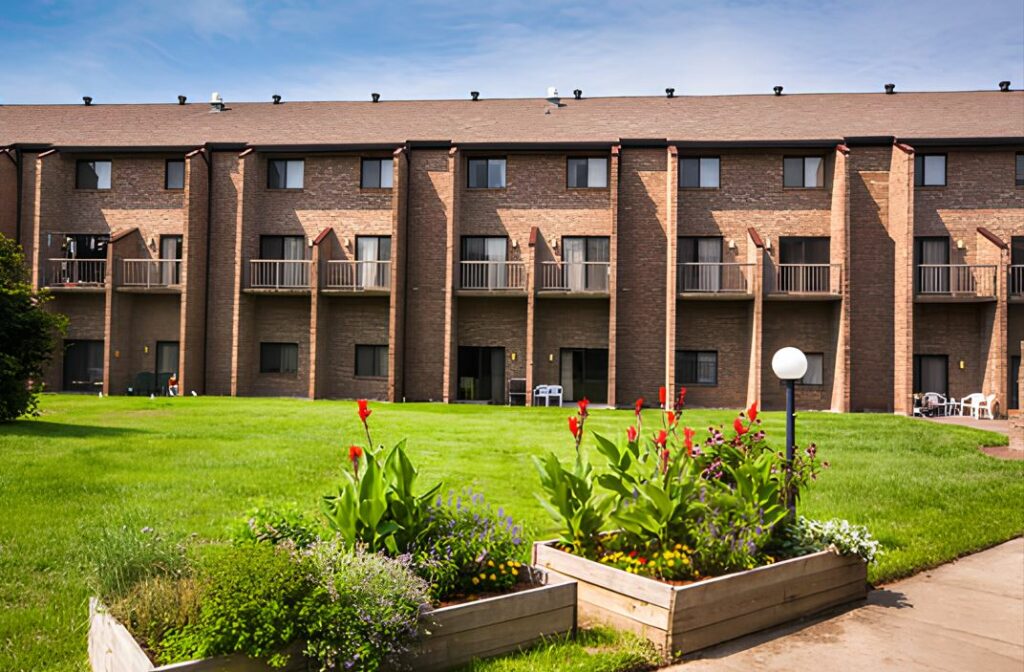 Brookwood Retirement Community
 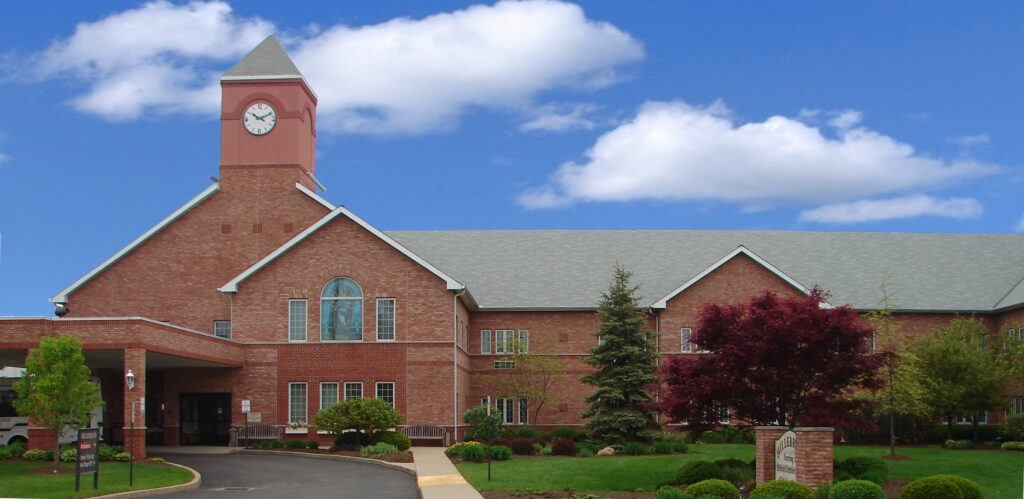 Hillebrand Nursing and Rehabilitation Center
 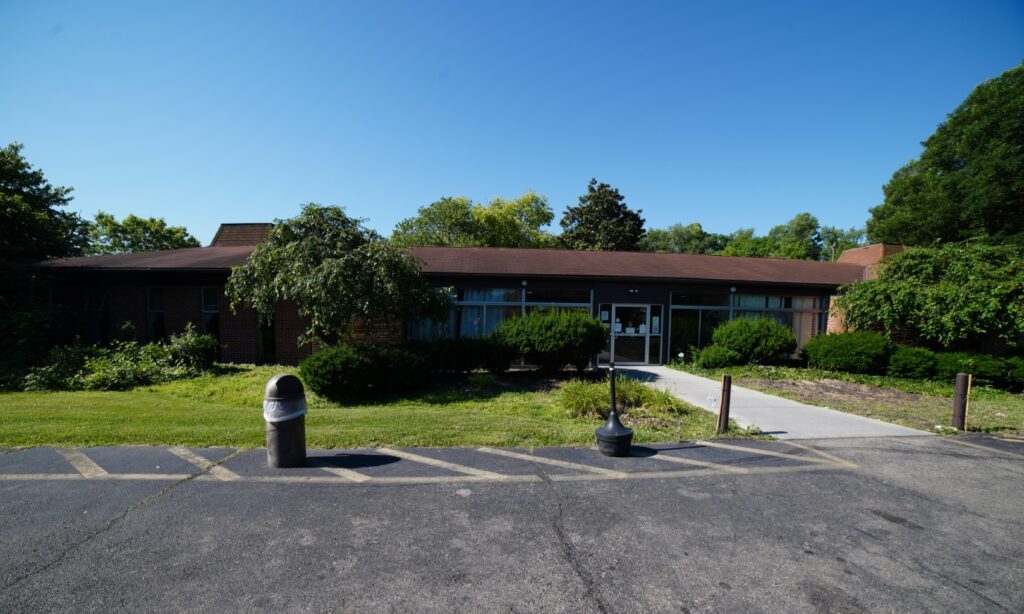 Harmony Court Rehab and Nursing
![]() 4.5 miles from city center — 0.29 miles to nearest hospital (Good Samaritan Hospital)
4.5 miles from city center — 0.29 miles to nearest hospital (Good Samaritan Hospital)
![]() 476 Riddle Rd, Cincinnati, OH 45220
476 Riddle Rd, Cincinnati, OH 45220
Add your location
Source: CMS Payroll-Based Journal (Q2 2025)
| Role ⓘ | Count ⓘ | Avg Shift (hrs) ⓘ | Uses Contractors? ⓘ |
|---|---|---|---|
| Registered Nurse | 11 | 8.7 | Yes |
| Licensed Practical Nurse | 14 | 8.6 | Yes |
| Certified Nursing Assistant | 77 | 8.2 | Yes |
| Role ⓘ | Employees ⓘ | Contractors ⓘ | Total Staff ⓘ | Total Hours ⓘ | Days Worked ⓘ | % of Days ⓘ | Avg Shift (hrs) ⓘ |
|---|---|---|---|---|---|---|---|
| Certified Nursing Assistant | 48 | 29 | 77 | 11,723 | 91 | 100% | 8.2 |
| Licensed Practical Nurse | 13 | 1 | 14 | 3,751 | 91 | 100% | 8.6 |
| Registered Nurse | 7 | 4 | 11 | 1,334 | 91 | 100% | 8.7 |
| Other Dietary Services Staff | 2 | 0 | 2 | 726 | 69 | 76% | 7.7 |
| Dietitian | 1 | 0 | 1 | 529 | 65 | 71% | 8.1 |
| Nurse Practitioner | 1 | 0 | 1 | 512 | 64 | 70% | 8 |
| Dental Services Staff | 1 | 0 | 1 | 508 | 63 | 69% | 8.1 |
| Clinical Nurse Specialist | 1 | 0 | 1 | 489 | 60 | 66% | 8.1 |
| Administrator | 1 | 0 | 1 | 464 | 58 | 64% | 8 |
| Physical Therapy Aide | 0 | 3 | 3 | 241 | 31 | 34% | 7.8 |
| Physical Therapy Assistant | 0 | 2 | 2 | 181 | 56 | 62% | 2.7 |
| Respiratory Therapy Technician | 0 | 5 | 5 | 111 | 42 | 46% | 2.6 |
| Occupational Therapy Aide | 0 | 1 | 1 | 72 | 12 | 13% | 6 |
| Speech Language Pathologist | 0 | 1 | 1 | 54 | 18 | 20% | 3 |
| Feeding Assistant | 0 | 1 | 1 | 22 | 11 | 12% | 2 |
| Qualified Social Worker | 0 | 1 | 1 | 19 | 25 | 27% | 0.8 |
| Medical Director | 0 | 1 | 1 | 17 | 11 | 12% | 1.5 |
| Occupational Therapy Assistant | 0 | 1 | 1 | 12 | 6 | 7% | 2 |
| Occupational Therapist | 0 | 1 | 1 | 10 | 10 | 11% | 1 |
| Diagnostic X-ray Services Staff | 0 | 1 | 1 | 6 | 3 | 3% | 2 |
Source: CMS Long-Term Care Facility Characteristics (Data as of Jan 2026)
Residents meet regularly to discuss policies, care quality, and activities
Organized group of residents that meets regularly to discuss facility policies, quality of life, and activities.
Data sourced from CMS Long-Term Care Facility Characteristics quarterly report. Payer mix reflects the current resident census by primary payment source.
These measures show how residents usually do over time at this home, based on health outcomes and preventive care.
Ohio average: 5.8
Ohio average: 12.7
Ohio average: 6.8%
Ohio average: 8.9%
Ohio average: 22.0%
Ohio average: 3.4%
Ohio average: 3.9%
Ohio average: 0.5%
Ohio average: 6.2%
Ohio average: 24.0%
Ohio average: 8.4%
Ohio average: 92.4%
Ohio average: 94.5%
Ohio average: 1.77
Ohio average: 1.83
Ohio average: 78.0%
Ohio average: 1.3%
Ohio average: 0.8%
Quality measures are calculated from Minimum Data Set (MDS) assessments. For most measures, lower percentages indicate better care quality.
Federal penalties imposed by CMS for regulatory violations, including civil money penalties (fines) and denials of payment for new Medicare/Medicaid admissions.
Source: CMS Penalties Database (Data as of Jan 2026)
Ohio average: $69K
Ohio average: 1.9
Ohio average: 0.5
Penalties are imposed by CMS for violations of federal nursing home regulations.
Last updated: Jan 2026
Historical financial and operational data for Seven Acres Senior Living at Clifton based on CMS SNF Cost Reports.
Loading trend charts...
Care Cost Calculator: See Prices in Your Area
Nursing Home Data Explorer
Don’t Wait Too Long: 7 Red Flag Signs Your Parent Needs Assisted Living Now
The True Cost of Assisted Living in 2025 – And How Families Are Paying For It
Understanding Senior Living Costs: Pricing Models, Discounts & Financial Assistance

Touring a community? Use this expert-backed checklist to stay organized, ask the right questions, and find the perfect fit.
We'll send you a PDF version of the touring checklist.


