Sherrill House
Nursing Home, Hospice Care, Memory Care & Palliative Care · Boston, MA
CMS overall rating Info CMS (the Centers for Medicare & Medicaid Services) is the federal agency that rates nursing home quality. Its Overall Rating runs from 1 to 5 stars, combining health inspections, staffing, and quality measures, with inspections weighted most heavily.

Sherrill House

Nursing Home, Hospice Care, Memory Care & Palliative Care · Boston, MA
CMS overall rating Info CMS (the Centers for Medicare & Medicaid Services) is the federal agency that rates nursing home quality. Its Overall Rating runs from 1 to 5 stars, combining health inspections, staffing, and quality measures, with inspections weighted most heavily.
Calculator: See prices in your area
Sherrill House accepts Medicare, Medicaid, and private pay.

Overview of Sherrill House

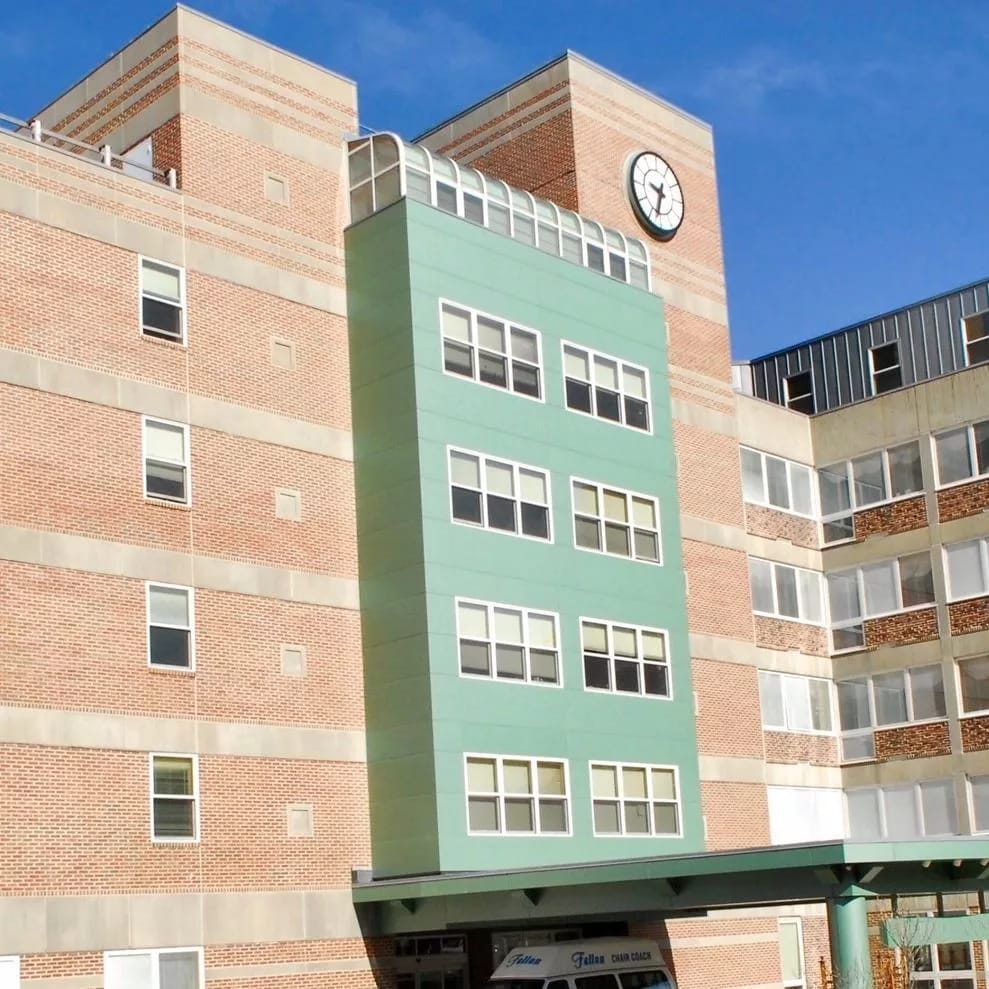
Sherrill House is a not-for-profit skilled nursing and rehabilitation center that provides graceful living for short-term or long-term residents. This skilled nursing haven also provides services for memory care. Residents of all backgrounds receive supportive assistance for everyday living with enriching activities that contribute to a high success rate for recovery. Sherrill House boasts its world-class clinical excellence that improves the quality of life for all seniors. 
Sherrill House offers an advanced level of recovery found in their short-term and long-term services that care for stroke recovery, communication disorders, and orthopedic care, tube feeding, palliative and hospice care, pain management, and heart surgery care. They exclusively offer their Return To Home™ occupational therapy program that offers fully-equipped technology that makes the recovery period faster.

(617) 731-2400

Quality ratings

Measured by Centers for Medicare & Medicaid Services (CMS)

Overall rating Info The Overall CMS Rating combines results from health inspections, staffing levels and quality measures. Health inspections carry the most weight. Staffing and quality scores can increase or decrease the final rating based on performance compared to state and national standards.
▼ 31.0% Below MA avg. ▼ 31.0% Below MA avg.MA average: 2.9Click the badge to see the full State ranking.Click here to see the full State ranking.
Health Inspection Info Based on the results of the facility's three most recent standard inspections and any complaint investigations. CMS reviews the number, scope, and severity of deficiencies, with more recent findings weighted more heavily.
▼ 29.7% Below MA avg. ▼ 29.7% Below MA avg.MA average: 2.8Click the badge to see the full State ranking.Click here to see the full State ranking.
Staffing Info Measures average nursing staff hours per resident per day, including Registered Nurses (RNs) and total nursing staff. Ratings are adjusted based on the level of care residents require and are compared to state and national benchmarks.
▲ 33.3% Above MA avg. ▲ 33.3% Above MA avg.MA average: 3.0Click the badge to see the full State ranking.Click here to see the full State ranking.
Quality Measures Info Based on clinical and physical health indicators reported to CMS, such as hospital readmissions, falls, pressure ulcers, and improvements in mobility. These measures reflect how well residents' health needs are being managed.
▲ 25.8% Above MA avg. ▲ 25.8% Above MA avg.MA average: 3.2Click the badge to see the full State ranking.Click here to see the full State ranking.

Staffing hours breakdown

Info Daily nursing hours per resident by staff type, reported to CMS. Higher is generally better — compare this facility to state and national averages to see where staffing stands.

Hours per resident per day — compared to Massachusetts state averages

Total nursing care / resident Info This home is ranked 41st out of 89 homes in Massachusetts for nurse hours. Total adjusted nursing hours per resident per day, combining RN, LPN, and aide time. CMS adjusts this for case-mix so facilities can be fairly compared.
3h 57m per day
Rank #41 / 89Nurse hours — State benchmarkedThis home is ranked 41st out of 89 homes in Massachusetts. Shows adjusted nurse hours per resident per day benchmarked to the Massachusetts average, with a ranking across 89 Massachusetts facilities. More hours mean more direct care. The national average is about 3.5 hrs; below 3.0 is a red flag.Click the rank badge to see the full State ranking.Click here to see the full State ranking.
This facility Massachusetts avg (3h 56m per day)
vs Massachusetts avg
+0%

1 of 6 metrics below state avg

Standout metric Physical Therapist is +92% above state avg
Staff typeHours / Day / Residentvs state avg
Registered Nurse (RN) Info RNs hold the highest nursing license and can assess residents, interpret test results, and direct care plans. More RN hours per day often signals stronger clinical oversight and faster response to health changes. 46m per day ▲ 19% State avg: 39m per day · National avg: 41m per day
LPN / LVN Info Licensed Practical Nurses (LPNs) or Licensed Vocational Nurses (LVNs) deliver routine hands-on care — medication administration, wound dressing, and monitoring vital signs. They work under RN supervision and make up a large share of daily bedside care. 40m per day ▼ 31% State avg: 58m per day · National avg: 52m per day
Nurse Aide Info Certified Nurse Aides (CNAs) provide the most direct day-to-day assistance: bathing, dressing, feeding, and mobility. Nurse aide hours are typically the largest staffing category and directly affect residents' quality of life. 2h 19m per day ■ Avg State avg: 2h 16m per day · National avg: 2h 21m per day
Weekend Total Nursing Info Combined nursing hours (RN + LPN + Nurse Aide) per resident per day on weekends. Staffing often drops on weekends — this figure reveals whether the facility maintains adequate coverage outside of weekday hours. 3h 25m per day ■ Avg State avg: 3h 27m per day · National avg: 3h 26m per day
Physical Therapist Info Hours per resident per day provided by licensed Physical Therapists (PTs) or PT Assistants. PT services help residents recover mobility after injury or illness and are especially important for post-acute (short-stay) rehabilitation. 8m per day ▲ 92% State avg: 4m per day · National avg: 4m per day
Weekend RN Info Registered nurse hours specifically on weekends. Facilities sometimes reduce RN presence on Saturdays and Sundays — a low weekend RN figure compared to weekday hours can indicate reduced clinical oversight when most administrative staff are absent. 40m per day ▲ 43% State avg: 28m per day · National avg: 29m per day

Capacity and availability

This home usually has availability

Lower occupancy than the Massachusetts average: 82%
Occupancy rate
79.7% Rank #56 / 92Occupancy rate — State benchmarkedThis home is ranked 56th out of 92 homes in Massachusetts. Shows this facility's occupancy rate versus the Massachusetts average, with its Statewide rank out of 92. Higher occupancy signals strong local demand and financial stability.Click the rank badge to see the full State ranking.Click here to see the full State ranking.
Avg. Length of Stay
99 days
Walk Score
Walk Score: 78 / 100 Rank #133 / 499Walk Score — State benchmarkedThis home is ranked 133rd out of 499 homes in Massachusetts. Shows how walkable this facility's neighborhood is compared to the average Walk Score across Massachusetts facilities. Higher scores benefit residents, families, and staff.Click the rank badge to see the full State ranking.Click here to see the full State ranking.
Very walkable. Most errands can be accomplished on foot, and many essentials are within a short walk.

Contact Sherrill House

Staffing Data

Reporting period: October 1 – December 31, 2025 (Q4 2025). Source: CMS Payroll-Based Journal report.

Total staff 296
Employees 191
Contractors 105
Staff to resident ratio 1.74 : 1
5% more staff per resident than Massachusetts average
Massachusetts average ratio: 1.66 : 1 Massachusetts average ratio: 1.66 : 1See full Massachusetts ranking
Avg staff/day 104
Average shift 8.4 hours
6% better than Massachusetts average
Massachusetts average: 7.9 hours Massachusetts average shift: 7.9 hoursSee full Massachusetts ranking
Total staff hours (quarter) 79,919

Nursing staff breakdown

Q4 2025 · Oct 1 – Dec 31 More info This data comes from the CMS Payroll-Based Journal report covering October 1 – December 31, 2025.
Registered Nurse

Manages medical care and health needs.

RN Staff Info 71 total: 22 full-time employees and 49 contractors. 71
Average shift length Info Average shift length. Calculated as total hours divided by days worked and average staff per day. 9.8 hours
Licensed Practical Nurse

Assists with medical care and medications.

LPN Staff Info 37 total: 14 full-time employees and 23 contractors. 37
Average shift length Info Average shift length. Calculated as total hours divided by days worked and average staff per day. 9.4 hours
Certified Nursing Assistant

Helps with daily care and mobility.

CNA Staff Info 115 total: 84 full-time employees and 31 contractors. 115
Average shift length Info Average shift length. Calculated as total hours divided by days worked and average staff per day. 8.7 hours

Contractor staffing

Q4 2025 · Oct 1 – Dec 31 More info This data comes from the CMS Payroll-Based Journal report covering October 1 – December 31, 2025.

Total hours from contractors

2.4%

1,911 contractor hours this quarter

Registered Nurse: 49 Certified Nursing Assistant: 31 Licensed Practical Nurse: 23 Medical Director: 1 Occupational Therapy Assistant: 1

Staff by category

Q4 2025 · Oct 1 – Dec 31 More info This data comes from the CMS Payroll-Based Journal report covering October 1 – December 31, 2025.
Certified Nursing Assistant843111535,11992100%8.7
Physical Therapist3103112,15292100%7.5
Registered Nurse2249719,36492100%9.8
Licensed Practical Nurse1423379,14892100%9.4
Other Dietary Services Staff8083,0579199%7.4
Physical Therapy Assistant6061,9707683%7.7
Respiratory Therapy Technician6061,9489098%7.4
Clinical Nurse Specialist3031,3448693%8
Mental Health Service Worker3031,1436773%6
RN Director of Nursing3031,0406470%8
Nurse Practitioner2021,0126470%8.2
Qualified Social Worker3034966773%4.7
Administrator1014806065%8
Therapeutic Recreation Specialist1014736368%7.5
Occupational Therapy Aide2024665863%7.4
Medical Director0112963740%8
Dietitian1012928896%3.3
Occupational Therapy Assistant011721011%7.2
Physical Therapy Aide1014989%6.2
115 Certified Nursing Assistant
% of Days 100%
31 Physical Therapist
% of Days 100%
71 Registered Nurse
% of Days 100%
37 Licensed Practical Nurse
% of Days 100%
8 Other Dietary Services Staff
% of Days 99%
6 Physical Therapy Assistant
% of Days 83%
6 Respiratory Therapy Technician
% of Days 98%
3 Clinical Nurse Specialist
% of Days 93%
3 Mental Health Service Worker
% of Days 73%
3 RN Director of Nursing
% of Days 70%
2 Nurse Practitioner
% of Days 70%
3 Qualified Social Worker
% of Days 73%
1 Administrator
% of Days 65%
1 Therapeutic Recreation Specialist
% of Days 68%
2 Occupational Therapy Aide
% of Days 63%
1 Medical Director
% of Days 40%
1 Dietitian
% of Days 96%
1 Occupational Therapy Assistant
% of Days 11%
1 Physical Therapy Aide
% of Days 9%

Penalties and fines

Federal penalties imposed by CMS for regulatory violations, including civil money penalties (fines) and denials of payment for new Medicare/Medicaid admissions.

Source: CMS Penalties Database

No penalties in the past 3 years

No civil money penalties or payment denials were reported in the last 3 years.

Quality of care over time

These measures show how residents usually do over time at this home, based on health outcomes and preventive care.

High-risk clinical events score Info A composite score based on pressure ulcers, falls with injury, weight loss, walking ability decline, and activities of daily living decline. 5.9
42% better than Massachusetts average

Massachusetts average: 10.2

Functional decline score Info A composite score based on activities of daily living decline, walking ability decline, and incontinence. 12.6
37% better than Massachusetts average

Massachusetts average: 20.0

Long-stay resident measures
Above average Massachusetts avg: 3.6 Info CMS star rating based on long-stay quality measure performance. 5 stars = significantly above average, 1 star = significantly below average.
Need for Help with Daily Activities Increased Info Percent of long-stay residents whose need for help with daily activities has increased 10.2%
45% better than Massachusetts average

Massachusetts average: 18.7%

Walking Ability Worsened Info Percent of long-stay residents whose ability to move independently worsened 11.6%
40% better than Massachusetts average

Massachusetts average: 19.3%

Low Risk Residents with Bowel/Bladder Incontinence Info Percent of low risk long-stay residents who lose control of their bowels or bladder 16.0%
28% better than Massachusetts average

Massachusetts average: 22.1%

Falls with Major Injury Info Percent of long-stay residents experiencing one or more falls with major injury 1.8%
49% better than Massachusetts average

Massachusetts average: 3.6%

High Risk Residents with Pressure Ulcers Info Percent of long-stay high risk residents with pressure ulcers 2.9%
37% better than Massachusetts average

Massachusetts average: 4.7%

Urinary Tract Infection Info Percent of long-stay residents with a urinary tract infection 3.2%
55% worse than Massachusetts average

Massachusetts average: 2.1%

Lost Too Much Weight Info Percent of long-stay residents who lose too much weight 3.0%
42% better than Massachusetts average

Massachusetts average: 5.2%

Depressive Symptoms Info Percent of long-stay residents who have depressive symptoms 0.4%
96% better than Massachusetts average

Massachusetts average: 10.7%

Antipsychotic Use Info Percent of long-stay residents who received an antipsychotic medication 10.9%
46% better than Massachusetts average

Massachusetts average: 20.3%

Pneumococcal Vaccine Info Percent of long-stay residents assessed and appropriately given the pneumococcal vaccine 98.4%
7% better than Massachusetts average

Massachusetts average: 91.9%

Influenza Vaccine Info Percent of long-stay residents assessed and appropriately given the seasonal influenza vaccine 97.9%
In line with Massachusetts average

Massachusetts average: 94.8%

Hospitalizations per 1,000 days Info Number of hospitalizations per 1,000 long-stay resident days. 2.43
31% worse than Massachusetts average

Massachusetts average: 1.86

ED visits per 1,000 days Info Number of outpatient emergency department visits per 1,000 long-stay resident days. 1.17
24% better than Massachusetts average

Massachusetts average: 1.54

Short-stay resident measures
Significantly above average Massachusetts avg: 3.2 Info CMS star rating based on short-stay quality measure performance. 5 stars = much above average, 1 star = much below average.
Pneumococcal Vaccine Info Percent of short-stay residents assessed and appropriately given the pneumococcal vaccine 88.0%
15% better than Massachusetts average

Massachusetts average: 76.7%

Antipsychotic medication increase Info Percent of short-stay residents who newly received an antipsychotic medication 0.4%
73% better than Massachusetts average

Massachusetts average: 1.3%

Influenza Vaccine Info Percent of short-stay residents assessed and appropriately given the seasonal influenza vaccine 82.1%
6% better than Massachusetts average

Massachusetts average: 77.7%

Re-hospitalized after SNF stay Info Percentage of short-stay residents who were re-hospitalized after their nursing home admission. 35.9%
39% worse than Massachusetts average

Massachusetts average: 25.8%

Emergency department visits Info Percentage of short-stay residents who had an outpatient emergency department visit. 7.5%
36% better than Massachusetts average

Massachusetts average: 11.8%

Falls with major injury Info Percentage of SNF residents who experience falls with major injury during their stay. 0.2%
70% better than Massachusetts average

Massachusetts average: 0.8%

Ability to care for self at discharge Info Percentage of residents at or above expected ability to care for themselves at discharge. 53.5%
In line with Massachusetts average

Massachusetts average: 53.7%

Successful return to home or community Info Rate of successful return to home or community from a skilled nursing facility. 64.4%
27% better than Massachusetts average

Massachusetts average: 50.6%

Breakdown by payment type

Medicare

60% of new residents, usually for short-term rehab.

Typical stay 23 days

Private pay

37% of new residents, often for short stays.

Typical stay 2 months

Medicaid

3% of new residents, often for long-term daily care.

Typical stay 4 - 5 years

Facility Characteristics

Source: CMS Long-Term Care Facility Characteristics (Data as of Jan 2026)

Total residents 170
Medicare
32
18.8% of residents
Medicaid
121
71.2% of residents
Private pay or other
17
10% of residents
Programs & Services
Residents Group

Residents meet regularly to discuss policies, care quality, and activities

Family Member Group

Family members meet regularly to discuss policies, care quality, and activities

Active Family Council

Organized group of family members that meets regularly to discuss facility policies, resident care, and activities.

Active Resident Council

Organized group of residents that meets regularly to discuss facility policies, quality of life, and activities.

Finances and operations

Based on the 2023 CMS SNF Cost Report.

Governmental community
Operated by a subsidized facility district.
Home revenue
$30.5M
Operating deficit
-$854.4K
Governmental community Operated by a subsidized facility district.
Home revenue
$30.5M Rank #12 / 92Revenue — State benchmarkedThis home is ranked 12th out of 92 homes in Massachusetts. Shows this facility's annual revenue compared to the Massachusetts average. Higher revenue generally means more resources for staffing and capital — read alongside Payroll %.Click the rank badge to see the full State ranking.Click here to see the full State ranking.
Operating deficit
-$854.4K
Payroll costs Info The portion of the home's budget spent on staff, including nurses, caregivers, and other employees who support care and operations. Rank #5 / 92Payroll — State benchmarkedThis home is ranked 5th out of 92 homes in Massachusetts. Shows total annual staff payroll benchmarked to the Massachusetts average. Higher payroll investment relative to peers often signals better staffing and less reliance on cheaper contract labor.Click the rank badge to see the full State ranking.Click here to see the full State ranking.
$20.9M
68.4% of revenue Rank #6 / 92Payroll % — State benchmarkedThis home is ranked 6th out of 92 homes in Massachusetts. Shows payroll as a percentage of revenue versus the Massachusetts average. Well-run Massachusetts facilities typically land around 54–65% — the top third Statewide. Below 25% may signal understaffing or heavy agency use — read with Staffing ratings.Click the rank badge to see the full State ranking.Click here to see the full State ranking.
Other operating costs Info All remaining costs needed to run the home, such as food, utilities, building maintenance, supplies and administrative expenses.
$10.5M
Total costs $31.3M

Who this home usually serves

TYPE OF STAY

Mostly short-term rehab stays

Most residents typically stay for a few weeks or months before returning home or moving on.

Most new residents arrive under Medicare (60% of admissions), and a typical Medicare stay runs around 23 days.

Admissions
646 total

Coverage residents most often arrive under.

Medicare 60%
Private pay 37%
Medicaid 3%
Discharges
565 total

Coverage residents most often leave under.

Medicare 58%
Private pay 36%
Medicaid 6%

Places of interest near Sherrill House

Address 3.4 miles from city center Info Estimated distance in miles from Boston's city center to Sherrill House's address, calculated via Google Maps. — 0.12 miles to nearest hospital (Jamaica Plain VA Medical Center)

Calculate Travel Distance to Sherrill House

Add your location

Address

Financial Assistance for
Nursing Home in Massachusetts

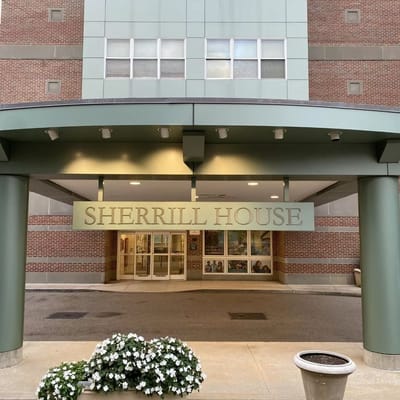
Sherrill House is located in Boston, Massachusetts.
Here are the financial assistance programs available to residents in Massachusetts.

Get Financial aid guidance

Home Care Program

MassHealth Home Care

Age 60+
General Massachusetts resident, at risk of nursing home placement.
Income Limits (2025) ~$1,500/month individual, varies by region
Asset Limits $2,000 individual, excludes home, car
MA

Coordinated through Aging Services Access Points (ASAPs); high demand in urban areas.

Benefits
In-home care (3-5 hours/day) Homemaker services Respite care (up to 14 days/year) Adult day care (~$75/day)

Frail Elder Waiver

Massachusetts Medicaid FE Waiver

Age 65+
General Massachusetts resident, Medicaid-eligible, nursing home-level care need.
Income Limits (2025) ~$2,829/month 300% FBR, individual
Asset Limits $2,000 (individual), $3,000 (couple).
MA

Requires clinical eligibility determination.

Benefits
Personal care (5-7 hours/day) Respite care (240 hours/year) Adult day care (~$75/day) Home health services

Senior Care Options (SCO)

Massachusetts Senior Care Options

Age 65+
General Massachusetts resident, eligible for MassHealth (Medicare optional), nursing home-level care need.
Income Limits (2025) ~$2,829/month (300% FBR, individual); QIT allowed.
Asset Limits $2,000 (individual), $3,000 (couple) (excludes home up to $713,000, car).
MA

Not available in Dukes/Nantucket Counties; multiple SCO providers (e.g., CCA, Tufts).

Benefits
Personal care (5-7 hours/day) Medical care Respite (240 hours/year) Adult

Medicare Savings Program (MSP)

Massachusetts Medicare Savings Program (MassHealth Buy-In)

Age 65+ or disabled
General Massachusetts resident, Medicare Part A/B.
Income Limits (2025) ~$2,510/month (QMB), ~$3,380/month (SLMB), ~$3,598/month (QI)—individual.
Asset Limits $9,430 (individual), $14,130 (couple).
MA

Three tiers; no waitlist; includes Extra Help for Part D.

Benefits
Covers Part B premiums ($174.70/month) Deductibles ($240/year) Copays (~20%)

National Family Caregiver Support Program (NFCSP) Respite

Massachusetts NFCSP Respite Care

Age
General Caregivers of 60+ needing care or 55+ caregivers of others; Massachusetts resident; functional needs (2+ ADLs).
Income Limits (2025) Prioritizes ~$24,980/year (individual); no strict cap.
Asset Limits Not assessed; need-based.
MA

27 ASAPs; prioritizes low-income, rural caregivers.

Benefits
Respite (4-6 hours/week or 5 days/year) Adult day care ($60/day) Caregiver training Supplies (~$500/year)

Prescription Advantage

Massachusetts Prescription Advantage

Age 65+ or disabled
General Massachusetts resident, enrolled in Medicare Part D (or ineligible for Medicare).
Income Limits (2025) No strict limit; copays vary by income ~$24,980-$75,000/year individual
Asset Limits Not assessed.
MA

Supplements Medicare Part D; no enrollment fee for low-income.

Benefits
Covers prescription copays ($5-$40/drug) Fills coverage gaps Catastrophic cost protection ($4,000+ covered)

VA Aid and Attendance (A&A) and Housebound Benefits

Massachusetts VA Aid and Attendance/Housebound

Age 65+ or disabled veteran/spouse
General Massachusetts resident, wartime service, need for ADL help (A&A) or homebound.
Income Limits (2025) Net income < ~$1,984/month (veteran with dependent, A&A); pension offsets income.
Asset Limits ~$155,356 net worth limit
MA

High veteran demand statewide.

Benefits
Cash (~$1,433-$2,642/month veteran, ~$951-$1,318 spouse) for care costs (e.g., in-home, assisted living)

Compare Nursing Home around Boston

The information below is reported by the Massachusetts Executive Office of Elder Affairs and Department of Public Health.

5 facilities compared · CMS & MA Dept. of Health data

The Boston Home Inc
NH

Nursing Home Licensed facility providing 24/7 skilled nursing care for residents with complex, ongoing medical needs. Staffed by RNs, LPNs, and CNAs. Inspected and star-rated annually by CMS. Accepts Medicare (short-term rehab) and Medicaid (long-term care).

RC

Respite Care Short-term temporary care — days to weeks — to give family caregivers a break. Full care provided during the stay. Often used after hospitalization or to trial a facility before a permanent placement decision.

Dorchester Center (Dorchester)
96
Facility 96
MA AVG 94
Rank #109 / 280
96.6%
Facility 96.6%
MA AVG 82%
Rank #5 / 92
+18%
5.17
Facility 5.17
MA AVG 3.93
Rank #7 / 89
-18%+32%
$0
Facility $0
MA AVG $76.6k
Rank #1 / 90
8
Facility 8
MA AVG 32.7
Rank #7 / 89
8.0
Facility 8.0
MA AVG 7.2
Rank #62 / 89
-93-
76
Facility 76
MA AVG 53
Rank #146 / 499
Christine Reilly
$23.1M
Facility $23.1M
MA AVG $17.4M
Rank #34 / 92
$15.0M
Facility $15.0M
MA AVG $6.5M
Rank #11 / 92
64.7%
Facility 64.7%
MA AVG 43.6%
Rank #10 / 92
225434
Hebrew SeniorLife
NH

Nursing Home Licensed facility providing 24/7 skilled nursing care for residents with complex, ongoing medical needs. Staffed by RNs, LPNs, and CNAs. Inspected and star-rated annually by CMS. Accepts Medicare (short-term rehab) and Medicaid (long-term care).

AL

Assisted Living A licensed, long-term care setting for seniors or individuals with disabilities who need help with daily activities — like bathing, dressing, and medication management — but not 24-hour skilled nursing. Offers housing, meals, and around-the-clock support while aiming to maximize resident independence.

HC

Home Care Professional care delivered in the person's own home — from companionship and errands to skilled nursing and therapy. Allows seniors to age in place. Medicare covers skilled home health when medically necessary.

HC

Home Care Professional care delivered in the person's own home — from companionship and errands to skilled nursing and therapy. Allows seniors to age in place. Medicare covers skilled home health when medically necessary.

IL

Independent Living Lifestyle-focused communities for older adults offering dining, activities, and transportation with minimal personal care. Best for active, independent seniors who want community without medical support.

MC

Memory Care Secured, specialized care for people living with Alzheimer's or dementia. Staff trained in cognitive impairment, with higher staff-to-resident ratios and an environment designed to reduce confusion and wandering risk.

PC

Palliative Care

Boston (Roslindale)
50
Facility 50
MA AVG 94
Rank #235 / 280
--
4.65
Facility 4.65
MA AVG 3.93
Rank #12 / 89
+18%+18%
$0
Facility $0
MA AVG $76.6k
Rank #1 / 90
11
Facility 11
MA AVG 32.7
Rank #9 / 89
3.7
Facility 3.7
MA AVG 7.2
Rank #15 / 89
-32-
38
Facility 38
MA AVG 53
Rank #324 / 499
----225759
St. Joseph Rehabilitation and Nursing Center
NH

Nursing Home Licensed facility providing 24/7 skilled nursing care for residents with complex, ongoing medical needs. Staffed by RNs, LPNs, and CNAs. Inspected and star-rated annually by CMS. Accepts Medicare (short-term rehab) and Medicaid (long-term care).

HC

Home Care Professional care delivered in the person's own home — from companionship and errands to skilled nursing and therapy. Allows seniors to age in place. Medicare covers skilled home health when medically necessary.

MC

Memory Care Secured, specialized care for people living with Alzheimer's or dementia. Staff trained in cognitive impairment, with higher staff-to-resident ratios and an environment designed to reduce confusion and wandering risk.

NC

Nursing Care

Dorchester
123
Facility 123
MA AVG 94
Rank #55 / 280
31.7%
Facility 31.7%
MA AVG 82%
Rank #89 / 92
-61%
3.90
Facility 3.90
MA AVG 3.93
Rank #41 / 89
+40%-1%
$82.6k
Facility $82.6k
MA AVG $76.6k
Rank #82 / 90
50
Facility 50
MA AVG 32.7
Rank #78 / 89
8.3
Facility 8.3
MA AVG 7.2
Rank #63 / 89
639A+
83
Facility 83
MA AVG 53
Rank #102 / 499
Landmark Health Solutions, LLC
$21.2M
Facility $21.2M
MA AVG $17.4M
Rank #45 / 92
$10.2M
Facility $10.2M
MA AVG $6.5M
Rank #49 / 92
48.2%
Facility 48.2%
MA AVG 43.6%
Rank #54 / 92
225493
Sherrill House
NH

Nursing Home Licensed facility providing 24/7 skilled nursing care for residents with complex, ongoing medical needs. Staffed by RNs, LPNs, and CNAs. Inspected and star-rated annually by CMS. Accepts Medicare (short-term rehab) and Medicaid (long-term care).

HC

Home Care Professional care delivered in the person's own home — from companionship and errands to skilled nursing and therapy. Allows seniors to age in place. Medicare covers skilled home health when medically necessary.

MC

Memory Care Secured, specialized care for people living with Alzheimer's or dementia. Staff trained in cognitive impairment, with higher staff-to-resident ratios and an environment designed to reduce confusion and wandering risk.

PC

Palliative Care

Boston (Jamaica Hills)
196
Facility 196
MA AVG 94
Rank #9 / 280
79.7%
Facility 79.7%
MA AVG 82%
Rank #56 / 92
-3%
3.94
Facility 3.94
MA AVG 3.93
Rank #41 / 89
+88%0%
$0
Facility $0
MA AVG $76.6k
Rank #1 / 90
27
Facility 27
MA AVG 32.7
Rank #45 / 89
3.9
Facility 3.9
MA AVG 7.2
Rank #17 / 89
-165-
78
Facility 78
MA AVG 53
Rank #133 / 499
Joao Santos
$30.5M
Facility $30.5M
MA AVG $17.4M
Rank #12 / 92
$20.9M
Facility $20.9M
MA AVG $6.5M
Rank #5 / 92
68.4%
Facility 68.4%
MA AVG 43.6%
Rank #6 / 92
225201
Edgar P. Benjamin Healthcare Center
NH

Nursing Home Licensed facility providing 24/7 skilled nursing care for residents with complex, ongoing medical needs. Staffed by RNs, LPNs, and CNAs. Inspected and star-rated annually by CMS. Accepts Medicare (short-term rehab) and Medicaid (long-term care).

PC

Palliative Care

RC

Respite Care Short-term temporary care — days to weeks — to give family caregivers a break. Full care provided during the stay. Often used after hospitalization or to trial a facility before a permanent placement decision.

Boston (Mission Hill)
205
Facility 205
MA AVG 94
Rank #7 / 280
49.3%
Facility 49.3%
MA AVG 82%
Rank #87 / 92
-40%
3.45
Facility 3.45
MA AVG 3.93
Rank #69 / 89
+36%-12%
$95.0k
Facility $95.0k
MA AVG $76.6k
Rank #83 / 90
32
Facility 32
MA AVG 32.7
Rank #57 / 89
5.3
Facility 5.3
MA AVG 7.2
Rank #32 / 89
280-
82
Facility 82
MA AVG 53
Rank #108 / 499
Tony Francis
$11.3M
Facility $11.3M
MA AVG $17.4M
Rank #80 / 92
$8.3M
Facility $8.3M
MA AVG $6.5M
Rank #63 / 92
73.8%
Facility 73.8%
MA AVG 43.6%
Rank #4 / 92
225654

Frequently Asked Questions about Sherrill House

What neighborhood is Sherrill House in?

Sherrill House is in the Jamaica Hills neighborhood.

Is Sherrill House in a walkable area?

Sherrill House has a walk score of 78. Very walkable. Most errands can be accomplished on foot, and many essentials are within a short walk.

What is the occupancy rate at Sherrill House?

Sherrill House's occupancy is 79.7%.

Are there photos of Sherrill House?

Yes — there are 5 photos of Sherrill House in the photo gallery on this page.

What is the phone number of Sherrill House?

(617) 731-2400 will put you in contact with the team at Sherrill House.

Is Sherrill House Medicare or Medicaid certified?

Yes — Sherrill House is a CMS-certified provider of Medicare and Medicaid.

Guides for Better Senior Living

Care Cost Calculator: See Prices in Your Area

Nursing Home Data Explorer

Don’t Wait Too Long: 7 Red Flag Signs Your Parent Needs Assisted Living Now

The True Cost of Assisted Living in 2025 – And How Families Are Paying For It

Understanding Senior Living Costs: Pricing Models, Discounts & Financial Assistance

Explore Open Rooms
1 Contact details
2 What type of senior care service are you looking for?
3 What budget do you have in mind for senior care?
4 How soon do you need to find care?
5 Additional details

Thank you for your interest!

Our team will be in touch shortly to help with next steps.