


Total staff
389
Employees
178
Contractors
211
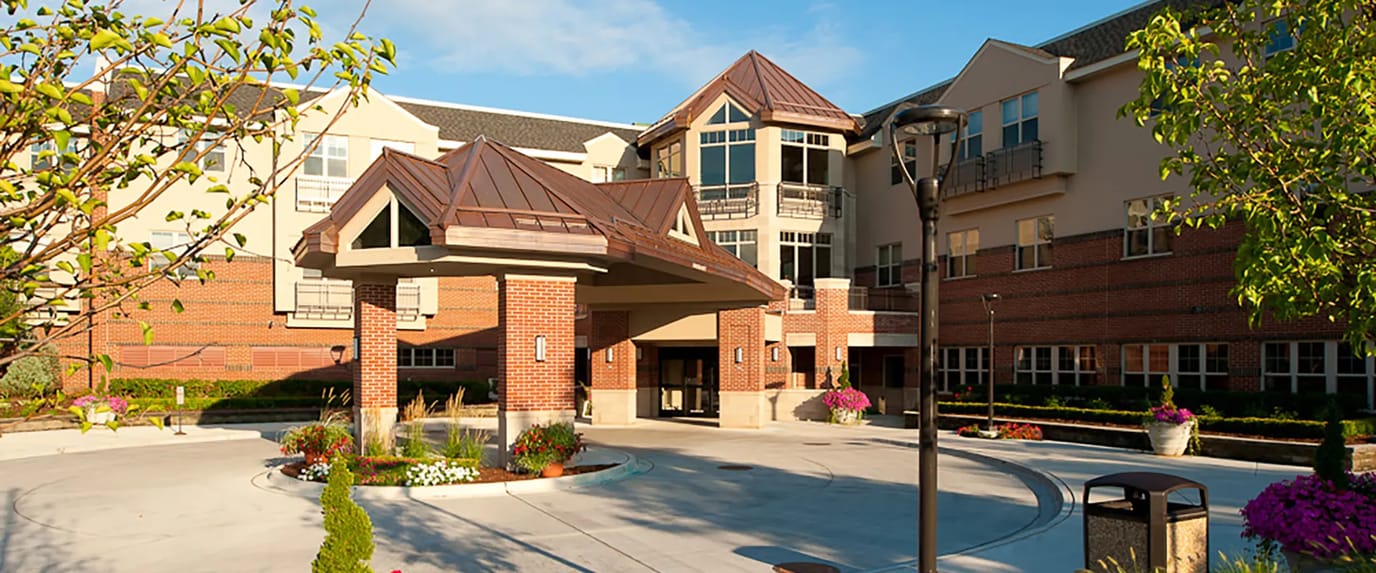


ShorePointe is a nursing home in St. Clair Shores, MI, offering hospice care, rehabilitation, respite care, and skilled nursing. Dedicated to older adults’ comfort and healing, the community continuously promotes a home-like atmosphere. With 24/7 care, concierge services, and nutritious meals, residents can focus on their recovery and rehabilitation. Along with a multidisciplinary care team, residents also receive the best possible care tailored to their needs and habits.
Religious services, bingo, and exercises help residents maintain their spiritual, emotional, and mental well-being. Residents can also connect with friends and relax with a hair salon, an ice parlor, and outdoor courtyards. Situated near restaurants, shops, and public transportation in the residential area of St. Clair Shores, the community guarantees a stress-free retirement. Providing high standards of care for older adults’ welfare, this nursing home is a great choice for senior living in Michigan.
| Staff type | Hours / Day / Resident | vs state avg |
|---|---|---|
|
Registered Nurse (RN)
| 44m per day | ▼ 4% State avg: 46m per day · National avg: 41m per day |
|
LPN / LVN
| 1h 17m per day | ▲ 44% State avg: 53m per day · National avg: 52m per day |
|
Nurse Aide
| 2h 13m per day | ▼ 5% State avg: 2h 20m per day · National avg: 2h 20m per day |
|
Weekend Total Nursing
| 3h 44m per day | ▲ 6% State avg: 3h 31m per day · National avg: 3h 27m per day |
|
Physical Therapist
| 5m per day | ▲ 9% State avg: 4m per day · National avg: 4m per day |
|
Weekend RN
| 26m per day | ▼ 12% State avg: 29m per day · National avg: 29m per day |
Reporting period: October 1 – December 31, 2025 (Q4 2025). Source: CMS Payroll-Based Journal report.
Manages medical care and health needs.
Assists with medical care and medications.
Helps with daily care and mobility.
Total hours from contractors
11,785 contractor hours this quarter
| Certified Nursing Assistant | 92 | 98 | 190 | 30,560 | 92 | 100% | 8.3 |
| Licensed Practical Nurse | 39 | 62 | 101 | 16,674 | 92 | 100% | 9.3 |
| Registered Nurse | 17 | 8 | 25 | 7,037 | 92 | 100% | 8.5 |
| Clinical Nurse Specialist | 7 | 0 | 7 | 2,808 | 66 | 72% | 8.5 |
| Physical Therapy Aide | 0 | 11 | 11 | 2,705 | 91 | 99% | 6.8 |
| Mental Health Service Worker | 8 | 0 | 8 | 2,601 | 64 | 70% | 7.9 |
| Speech Language Pathologist | 0 | 12 | 12 | 2,317 | 87 | 95% | 7.1 |
| Other Dietary Services Staff | 3 | 0 | 3 | 1,492 | 85 | 92% | 8.2 |
| RN Director of Nursing | 3 | 0 | 3 | 1,344 | 64 | 70% | 8 |
| Respiratory Therapy Technician | 0 | 7 | 7 | 1,056 | 83 | 90% | 7.3 |
| Administrator | 2 | 0 | 2 | 960 | 64 | 70% | 8 |
| Physical Therapy Assistant | 0 | 10 | 10 | 801 | 89 | 97% | 5.5 |
| Qualified Social Worker | 0 | 3 | 3 | 743 | 66 | 72% | 6.6 |
| Nurse Aide in Training | 3 | 0 | 3 | 626 | 71 | 77% | 6.2 |
| Other Social Services Staff | 1 | 0 | 1 | 548 | 65 | 71% | 8.4 |
| Occupational Therapy Aide | 1 | 0 | 1 | 496 | 62 | 67% | 8 |
| Qualified Activities Professional | 1 | 0 | 1 | 493 | 62 | 67% | 8 |
| Nurse Practitioner | 1 | 0 | 1 | 488 | 61 | 66% | 8 |
Federal penalties imposed by CMS for regulatory violations, including civil money penalties (fines) and denials of payment for new Medicare/Medicaid admissions.
Source: CMS Penalties Database
No penalties in the past 3 years
No civil money penalties or payment denials were reported in the last 3 years.
These measures show how residents usually do over time at this home, based on health outcomes and preventive care.
Michigan average: 8.4
Michigan average: 16.3
Michigan average: 12.5%
Michigan average: 15.3%
Michigan average: 21.0%
Michigan average: 3.2%
Michigan average: 5.7%
Michigan average: 1.7%
Michigan average: 5.7%
Michigan average: 3.9%
Michigan average: 15.0%
Michigan average: 94.9%
Michigan average: 95.0%
Michigan average: 82.5%
Michigan average: 1.4%
Michigan average: 79.5%
Quality measures are calculated from Minimum Data Set (MDS) assessments. For most measures, lower percentages indicate better care quality.
41% of new residents, usually for short-term rehab.
55% of new residents, often for short stays.
3% of new residents, often for long-term daily care.
Source: CMS Long-Term Care Facility Characteristics (Data as of Jan 2026)
Residents meet regularly to discuss policies, care quality, and activities
State-approved Nurse Aide Training and Competency Evaluation Program on-site
Organized group of residents that meets regularly to discuss facility policies, quality of life, and activities.
Data sourced from CMS Long-Term Care Facility Characteristics quarterly report. Payer mix reflects the current resident census by primary payment source.
Historical financial and operational data for ShorePointe from 2011–2023, based on CMS SNF Cost Reports.
Key figures below are for fiscal year ending in 12/2023.
Based on CMS SNF Cost Report for fiscal year ending in 12/2023.
No pets allowed
Housing Options: Private / Semi-Private Rooms
Building Type: 3-story
Beauty Services
Social and Recreational Activities
Rehabilitative Support

On-site Medical Care and Health Services

Medication Management
This home supports both short-term rehab and long-term care, with residents staying for a wide range of durations.
Most new residents arrive under private pay (55% of admissions), and a typical private pay stay runs around 1 - 2 months.
Coverage residents most often arrive under.
Coverage residents most often leave under.
![]() 1.5 miles from city center
1.5 miles from city center
![]() Estimated distance in miles from St Clair Shores's city center to ShorePointe's address, calculated via Google Maps.
Estimated distance in miles from St Clair Shores's city center to ShorePointe's address, calculated via Google Maps.
Add your location
Info below is compiled from CMS reports & the MI Licensing & Regulatory Affairs (LARA), senior community websites & trusted data sources such as Walk Score & BBB.
Communities are listed from highest to lowest based on our ranking methodology.
| Optalis Health & Rehabilitation of Grosse Pointe Woods | NH AL IL MC RC SNF | St Clair Shores | 80
Facility
80
MI AVG
74
Rank
#176 / 430 |
89.4%
Facility
89.4%
MI AVG
74
Rank
#42 / 119 | +21% | 4.03
Facility
4.03
MI AVG
4.30
Rank
#69 / 140 | -47% | -6% | $0
Facility
$0
MI AVG
$87.6k
Rank
#1 / 143 | 25
Facility
25
MI AVG
33.5
Rank
#62 / 142 | 4.2
Facility
4.2
MI AVG
5.2
Rank
#48 / 142 | 1 | 72 | - |
73
Facility
73
MI AVG
39
Rank
#55 / 703 | Om Holdco 5 LLC | $7.9M*Fiscal year ending 12/2022These figures are from this home's most recent complete cost report — an older period than most facilities report. Compare with that in mind.
Facility
$7.9M*Fiscal year ending 12/2022These figures are from this home's most recent complete cost report — an older period than most facilities report. Compare with that in mind.
MI AVG
$15.8M
Rank
#109 / 141 | $5.6M*Fiscal year ending 12/2022These figures are from this home's most recent complete cost report — an older period than most facilities report. Compare with that in mind.
Facility
$5.6M*Fiscal year ending 12/2022These figures are from this home's most recent complete cost report — an older period than most facilities report. Compare with that in mind.
MI AVG
$5.6M
Rank
#97 / 141 | 70.4%*Fiscal year ending 12/2022These figures are from this home's most recent complete cost report — an older period than most facilities report. Compare with that in mind.
Facility
70.4%*Fiscal year ending 12/2022These figures are from this home's most recent complete cost report — an older period than most facilities report. Compare with that in mind.
MI AVG
39%
Rank
#50 / 141 | 235109 | ||||
| Regency at St. Clair Shores | NH HOS RC SNF | St Clair Shores | 146
Facility
146
MI AVG
74
Rank
#34 / 430 |
92.7%
Facility
92.7%
MI AVG
74
Rank
#27 / 119 | +25% | 3.80
Facility
3.80
MI AVG
4.30
Rank
#94 / 140 | -52% | -12% | $22.9k
Facility
$22.9k
MI AVG
$87.6k
Rank
#99 / 143 | 29
Facility
29
MI AVG
33.5
Rank
#69 / 142 | 4.1
Facility
4.1
MI AVG
5.2
Rank
#47 / 142 | 2 | 135 | - |
77
Facility
77
MI AVG
39
Rank
#43 / 703 | Joseph Jarackas | $19.9MFiscal year ending 12/2023
Facility
$19.9MFiscal year ending 12/2023
MI AVG
$15.8M
Rank
#14 / 141 | $9.9MFiscal year ending 12/2023
Facility
$9.9MFiscal year ending 12/2023
MI AVG
$5.6M
Rank
#22 / 141 | 49.7%Fiscal year ending 12/2023
Facility
49.7%Fiscal year ending 12/2023
MI AVG
39%
Rank
#113 / 141 | 235319 | ||||
| ShorePointe | NH AL IL MC RC SNF | St Clair Shores | 200
Facility
200
MI AVG
74
Rank
#7 / 430 |
76.5%
Facility
76.5%
MI AVG
74
Rank
#69 / 119 | +3% | 3.91
Facility
3.91
MI AVG
4.30
Rank
#77 / 140 | -37% | -9% | $0
Facility
$0
MI AVG
$87.6k
Rank
#1 / 143 | 31
Facility
31
MI AVG
33.5
Rank
#76 / 142 | 3.4
Facility
3.4
MI AVG
5.2
Rank
#31 / 142 | 1 | 153 | - |
54
Facility
54
MI AVG
39
Rank
#188 / 703 | Om Holdco, LLC | $21.1MFiscal year ending 12/2023
Facility
$21.1MFiscal year ending 12/2023
MI AVG
$15.8M
Rank
#43 / 141 | $10.6MFiscal year ending 12/2023
Facility
$10.6MFiscal year ending 12/2023
MI AVG
$5.6M
Rank
#32 / 141 | 50.1%Fiscal year ending 12/2023
Facility
50.1%Fiscal year ending 12/2023
MI AVG
39%
Rank
#51 / 141 | 235443 |
ShorePointe is located in St Clair Shores, Michigan.
Here are the financial assistance programs available to residents in Michigan.
ShorePointe has a walk score of 54. Moderately walkable. Some errands can be accomplished on foot, with a mix of nearby amenities.
ShorePointe's occupancy is 68.6%.
No, ShorePointe has a no-pet policy.
ShorePointe is registered as a for-profit.
Yes — there are 7 photos of ShorePointe in the photo gallery on this page.
ShorePointe is located at 26001 Jefferson Ave, St Clair Shores, MI 48081.
(586) 779-7000 will put you in contact with the team at ShorePointe.
Care Cost Calculator: See Prices in Your Area
Nursing Home Data Explorer
Don’t Wait Too Long: 7 Red Flag Signs Your Parent Needs Assisted Living Now
The True Cost of Assisted Living in 2025 – And How Families Are Paying For It
Understanding Senior Living Costs: Pricing Models, Discounts & Financial Assistance


