Total health inspections
3
Virginia average 4.2
Last Health inspection on Jul 2023

We arrange tours, appointments, and even moving support so you don’t have to
Thank you for your interest!
Our team will be in touch shortly to help with next steps.


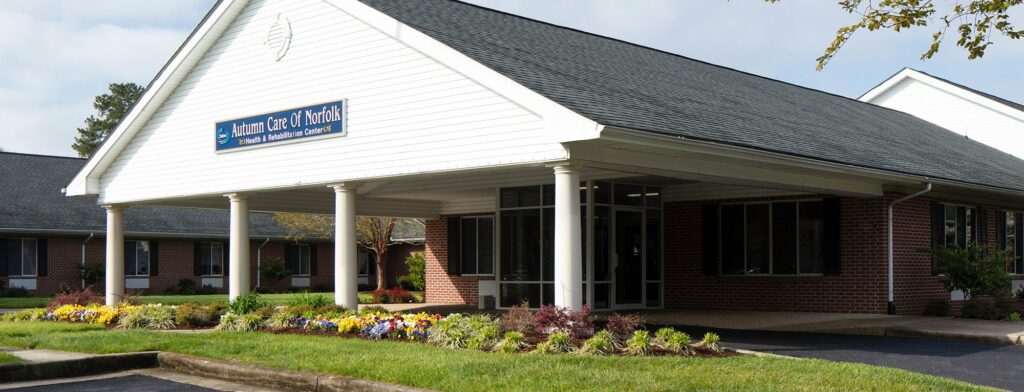
Signature Healthcare of Norfolk, recognized as a reliable skilled nursing home, serves as a trusted haven for individuals in need of rehabilitation services, clinical care, and engaging nursing home activities during their golden years. This vibrant community maintains a welcoming culture, dedicated to delivering exceptional post-acute and skilled nursing care to seniors. It also takes pride in offering volunteer programs that contribute to a sense of community engagement.
In addition to its comprehensive services, the facility houses amenities like a computer station within the beauty shop. Further enhancing residents’ well-being, on-site podiatry, dental, and optometry services are readily available. Notably, the staff includes Spanish and Russian speakers, ensuring effective communication for residents who speak these languages. With a host of additional offerings, Signature Healthcare of Norfolk is committed to providing a supportive and enriching environment for its residents.
Offers a balance of services and community atmosphere.
Occupancy is moderate, suggesting balanced demand.
This home supports both short-term rehab and long-term care, with residents staying for a wide range of durations.
22% of new residents, usually for short-term rehab.
42% of new residents, often for short stays.
35% of new residents, often for long-term daily care.
Key information about the people who lead and staff this community.
In Virginia, the Department of Social Services (for assisted living facilities) and the Department of Health (for nursing homes) perform the inspections required to maintain state and federal licensing.
Deficiencies indicate regulatory issues. A higher number implies the facility had several areas requiring improvement.
Virginia average 4.2
Last Health inspection on Jul 2023
Virginia average 38.4
Virginia average 8.93
Health citations are formal notices following inspections when they fail to comply with safety and care standards.
42 of 47 citations resulted from standard inspections; and 5 of 47 came from combined inspections (standard and complaint).
Virginia average: 0.4
Virginia average: 1
Data sourced from CMS Health Deficiencies reports. Citation severity codes range from A (least serious) to L (most serious). Immediate Jeopardy (J-L) citations indicate situations where the facility's noncompliance has placed residents at risk of death or serious harm.
Nursing Home Licensed facility providing 24/7 skilled nursing care for residents with complex, ongoing medical needs. Staffed by RNs, LPNs, and CNAs. Inspected and star-rated annually by CMS. Accepts Medicare (short-term rehab) and Medicaid (long-term care).
Assisted Living A licensed, long-term care setting for seniors or individuals with disabilities who need help with daily activities — like bathing, dressing, and medication management — but not 24-hour skilled nursing. Offers housing, meals, and around-the-clock support while aiming to maximize resident independence.
![]() 1.9 miles from city center — 0.31 miles to nearest hospital (Sentara Norfolk General Hospital -Advanced Heart Failure)
1.9 miles from city center — 0.31 miles to nearest hospital (Sentara Norfolk General Hospital -Advanced Heart Failure)
![]() 1005 Hampton Blvd, Norfolk, VA 23507
1005 Hampton Blvd, Norfolk, VA 23507
Add your location
This data corresponds to Q2 2025 and is based on CMS Payroll-Based Journal.
Virginia average ratio: 1.67:1
Virginia average: 8 hours
Manages medical care and health needs.
This role is partially covered by contractors.
Assists with medical care and medications.
This role is partially covered by contractors.
Helps with daily care and mobility.
No contractors work on this role.
Total hours from contractors
2,273 contractor hours this quarter
| Certified Nursing Assistant | 84 | 0 | 84 | 26,748 | 91 | 100% | 7.6 |
| Licensed Practical Nurse | 39 | 18 | 57 | 10,852 | 91 | 100% | 7.8 |
| Registered Nurse | 10 | 5 | 15 | 3,501 | 91 | 100% | 8.2 |
| Clinical Nurse Specialist | 6 | 0 | 6 | 2,255 | 69 | 76% | 8.5 |
| Other Dietary Services Staff | 6 | 0 | 6 | 1,685 | 91 | 100% | 7.2 |
| RN Director of Nursing | 4 | 0 | 4 | 1,048 | 64 | 70% | 8.4 |
| Speech Language Pathologist | 2 | 0 | 2 | 875 | 65 | 71% | 7.2 |
| Physical Therapy Aide | 5 | 0 | 5 | 785 | 66 | 73% | 5.7 |
| Qualified Social Worker | 3 | 0 | 3 | 662 | 65 | 71% | 6.5 |
| Dietitian | 1 | 0 | 1 | 583 | 72 | 79% | 8.1 |
| Physical Therapy Assistant | 2 | 2 | 4 | 537 | 69 | 76% | 6.9 |
| Nurse Practitioner | 1 | 0 | 1 | 534 | 65 | 71% | 8.2 |
| Dental Services Staff | 1 | 0 | 1 | 522 | 65 | 71% | 8 |
| Administrator | 1 | 0 | 1 | 520 | 65 | 71% | 8 |
| Mental Health Service Worker | 1 | 0 | 1 | 486 | 62 | 68% | 7.8 |
| Respiratory Therapy Technician | 3 | 2 | 5 | 363 | 59 | 65% | 6 |
| Occupational Therapy Assistant | 0 | 1 | 1 | 47 | 6 | 7% | 7.8 |
Source: CMS Long-Term Care Facility Characteristics (Data as of Jan 2026)
Residents meet regularly to discuss policies, care quality, and activities
Organized group of residents that meets regularly to discuss facility policies, quality of life, and activities.
Data sourced from CMS Long-Term Care Facility Characteristics quarterly report. Payer mix reflects the current resident census by primary payment source.
These measures show how residents usually do over time at this home, based on health outcomes and preventive care.
Virginia average: 10.1
Virginia average: 19.7
Virginia average: 16.8%
Virginia average: 19.7%
Virginia average: 22.6%
Virginia average: 3.6%
Virginia average: 5.4%
Virginia average: 1.5%
Virginia average: 5.9%
Virginia average: 14.9%
Virginia average: 12.9%
Virginia average: 91.3%
Virginia average: 94.0%
Virginia average: 1.46
Virginia average: 1.41
Virginia average: 74.9%
Virginia average: 1.2%
Virginia average: 73.6%
Virginia average: 22.0%
Virginia average: 11.7%
Virginia average: 0.8%
Virginia average: 53.7%
Virginia average: 50.6%
Quality measures are calculated from Minimum Data Set (MDS) assessments. For most measures, lower percentages indicate better care quality.
Historical financial and operational data for Signature Healthcare of Norfolk based on CMS SNF Cost Reports.
Loading trend charts...
Care Cost Calculator: See Prices in Your Area
Nursing Home Data Explorer
Don’t Wait Too Long: 7 Red Flag Signs Your Parent Needs Assisted Living Now
The True Cost of Assisted Living in 2025 – And How Families Are Paying For It
Understanding Senior Living Costs: Pricing Models, Discounts & Financial Assistance

Touring a community? Use this expert-backed checklist to stay organized, ask the right questions, and find the perfect fit.
We'll send you a PDF version of the touring checklist.