Silver Springs Health Care Center

Nursing Home in Glendale

CMS overall rating Info The Overall CMS Rating is scored from 1 to 5 stars and combines results from health inspections, staffing levels, and quality measures. Health inspections carry the most weight. Staffing and quality scores can increase or decrease the final rating based on performance compared to state and national standards.
Calculator: See prices in your area
Silver Springs Health Care Center accepts Medicare, Medicaid, and private pay.

Overview of Silver Springs Health Care Center

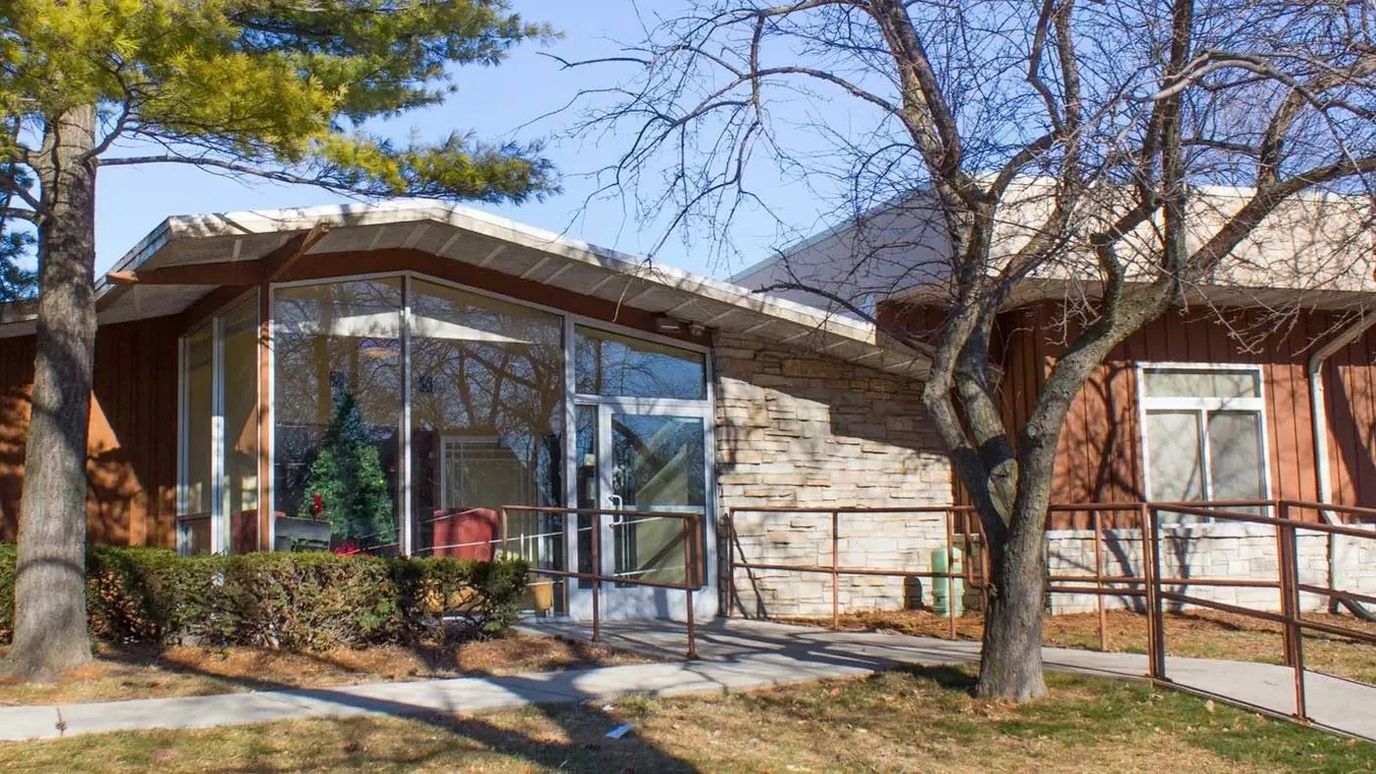
Located in Glendale, Wisconsin, Silver Springs Health Care Center boasts a dedicated clinical nursing team deeply committed to providing unparalleled support. With a capacity of 112 beds, this community caters to the needs of Milwaukee County residents, offering round-the-clock skilled nursing and specialized programs tailored for cardiac, pulmonary, and orthopedic care. They excel in addressing complex healthcare needs, ensuring holistic wellness and independence for every resident.

Silver Springs Health Care Center goes beyond the ordinary, offering specialized services such as memory care, postoperative care, and wound care, all delivered with utmost expertise. Their rehabilitative therapy programs are designed to facilitate a swift and safe return home, emphasizing their commitment to residents’ well-being. As an Alzheimer’s nursing home, they provide compassionate care for those with memory-related challenges, adhering to the highest nursing home qualifications, making them a trusted choice for families seeking comprehensive and dedicated support for their loved ones.

(414) 228-8120

Quality ratings

Measured by Centers for Medicare & Medicaid Services (CMS)

Overall rating Info The Overall CMS Rating combines results from health inspections, staffing levels and quality measures. Health inspections carry the most weight. Staffing and quality scores can increase or decrease the final rating based on performance compared to state and national standards.
1/5 ▼ 2.0 Wisconsin average: 3.0/5
Health Inspection Info Based on the results of the facility's three most recent standard inspections and any complaint investigations. CMS reviews the number, scope, and severity of deficiencies, with more recent findings weighted more heavily.
1/5 ▼ 1.8 Wisconsin average: 2.8/5
Staffing Info Measures average nursing staff hours per resident per day, including Registered Nurses (RNs) and total nursing staff. Ratings are adjusted based on the level of care residents require and are compared to state and national benchmarks.
1/5 ▼ 2.6 Wisconsin average: 3.6/5
Quality Measures Info Based on clinical and physical health indicators reported to CMS, such as hospital readmissions, falls, pressure ulcers, and improvements in mobility. These measures reflect how well residents' health needs are being managed.
2/5 ▼ 1.1 Wisconsin average: 3.1/5

Staffing hours breakdown

Info Daily nursing hours per resident by staff type, reported to CMS. Higher is generally better — compare this facility to state and national averages to see where staffing stands.

Hours per resident per day — compared to Wisconsin state averages

Total nursing care / resident Info This home is ranked 136th out of 167 homes in Wisconsin.

Total adjusted nursing hours per resident per day, combining RN, LPN, and aide time. CMS adjusts this for case-mix so facilities can be fairly compared.
3h 11m per day
Rank #136 / 167Nurse hours — state benchmarkedThis home is ranked 136th out of 167 homes in Wisconsin.Shows adjusted nurse hours per resident per day benchmarked to the Wisconsin average, with a ranking across 167 Wisconsin SNFs. More hours mean more direct care. The national average is about 3.5 hrs; below 3.0 is a red flag.
This facility Wisconsin avg (4h 17m per day)
vs Wisconsin avg
-25%

4 of 5 metrics below state avg

Standout metric LPN / LVN is +29% above state avg
Staff typeHours / dayvs state avg
Registered Nurse (RN) Info RNs hold the highest nursing license and can assess residents, interpret test results, and direct care plans. More RN hours per day often signals stronger clinical oversight and faster response to health changes. 20m per day ▼ 66% State avg: 58m per day · National avg: 41m per day
LPN / LVN Info Licensed Practical Nurses (LPNs) or Licensed Vocational Nurses (LVNs) deliver routine hands-on care — medication administration, wound dressing, and monitoring vital signs. They work under RN supervision and make up a large share of daily bedside care. 49m per day ▲ 29% State avg: 38m per day · National avg: 52m per day
Nurse Aide Info Certified Nurse Aides (CNAs) provide the most direct day-to-day assistance: bathing, dressing, feeding, and mobility. Nurse aide hours are typically the largest staffing category and directly affect residents' quality of life. 2h 15m per day ▼ 13% State avg: 2h 35m per day · National avg: 2h 21m per day
Total Nursing (Weekend) Info Combined nursing hours (RN + LPN + Nurse Aide) per resident per day on weekends. Staffing often drops on weekends — this figure reveals whether the facility maintains adequate coverage outside of weekday hours. 2h 29m per day ▼ 33% State avg: 3h 43m per day · National avg: 3h 26m per day
RN (Weekend) Info Registered nurse hours specifically on weekends. Facilities sometimes reduce RN presence on Saturdays and Sundays — a low weekend RN figure compared to weekday hours can indicate reduced clinical oversight when most administrative staff are absent. 15m per day ▼ 62% State avg: 39m per day · National avg: 29m per day

Capacity and availability

This home usually has limited availability

Occupancy between 85% and 95% suggests balanced demand.

Higher occupancy than the Wisconsin average: 70%
Occupancy rate 91.2% Rank #9 / 170Occupancy rate — state benchmarkedThis home is ranked 9th out of 170 homes in Wisconsin.Shows this facility's occupancy rate versus the Wisconsin average, with its statewide rank out of 170. Higher occupancy signals strong local demand and financial stability.
Avg. Length of Stay 106 days
Occupancy rate
91.2% Rank #9 / 170Occupancy rate — state benchmarkedThis home is ranked 9th out of 170 homes in Wisconsin.Shows this facility's occupancy rate versus the Wisconsin average, with its statewide rank out of 170. Higher occupancy signals strong local demand and financial stability.
Avg. Length of Stay
106 days

Who this home usually serves

TYPE OF STAY

Mix of rehab and long-term care

This home supports both short-term rehab and long-term care, with residents staying for a wide range of durations.

Breakdown by payment type

Medicare

31% of new residents, usually for short-term rehab.

Typical stay 29 days

Private pay

56% of new residents, often for short stays.

Typical stay 2 - 3 months

Medicaid

13% of new residents, often for long-term daily care.

Typical stay 1 years

Finances and operations

Privately-owned community
Operated by a business corporation.
Home revenue
$13.6M
Profit
$503.9K
Privately-owned community Operated by a business corporation.
Home revenue
$13.6M Rank #29 / 170Revenue — state benchmarkedThis home is ranked 29th out of 170 homes in Wisconsin.Shows this facility's annual revenue compared to the Wisconsin SNF average. Higher revenue generally means more resources for staffing and capital — read alongside Payroll %.
Profit
$503.9K
Payroll costs Info The portion of the home's budget spent on staff, including nurses, caregivers, and other employees who support care and operations. Rank #61 / 170Payroll — state benchmarkedThis home is ranked 61st out of 170 homes in Wisconsin.Shows total annual staff payroll benchmarked to the Wisconsin average. Higher payroll investment relative to peers often signals better staffing and less reliance on cheaper contract labor.
$4.2M
31.3% of revenue Rank #149 / 170Payroll % — state benchmarkedThis home is ranked 149th out of 170 homes in Wisconsin.Shows payroll as a percentage of revenue versus the Wisconsin average. Well-run SNFs often land around 55–65%. Below 25% may signal understaffing or heavy agency use — read with Staffing ratings.
Other operating costs Info All remaining costs needed to run the home, such as food, utilities, building maintenance, supplies and administrative expenses.
$8.8M
Total costs $13.1M
Walk Score
Walk Score: 41 / 100 Rank #26 / 57Walk Score — state benchmarkedThis home is ranked 26th out of 57 homes in Wisconsin.Shows how walkable this facility's neighborhood is compared to the average Walk Score across Wisconsin SNFs. Higher scores benefit residents, families, and staff.
Somewhat walkable. A few nearby services may be reachable on foot, but most trips require transportation.

About this community

Payment & Insurance

2 services
Accept Medicaid
Accept Medicare

Therapy & Rehabilitation

3 services
Rehabilitation Services
Respite Care
Short-Term Rehab

Staffing & Medical

1 service
24-Hour Staffing

Additional Services

3 services
Dementia Care
Wound Care
Hospice Palliative Care

Amenities & Lifestyle

Specific ProgramsLong Term Care
Operating Hours24/7

Types of Care at Silver Springs Health Care Center

Skilled Nursing Memory Care

Contact Silver Springs Health Care Center

Health Inspection History

Inspections
Total health inspections 14

Wisconsin average 6


Last Health inspection on Sep 2025

Total health citations
143 Rank #169 / 169Health citations — state benchmarkedThis home is ranked 169th out of 169 homes in Wisconsin.Shows this facility's total health deficiency citations benchmarked to the Wisconsin state average, with a ranking across all 169 WI SNFs. Lower citation counts earn a better rank.

Wisconsin average 27.3

Citations per inspection
10.21 Rank #168 / 169Citations per inspection — state benchmarkedThis home is ranked 168th out of 169 homes in Wisconsin.Shows average deficiency citations per CMS inspection for this facility versus the Wisconsin mean across 169 SNFs with citation data. Lower is better.

Wisconsin average 4.19


Health citations are formal notices following inspections when they fail to comply with safety and care standards.

49 of 143 citations resulted from standard inspections; 69 of 143 resulted from complaint investigations; and 25 of 143 came from combined inspections (standard and complaint).

Breakdown of citation severity (last 3 years)
Critical Health citations More info
9
900% worse than Wisconsin average

Wisconsin average: 0.9


Serious Health citations More info 7
483% worse than Wisconsin average

Wisconsin average: 1.2

9 critical citations More info Wisconsin average: 0.9

7 serious citations More info Wisconsin average: 1.2

124 moderate citations More info Wisconsin average: 24.7

3 minor citations More info Wisconsin average: 0.6
Citations history (last 3 years)
Abuse/Neglect moderate citation Info Issues related to protecting resident's from harm, including abuse, neglect, or mistreatment. Sep 30, 2025
Corrected

Abuse/Neglect moderate citation Info Issues related to protecting resident's from harm, including abuse, neglect, or mistreatment. Sep 30, 2025
Corrected

Abuse/Neglect moderate citation Info Issues related to protecting resident's from harm, including abuse, neglect, or mistreatment. Sep 30, 2025
Corrected

Administration critical citation Info Issues related to how the facility is managed, including policies, procedures, and compliance with regulations. Sep 30, 2025
Corrected

Financial Assistance for
Nursing Home in Wisconsin

Silver Springs Health Care Center is located in Glendale, Wisconsin.
Here are the financial assistance programs available to residents in Wisconsin.

Get Financial aid guidance

Family Care Program

WI Medicaid Family Care

Age 65+ or disabled
General Wisconsin resident, Medicaid-eligible, long-term care need.
Income Limits (2025) ~$2,829/month 300% FBR, individual
Asset Limits $2,000 (individual), $3,000 (couple).
WI

Managed care model; rural/urban balance.

Benefits
Personal care (5-7 hours/day) Respite (240 hours/year) Adult day care ($65/day) Home modifications ($1,500 avg.)

Wisconsin Caregiver Support Program

WI NFCSP Respite

Age Caregiver of someone 60+ (or with dementia)
General Wisconsin resident.
Income Limits No strict limit; prioritizes low-income.
Asset Limits Not applicable.
WI

High rural demand; ADRC coordination.

Benefits
In-home respite (4-6 hours/day) Adult day care (~$65/day) Short-term facility care (up to 5 days)

IRIS (Include, Respect, I Self-Direct)

Wisconsin IRIS

Age 65+ (or disabled 18+)
General WI resident, Medicaid-eligible, NFLOC.
Income Limits (2025) ~$2,829/month; QIT optional.
Asset Limits $2,000 (individual), $3,000 (couple).
WI

Flexible budget; serves ~20,000; participant hires caregivers.

Benefits
Personal care (custom hours) Respite Home mods Equipment Transportation Support services

SeniorCare Prescription Drug Assistance

Wisconsin SeniorCare

Age 65+
General WI resident, US citizen/qualified immigrant, not on full Medicaid.
Income Limits (2025) ~$24,980-$34,980/year (Level 1-2B, individual); varies by level.
Asset Limits None.
WI

Four benefit levels; serves ~50,000 annually.

Benefits
$5 generic/$15 brand copays (Level 1); deductibles ($500-$850) for higher levels; covers most Rx drugs

Medicare Savings Program (MSP)

Wisconsin Medicare Savings Program

Age 65+ or disabled
General WI resident, Medicare Part A/B.
Income Limits (2025) ~$2,510/month (QMB), ~$3,380/month (SLMB), ~$3,598/month (QI)—individual.
Asset Limits $9,430 (individual), $14,130 (couple).
WI

Includes Extra Help for Part D; no waitlist.

Benefits
Covers Part B premiums ($174.70/month) Deductibles ($240/year) Copays (~20%)

Wisconsin Home Energy Assistance Program (WHEAP)

Wisconsin WHEAP

Age 60+ prioritized
General WI resident, low-income household.
Income Limits (2025) ~$3,970/month 185% FPL
Asset Limits Not assessed.
WI

Covers gas, electric, wood; crisis aid available.

Benefits
Heating/electric aid ($300-$1,000/season) Crisis aid ($500 max) Weatherization

Senior Community Service Employment Program (SCSEP)

Wisconsin SCSEP

Age 55+
General unemployed, low-income, WI resident.
Income Limits (2025) ~$1,983/month 125% FPL
Asset Limits Not specified.
WI

Priority for veterans, rural residents; Goodwill/AARP partnership.

Benefits
Paid training (~20 hours/week at ~$7.25/hour) Job placement

VA Aid and Attendance (A&A) and Housebound Benefits

Wisconsin VA Aid and Attendance/Housebound

Age 65+ or disabled veteran/spouse
General WI resident, wartime service, ADL help (A&A) or homebound.
Income Limits (2025) Net income < ~$1,984/month (veteran with dependent, A&A); pension offsets income.
Asset Limits ~$155,356 net worth
WI

High rural veteran use; supports care costs.

Benefits
Cash (~$1,433-$2,642/month veteran, ~$951-$1,318 spouse) for care costs

Property Tax Deferral Loan Program

Wisconsin Property Tax Deferral Loan

Age 65+
General WI resident, homeowner, live in home 6+ months/year.
Income Limits (2025) ~$24,980/year household
Asset Limits Home equity < $500,000; limited other assets.
WI

Saves ~$500-$1,500/year; interest ~2%-3%.

Benefits
Deferred tax payment (~$500-$1,500/year avg.)

Senior Farmers’ Market Nutrition Program (SFMNP)

Wisconsin SFMNP

Age 60+
General WI resident, low-income.
Income Limits (2025) ~$2,322/month 185% FPL
Asset Limits Not assessed.
WI

Vouchers (~$45/season); serves ~15,000 annually.

Benefits
Vouchers (~$45/season) for produce at farmers’ markets

Places of interest near Silver Springs Health Care Center

Address 1.7 miles from city center Info Estimated distance in miles from Glendale's city center to Silver Springs Health Care Center's address, calculated via Google Maps. — 3.98 miles to nearest hospital (Ascension SE Wisconsin Hospital - St. Joseph)

Calculate Travel Distance to Silver Springs Health Care Center

Add your location

Address

Staffing Data (Q2 2025)

This data corresponds to Q2 2025 and is based on CMS Payroll-Based Journal.

Total staff 108
Employees 101
Contractors 7
Staff to resident ratio 1.09:1
55% worse than Wisconsin average

Wisconsin average ratio: 2.41:1

Avg staff/day 38
Average shift 7.5 hours
0% compared with Wisconsin average

Wisconsin average: 7.3 hours

Total staff hours (quarter) 25,936
Nursing staff breakdown
Registered Nurse

Manages medical care and health needs.

Total count 8
Average shift length Info Average shift length. Calculated as total hours divided by days worked and average staff per day. 8.9 hours

No contractors work on this role.

Licensed Practical Nurse

Assists with medical care and medications.

Total count 18
Average shift length Info Average shift length. Calculated as total hours divided by days worked and average staff per day. 7.7 hours

No contractors work on this role.

Certified Nursing Assistant

Helps with daily care and mobility.

Total count 58
Average shift length Info Average shift length. Calculated as total hours divided by days worked and average staff per day. 7.1 hours

This role is partially covered by contractors.

Contractor staffing

Total hours from contractors

2.5%

653 contractor hours this quarter

Occupational Therapy Aide: 2 Certified Nursing Assistant: 1 Other Dietary Services Staff: 1 Occupational Therapy Assistant: 1 Nurse Practitioner: 1 Medical Director: 1
Staff by category
Certified Nursing Assistant5715812,99291100%7.1
Licensed Practical Nurse180183,65891100%7.7
Registered Nurse8082,54391100%8.9
RN Director of Nursing4041,8616875%8.6
Other Dietary Services Staff4151,2789099%6.9
Medication Aide/Technician5051,1027481%8.6
Nurse Practitioner0115206571%8
Administrator1015126470%8
Mental Health Service Worker1015126470%8
Dental Services Staff1014806066%8
Clinical Nurse Specialist2023516673%5.3
Occupational Therapy Aide022671011%6.7
Occupational Therapy Assistant01137910%4.1
Medical Director0112567%4.1
58 Certified Nursing Assistant
% of Days 100%
18 Licensed Practical Nurse
% of Days 100%
8 Registered Nurse
% of Days 100%
4 RN Director of Nursing
% of Days 75%
5 Other Dietary Services Staff
% of Days 99%
5 Medication Aide/Technician
% of Days 81%
1 Nurse Practitioner
% of Days 71%
1 Administrator
% of Days 70%
1 Mental Health Service Worker
% of Days 70%
1 Dental Services Staff
% of Days 66%
2 Clinical Nurse Specialist
% of Days 73%
2 Occupational Therapy Aide
% of Days 11%
1 Occupational Therapy Assistant
% of Days 10%
1 Medical Director
% of Days 7%

Facility Characteristics

Source: CMS Long-Term Care Facility Characteristics (Data as of Jan 2026)

Total residents 99
Medicare
7
7.1% of residents
Medicaid
31
31.3% of residents
Private pay or other
61
61.6% of residents
Programs & Services
Residents Group

Residents meet regularly to discuss policies, care quality, and activities

Active Resident Council

Organized group of residents that meets regularly to discuss facility policies, quality of life, and activities.

Quality of care over time

These measures show how residents usually do over time at this home, based on health outcomes and preventive care.

High-risk clinical events score Info A composite score based on pressure ulcers, falls with injury, weight loss, walking ability decline, and activities of daily living decline. 8.0
24% better than Wisconsin average

Wisconsin average: 10.5

Functional decline score Info A composite score based on activities of daily living decline, walking ability decline, and incontinence. 13.9
37% better than Wisconsin average

Wisconsin average: 22.1

Long-stay resident measures
Below average Wisconsin avg: 3.0 Info CMS star rating based on long-stay quality measure performance. 5 stars = significantly above average, 1 star = significantly below average.
Need for Help with Daily Activities Increased Info Percent of long-stay residents whose need for help with daily activities has increased 13.2%
25% better than Wisconsin average

Wisconsin average: 17.6%

Walking Ability Worsened Info Percent of long-stay residents whose ability to move independently worsened 7.3%
68% better than Wisconsin average

Wisconsin average: 22.8%

Low Risk Residents with Bowel/Bladder Incontinence Info Percent of low risk long-stay residents who lose control of their bowels or bladder 21.3%
18% better than Wisconsin average

Wisconsin average: 26.0%

Falls with Major Injury Info Percent of long-stay residents experiencing one or more falls with major injury 3.5%
9% worse than Wisconsin average

Wisconsin average: 3.2%

High Risk Residents with Pressure Ulcers Info Percent of long-stay high risk residents with pressure ulcers 8.1%
48% worse than Wisconsin average

Wisconsin average: 5.4%

Urinary Tract Infection Info Percent of long-stay residents with a urinary tract infection 1.2%
63% better than Wisconsin average

Wisconsin average: 3.2%

Lost Too Much Weight Info Percent of long-stay residents who lose too much weight 7.7%
59% worse than Wisconsin average

Wisconsin average: 4.9%

Depressive Symptoms Info Percent of long-stay residents who have depressive symptoms 0.7%
87% better than Wisconsin average

Wisconsin average: 5.0%

Antipsychotic Use Info Percent of long-stay residents who received an antipsychotic medication 21.7%
35% worse than Wisconsin average

Wisconsin average: 16.1%

Pneumococcal Vaccine Info Percent of long-stay residents assessed and appropriately given the pneumococcal vaccine 77.0%
20% worse than Wisconsin average

Wisconsin average: 95.9%

Influenza Vaccine Info Percent of long-stay residents assessed and appropriately given the seasonal influenza vaccine 73.0%
23% worse than Wisconsin average

Wisconsin average: 95.0%

Hospitalizations per 1,000 days Info Number of hospitalizations per 1,000 long-stay resident days. 3.70
130% worse than Wisconsin average

Wisconsin average: 1.61

ED visits per 1,000 days Info Number of outpatient emergency department visits per 1,000 long-stay resident days. 2.81
28% worse than Wisconsin average

Wisconsin average: 2.19

Short-stay resident measures
Pneumococcal Vaccine Info Percent of short-stay residents assessed and appropriately given the pneumococcal vaccine 35.3%
60% worse than Wisconsin average

Wisconsin average: 87.3%

Antipsychotic medication increase Info Percent of short-stay residents who newly received an antipsychotic medication 1.1%
10% better than Wisconsin average

Wisconsin average: 1.2%

Influenza Vaccine Info Percent of short-stay residents assessed and appropriately given the seasonal influenza vaccine 18.0%
78% worse than Wisconsin average

Wisconsin average: 82.2%

Falls with major injury Info Percentage of SNF residents who experience falls with major injury during their stay. 5.9%
664% worse than Wisconsin average

Wisconsin average: 0.8%

Successful return to home or community Info Rate of successful return to home or community from a skilled nursing facility. 36.8%
27% worse than Wisconsin average

Wisconsin average: 50.6%

Penalties and fines

Federal penalties imposed by CMS for regulatory violations, including civil money penalties (fines) and denials of payment for new Medicare/Medicaid admissions.

Source: CMS Penalties Database (Data as of Jan 2026)

Total fines amount $178K
87% higher than Wisconsin average

Wisconsin average: $95K

Number of fines 1
52% fewer fines than Wisconsin average

Wisconsin average: 2.1

Payment Denials Info Serious action where Medicare and/or Medicaid temporarily stops payments for new residents until issues are fixed. 2
202% more payment denials than Wisconsin average

Wisconsin average: 0.7

Fines amount comparison
This facility $178K
Wisconsin average $95K
Penalty History

Penalties are imposed by CMS for violations of federal nursing home regulations.

1 penalty in the past 3 years

Oct 30, 2024 · 36 days

Payment Denial Info Serious action where Medicare and/or Medicaid temporarily stops payments for new residents until issues are fixed. Oct 30, 2024
36 days

Last updated: Jan 2026

Compare Nursing Homes around Glendale The information below is reported by the Wisconsin Department of Health Services, Division of Quality Assurance.

Filter by care type
Silver Springs Health Care Center
AL

Assisted Living A licensed, long-term care setting for seniors or individuals with disabilities who need help with daily activities — like bathing, dressing, and medication management — but not 24-hour skilled nursing. Offers housing, meals, and around-the-clock support while aiming to maximize resident independence.

MC

Memory Care Secured, specialized care for people living with Alzheimer's or dementia. Staff trained in cognitive impairment, with higher staff-to-resident ratios and an environment designed to reduce confusion and wandering risk.

NH

Nursing Home Licensed facility providing 24/7 skilled nursing care for residents with complex, ongoing medical needs. Staffed by RNs, LPNs, and CNAs. Inspected and star-rated annually by CMS. Accepts Medicare (short-term rehab) and Medicaid (long-term care).

Glendale (West Silver Spring Drive) -112 41-

Guides for Better Senior Living

Care Cost Calculator: See Prices in Your Area

Nursing Home Data Explorer

Don’t Wait Too Long: 7 Red Flag Signs Your Parent Needs Assisted Living Now

The True Cost of Assisted Living in 2025 – And How Families Are Paying For It

Understanding Senior Living Costs: Pricing Models, Discounts & Financial Assistance

Explore Open Rooms
1 Contact details
2 What type of senior care service are you looking for?
3 What budget do you have in mind for senior care?
4 How soon do you need to find care?
5 Additional details

Thank you for your interest!

Our team will be in touch shortly to help with next steps.