Skyline
Nursing Home, Assisted Living, Independent Living & Memory Care · Seattle, WA
CMS overall rating Info CMS (the Centers for Medicare & Medicaid Services) is the federal agency that rates nursing home quality. Its Overall Rating runs from 1 to 5 stars, combining health inspections, staffing, and quality measures, with inspections weighted most heavily.

Skyline

Nursing Home, Assisted Living, Independent Living & Memory Care · Seattle, WA
CMS overall rating Info CMS (the Centers for Medicare & Medicaid Services) is the federal agency that rates nursing home quality. Its Overall Rating runs from 1 to 5 stars, combining health inspections, staffing, and quality measures, with inspections weighted most heavily.
Calculator: See prices in your area
Skyline accepts Medicare and private pay.

Overview of Skyline

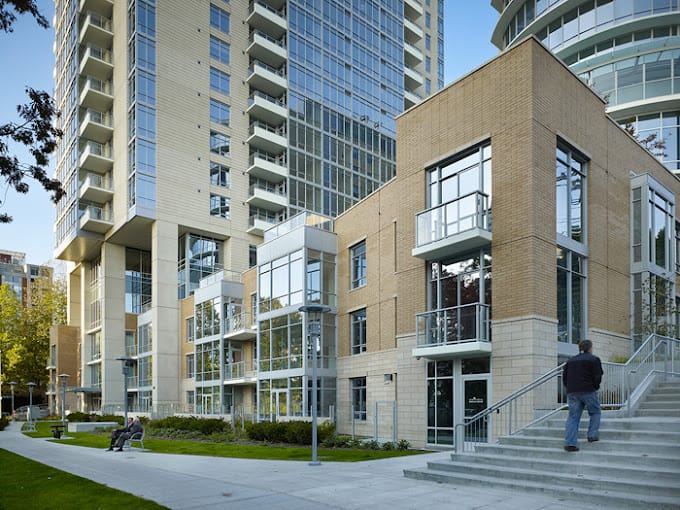
Downtown Seattle’s Skyline operates as a Life Care continuum community at 725 9th Avenue, 0.4 miles from the city center, offering nursing home, independent living, assisted living, and memory care under Presbyterian Retirement Communities Northwest (nonprofit).

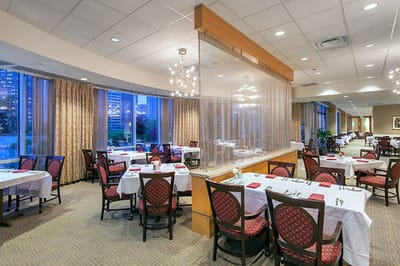
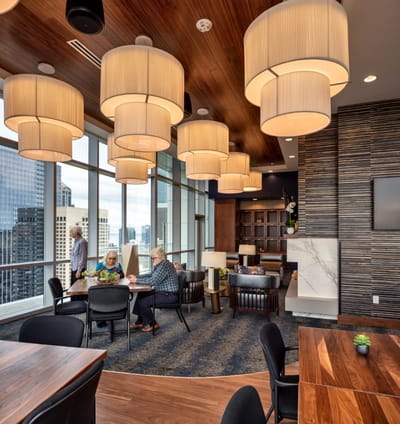
The facility emphasizes resort-style amenities: 360-degree Skyline and Puget Sound views, gourmet dining, fitness center, saline lap pool, holistic wellness programs, and activities spanning intellectual pursuits to wine tastings. Average length of stay is 42 days; occupancy 79.3% (above Washington average of 72.5%). Walk Score 98 (Walker’s Paradise; ranked 7 of 628 statewide).

Skyline employs 107 staff (39 employees, 68 contractors, Q3 2025). Total nursing care: 5h 15m per resident daily (24% above Washington average; ranked 6 of 89 SNFs). Weekend nursing: 5h 1m per resident daily (31% above state average). Staff-to-resident ratio: 4.12:1 (121% better than Washington average 1.86:1). Registered Nurses: 18; Licensed Practical Nurses: 17; Certified Nursing Assistants: 44; supplemented by physical therapy, occupational therapy, respiratory therapy, speech pathology, and physician support.

Overall CMS rating: 3 stars (7% below Washington average). Health Inspection: 3 stars (29% below state average). Staffing: 4 stars (16.8% above state average). Quality Measures: 4 stars (27.2% above state average). No penalties in 3 years.

Long-stay resident successes: Falls with major injury 1.5% (42% better than state average); urinary tract infections 0.0% (100% better); depressive symptoms 2.0% (88% better); pneumococcal vaccination 100%.

Critical concerns: High-risk residents with pressure ulcers 16.6% versus 4.9% state average (237% worse). Weight loss 23.0% versus 5.8% state average (295% worse). High-risk clinical events score 14.7 versus 10.0 state average (47% worse).

Accepts medicare and private pay. No Medicaid.

No penalties or fines past 3 years.

Skyline serves Medicare and private-pay patients in a staffing-rich urban life care setting with strong nursing ratios and administrative compliance but concerning pressure ulcer and weight loss outcomes despite high staffing levels.

Quality ratings

Measured by Centers for Medicare & Medicaid Services (CMS)

Overall rating Info The Overall CMS Rating combines results from health inspections, staffing levels and quality measures. Health inspections carry the most weight. Staffing and quality scores can increase or decrease the final rating based on performance compared to state and national standards.
▼ 69.0% Below WA avg. ▼ 69.0% Below WA avg.WA average: 3.2Click the badge to see the full State ranking.Click here to see the full State ranking.
Health Inspection Info Based on the results of the facility's three most recent standard inspections and any complaint investigations. CMS reviews the number, scope, and severity of deficiencies, with more recent findings weighted more heavily.
▼ 29.0% Below WA avg. ▼ 29.0% Below WA avg.WA average: 2.8Click the badge to see the full State ranking.Click here to see the full State ranking.
Staffing Info Measures average nursing staff hours per resident per day, including Registered Nurses (RNs) and total nursing staff. Ratings are adjusted based on the level of care residents require and are compared to state and national benchmarks.
▼ 70.8% Below WA avg. ▼ 70.8% Below WA avg.WA average: 3.4Click the badge to see the full State ranking.Click here to see the full State ranking.
Quality Measures Info Based on clinical and physical health indicators reported to CMS, such as hospital readmissions, falls, pressure ulcers, and improvements in mobility. These measures reflect how well residents' health needs are being managed.
▲ 1.7% Above WA avg. ▲ 1.7% Above WA avg.WA average: 3.9Click the badge to see the full State ranking.Click here to see the full State ranking.

Staffing hours breakdown

Info Daily nursing hours per resident by staff type, reported to CMS. Higher is generally better — compare this facility to state and national averages to see where staffing stands.

Hours per resident per day — compared to Washington state averages

Total nursing care / resident Info This home is ranked 6th out of 90 homes in Washington for nurse hours. Total adjusted nursing hours per resident per day, combining RN, LPN, and aide time. CMS adjusts this for case-mix so facilities can be fairly compared.
5h 15m per day
Rank #6 / 90Nurse hours — State benchmarkedThis home is ranked 6th out of 90 homes in Washington. Shows adjusted nurse hours per resident per day benchmarked to the Washington average, with a ranking across 90 Washington facilities. More hours mean more direct care. The national average is about 3.5 hrs; below 3.0 is a red flag.Rankings are based only on facilities in Washington that report data for that category. Facilities without available data are excluded from the ranking.Click the rank badge to see the full State ranking.Click here to see the full State ranking.
This facility Washington avg (4h 13m per day)
vs Washington avg
+24%

0 of 1 metrics below state avg

Standout metric Weekend Total Nursing is +27% above state avg
Staff typeHours / Day / Residentvs state avg
Weekend Total Nursing Info Combined nursing hours (RN + LPN + Nurse Aide) per resident per day on weekends. Staffing often drops on weekends — this figure reveals whether the facility maintains adequate coverage outside of weekday hours. 5h 1m per day ▲ 27% State avg: 3h 57m per day · National avg: 3h 27m per day

Capacity and availability

This home usually has availability

Higher occupancy than the Washington average: 72.5%
Occupancy rate
79.3% Rank #124 / 310Occupancy rate — State benchmarkedThis home is ranked 124th out of 310 homes in Washington. Shows this facility's occupancy rate versus the Washington average, with its Statewide rank out of 310. Higher occupancy signals strong local demand and financial stability.Rankings are based only on facilities in Washington that report data for that category. Facilities without available data are excluded from the ranking.Click the rank badge to see the full State ranking.Click here to see the full State ranking.
Avg. Length of Stay
42 days
Bed community size
34-bed community Rank #343 / 366Bed count — State benchmarkedThis home is ranked 343rd out of 366 homes in Washington. Shows this facility's certified or reported bed count compared to other Washington facilities. Larger communities may offer more amenities, programs, and on-site services for residents and families.Rankings are based only on facilities in Washington that report data for that category. Facilities without available data are excluded from the ranking.Click the rank badge to see the full State ranking.Click here to see the full State ranking.
A moderately sized community that may balance personal attention with shared amenities and social activities.
Walk Score
Walk Score: 98 / 100 Rank #7 / 628Walk Score — State benchmarkedThis home is ranked 7th out of 628 homes in Washington. Shows how walkable this facility's neighborhood is compared to the average Walk Score across Washington facilities. Higher scores benefit residents, families, and staff.Rankings are based only on facilities in Washington that report data for that category. Facilities without available data are excluded from the ranking.Click the rank badge to see the full State ranking.Click here to see the full State ranking.
Walker's paradise. Daily errands do not require a car, with many shops and services nearby.

Contact Skyline

Staffing Data

Reporting period: July 1 – September 30, 2025 (Q3 2025). Source: CMS Payroll-Based Journal report.

Total staff 107
Employees 39
Contractors 68
Staff to resident ratio 4.12 : 1
121% more staff per resident than Washington average
Washington average ratio: 1.86 : 1 Washington average ratio: 1.86 : 1See full Washington ranking
Avg staff/day 26
Average shift 7.6 hours
6% worse than Washington average
Washington average: 8.1 hours Washington average shift: 8.1 hoursSee full Washington ranking
Total staff hours (quarter) 18,274

Nursing staff breakdown

Q3 2025 · Jul 1 – Sep 30 More info This data comes from the CMS Payroll-Based Journal report covering July 1 – September 30, 2025.
Registered Nurse

Manages medical care and health needs.

RN Staff Info 18 total: 6 full-time employees and 12 contractors. 18
Average shift length Info Average shift length. Calculated as total hours divided by days worked and average staff per day. 8.1 hours
Licensed Practical Nurse

Assists with medical care and medications.

LPN Staff Info 17 total: 5 full-time employees and 12 contractors. 17
Average shift length Info Average shift length. Calculated as total hours divided by days worked and average staff per day. 8.4 hours
Certified Nursing Assistant

Helps with daily care and mobility.

CNA Staff Info 44 total: 21 full-time employees and 23 contractors. 44
Average shift length Info Average shift length. Calculated as total hours divided by days worked and average staff per day. 7.5 hours

Contractor staffing

Q3 2025 · Jul 1 – Sep 30 More info This data comes from the CMS Payroll-Based Journal report covering July 1 – September 30, 2025.

Total hours from contractors

19.1%

3,484 contractor hours this quarter

Certified Nursing Assistant: 23 Licensed Practical Nurse: 12 Registered Nurse: 12 Respiratory Therapy Technician: 7 Physical Therapy Assistant: 4 Physical Therapy Aide: 2 Qualified Social Worker: 2 Physician Assistant: 2 Occupational Therapy Aide: 1 Other Physician: 1 Speech Language Pathologist: 1 Feeding Assistant: 1

Staff by category

Q3 2025 · Jul 1 – Sep 30 More info This data comes from the CMS Payroll-Based Journal report covering July 1 – September 30, 2025.
Certified Nursing Assistant2123448,24692100%7.5
Licensed Practical Nurse512172,95492100%8.4
Registered Nurse612181,96692100%8.1
Nurse Aide in Training1018098896%9.2
Administrator3035766267%8
Mental Health Service Worker1015486874%8.1
Nurse Practitioner1015046368%8
Dietitian1014966267%8
Physical Therapy Assistant0444316166%6.9
Physical Therapy Aide0224135560%7.4
Respiratory Therapy Technician0773676267%4.8
Speech Language Pathologist0113636470%5.7
Other Physician0112952830%10.5
Physician Assistant0221672426%6.7
Occupational Therapy Aide011932123%4.4
Qualified Social Worker022402426%1.7
Feeding Assistant011611%6
44 Certified Nursing Assistant
% of Days 100%
17 Licensed Practical Nurse
% of Days 100%
18 Registered Nurse
% of Days 100%
1 Nurse Aide in Training
% of Days 96%
3 Administrator
% of Days 67%
1 Mental Health Service Worker
% of Days 74%
1 Nurse Practitioner
% of Days 68%
1 Dietitian
% of Days 67%
4 Physical Therapy Assistant
% of Days 66%
2 Physical Therapy Aide
% of Days 60%
7 Respiratory Therapy Technician
% of Days 67%
1 Speech Language Pathologist
% of Days 70%
1 Other Physician
% of Days 30%
2 Physician Assistant
% of Days 26%
1 Occupational Therapy Aide
% of Days 23%
2 Qualified Social Worker
% of Days 26%
1 Feeding Assistant
% of Days 1%

Penalties and fines

Federal penalties imposed by CMS for regulatory violations, including civil money penalties (fines) and denials of payment for new Medicare/Medicaid admissions.

Source: CMS Penalties Database

No penalties in the past 3 years

No civil money penalties or payment denials were reported in the last 3 years.

Quality of care over time

These measures show how residents usually do over time at this home, based on health outcomes and preventive care.

High-risk clinical events score Info A composite score based on pressure ulcers, falls with injury, weight loss, walking ability decline, and activities of daily living decline. 14.7
47% worse than Washington average

Washington average: 10.0

Functional decline score Info A composite score based on activities of daily living decline, walking ability decline, and incontinence. 21.3
In line with Washington average

Washington average: 20.9

Long-stay resident measures
Need for Help with Daily Activities Increased Info Percent of long-stay residents whose need for help with daily activities has increased 17.8%
8% worse than Washington average

Washington average: 16.4%

Low Risk Residents with Bowel/Bladder Incontinence Info Percent of low risk long-stay residents who lose control of their bowels or bladder 24.8%
In line with Washington average

Washington average: 24.3%

Falls with Major Injury Info Percent of long-stay residents experiencing one or more falls with major injury 1.5%
42% better than Washington average

Washington average: 2.6%

High Risk Residents with Pressure Ulcers Info Percent of long-stay high risk residents with pressure ulcers 16.6%
237% worse than Washington average

Washington average: 4.9%

Urinary Tract Infection Info Percent of long-stay residents with a urinary tract infection 0.0%
100% better than Washington average

Washington average: 1.7%

Lost Too Much Weight Info Percent of long-stay residents who lose too much weight 23.0%
295% worse than Washington average

Washington average: 5.8%

Depressive Symptoms Info Percent of long-stay residents who have depressive symptoms 2.0%
88% better than Washington average

Washington average: 16.2%

Antipsychotic Use Info Percent of long-stay residents who received an antipsychotic medication 10.6%
27% better than Washington average

Washington average: 14.5%

Pneumococcal Vaccine Info Percent of long-stay residents assessed and appropriately given the pneumococcal vaccine 100.0%
In line with Washington average

Washington average: 96.2%

Influenza Vaccine Info Percent of long-stay residents assessed and appropriately given the seasonal influenza vaccine 95.2%
In line with Washington average

Washington average: 93.8%

Short-stay resident measures
Pneumococcal Vaccine Info Percent of short-stay residents assessed and appropriately given the pneumococcal vaccine 99.7%
13% better than Washington average

Washington average: 88.1%

Antipsychotic medication increase Info Percent of short-stay residents who newly received an antipsychotic medication 2.7%
89% worse than Washington average

Washington average: 1.4%

Influenza Vaccine Info Percent of short-stay residents assessed and appropriately given the seasonal influenza vaccine 98.7%
20% better than Washington average

Washington average: 82.0%

Breakdown by payment type

Medicare

54% of new residents, usually for short-term rehab.

Typical stay 25 days

Private pay

46% of new residents, often for short stays.

Typical stay 2 - 3 months

Facility Characteristics

Source: CMS Long-Term Care Facility Characteristics (Data as of Jan 2026)

Total residents 26
Medicare
15
57.7% of residents
Private pay or other
11
42.3% of residents
Programs & Services
Residents Group

Residents meet regularly to discuss policies, care quality, and activities

CCRC

Part of a Continuing Care Retirement Community offering multiple care levels

Active Resident Council

Organized group of residents that meets regularly to discuss facility policies, quality of life, and activities.

Finances and operations

Based on CMS SNF Cost Report for fiscal year ending in 09/2023.
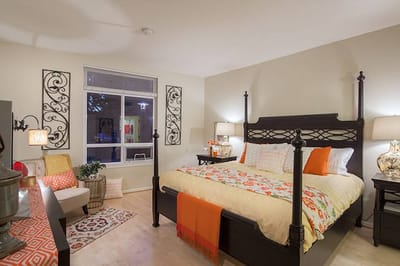
Nonprofit
Nonprofit Corporation
Net patient revenue Info Net patient revenue — what the home actually collects for resident care, after contractual allowances, bad debt and discounts are subtracted from its gross charges (CMS cost report, Worksheet G-3). It covers resident care only; money the home earns from other sources is shown separately as "Other income."
$5.4M
Net patient income Info Net patient income: net patient revenue minus the home's total operating expenses. A positive figure means it earns more from resident care than it spends to deliver it; a negative figure means the opposite. It excludes non-operating "other income."
-$49.1M
Nonprofit Nonprofit Corporation
Net patient revenue Info Net patient revenue — what the home actually collects for resident care, after contractual allowances, bad debt and discounts are subtracted from its gross charges (CMS cost report, Worksheet G-3). It covers resident care only; money the home earns from other sources is shown separately as "Other income."
$5.4M Rank #3 / 94Revenue — State benchmarkedThis home is ranked 3rd out of 94 homes in Washington. Shows this facility's annual revenue compared to the Washington average. Higher revenue generally means more resources for staffing and capital — read alongside Payroll %.Rankings are based only on facilities in Washington that report data for that category. Facilities without available data are excluded from the ranking.Click the rank badge to see the full State ranking.Click here to see the full State ranking.
Net patient income Info Net patient income: net patient revenue minus the home's total operating expenses. A positive figure means it earns more from resident care than it spends to deliver it; a negative figure means the opposite. It excludes non-operating "other income."
-$49.1M
Other income Info Money the home earns outside of resident care — such as investments, grants, rentals and other non-operating sources (CMS cost report, Worksheet G-3). It is tracked separately from net patient revenue: it is not part of that figure, and it is not included in net patient income.
$46.7M
Payroll costs Info Staff salaries plus wage-related costs — benefits such as payroll taxes, health insurance and retirement — from the home's own accounting records (CMS cost report, Worksheet A). Contract or agency labor is counted separately, under other operating costs. Rank #8 / 94Payroll — State benchmarkedThis home is ranked 8th out of 94 homes in Washington. Shows total annual staff payroll benchmarked to the Washington average. Higher payroll investment relative to peers often signals better staffing and less reliance on cheaper contract labor.Rankings are based only on facilities in Washington that report data for that category. Facilities without available data are excluded from the ranking.Click the rank badge to see the full State ranking.Click here to see the full State ranking.
$14.4M 266.3% of net patient revenue Info Payroll as a share of revenue: staff salaries and wage-related benefits divided by net patient revenue. A higher figure means more of each revenue dollar goes to staff pay. Rank #91 / 94Payroll % — State benchmarkedThis home is ranked 91st out of 94 homes in Washington. Shows payroll as a percentage of revenue versus the Washington average. Well-run Washington facilities typically land around 53–61% — the top third Statewide. Below 25% may signal understaffing or heavy agency use — read with Staffing ratings.Rankings are based only on facilities in Washington that report data for that category. Facilities without available data are excluded from the ranking.Click the rank badge to see the full State ranking.Click here to see the full State ranking.
Other operating costs Info Everything it costs to run the home apart from payroll — food, utilities, supplies, maintenance, contract labor and administration. Calculated as total operating expense minus payroll (staff salaries and wage-related benefits).
$40.0M
Total costs Info The home's total operating expense for the year — all the costs of running it, salaries included (CMS cost report, Worksheet G-3).
$54.5M

What does this home offer?

Room sizes icon
Room sizes icon

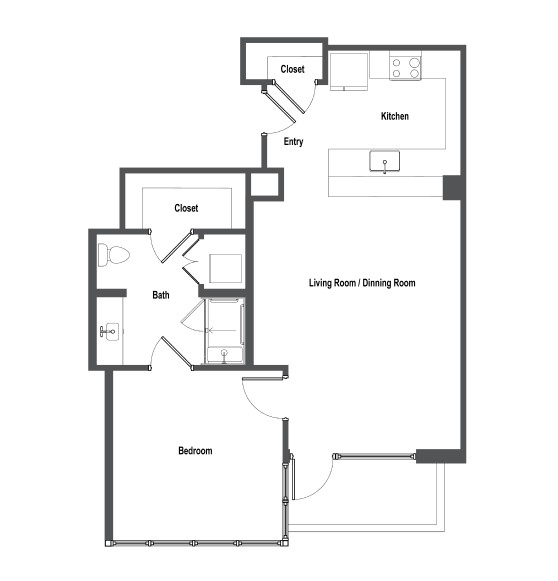
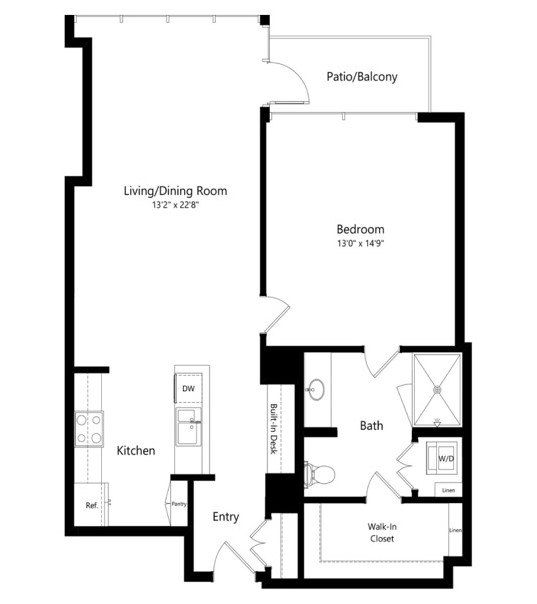
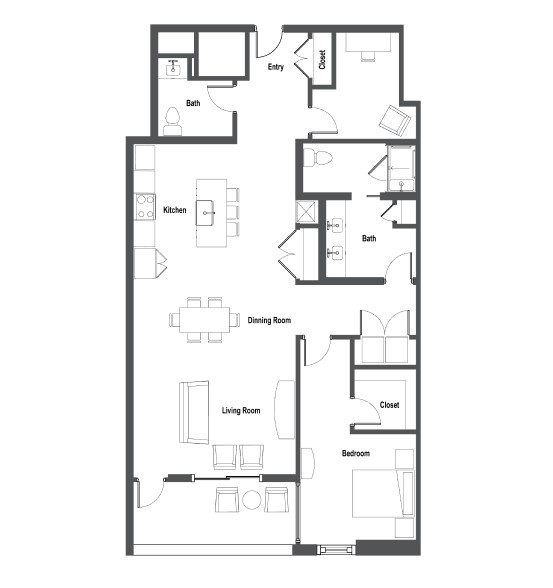
Room Sizes: 785 - 1415 / 1100 - 1505 sq. ft.

Housing options icon

Housing Options: 1 Bed / 2 Bed

Building type icon
Building type icon

Building Type: High-rise

Fitness and recreation icon

Fitness and Recreation

Who this home usually serves

TYPE OF STAY

Mostly short-term rehab stays

Most residents typically stay for a few weeks or months before returning home or moving on.

Most new residents arrive under Medicare (54% of admissions), and a typical Medicare stay runs around 25 days.

Admissions
232 total

Coverage residents most often arrive under.

Medicare 54%
Private pay 46%
Discharges
233 total

Coverage residents most often leave under.

Medicare 37%
Private pay 63%

Living Spaces & Floor Plans for Skyline

Places of interest near Skyline

Address 0.4 miles from city center Info Estimated distance in miles from Seattle's city center to Skyline's address, calculated via Google Maps.

Calculate Travel Distance to Skyline

Add your location

Address

Compare Nursing Homes around Seattle

The information below is reported by the Washington Department of Social and Health Services, Residential Care Services.

5 facilities compared · CMS & WA Dept. of Health data

Mirabella Seattle
NH
AL
MC
Seattle (South Lake Union)
63
Facility 63
WA AVG 82
Rank #237 / 366
46.0%
Facility 46.0%
WA AVG 72.5%
Rank #285 / 310
-37%
4.68
Facility 4.68
WA AVG 4.22
Rank #10 / 90
+2%+11%
$8.3k
Facility $8.3k
WA AVG $87.7k
Rank #35 / 92
41
Facility 41
WA AVG 48.9
Rank #37 / 92
10.3
Facility 10.3
WA AVG 6.9
Rank #76 / 92
-36A+
99
Facility 99
WA AVG 51
Rank #1 / 628
Lee Burnside
$7.9M
Facility $7.9M
WA AVG $13.2M
Rank #9 / 94
$13.8M
Facility $13.8M
WA AVG $5.7M
Rank #9 / 94
173.2%
Facility 173.2%
WA AVG 45.5%
Rank #63 / 94
505520
Washington Care Center
NH
MC
NC
RC
Seattle (Rainier Valley)
165
Facility 165
WA AVG 82
Rank #9 / 366
27.9%
Facility 27.9%
WA AVG 72.5%
Rank #304 / 310
-62%
4.21
Facility 4.21
WA AVG 4.22
Rank #38 / 90
+30%0%
$58.7k
Facility $58.7k
WA AVG $87.7k
Rank #59 / 92
68
Facility 68
WA AVG 48.9
Rank #69 / 92
7.6
Facility 7.6
WA AVG 6.9
Rank #61 / 92
546A+
77
Facility 77
WA AVG 51
Rank #97 / 628
Rayona Deanes
$20.2M
Facility $20.2M
WA AVG $13.2M
Rank #24 / 94
$13.0M
Facility $13.0M
WA AVG $5.7M
Rank #10 / 94
64.1%
Facility 64.1%
WA AVG 45.5%
Rank #6 / 94
505017
Avamere Rehabilitation at Park West
NH
RC
Seattle (North Admiral)
137
Facility 137
WA AVG 82
Rank #28 / 366
62.1%
Facility 62.1%
WA AVG 72.5%
Rank #241 / 310
-14%
4.30
Facility 4.30
WA AVG 4.22
Rank #28 / 90
-31%+2%
$29.8k
Facility $29.8k
WA AVG $87.7k
Rank #49 / 92
60
Facility 60
WA AVG 48.9
Rank #59 / 92
7.5
Facility 7.5
WA AVG 6.9
Rank #58 / 92
493-
71
Facility 71
WA AVG 51
Rank #140 / 628
-
$10.4M
Facility $10.4M
WA AVG $13.2M
Rank #61 / 94
$6.8M
Facility $6.8M
WA AVG $5.7M
Rank #49 / 94
65.2%
Facility 65.2%
WA AVG 45.5%
Rank #31 / 94
505270
Skyline
NH
AL
IL
MC
Seattle (Downtown Seattle)
34
Facility 34
WA AVG 82
Rank #343 / 366
79.3%
Facility 79.3%
WA AVG 72.5%
Rank #124 / 310
+9%
5.24
Facility 5.24
WA AVG 4.22
Rank #6 / 90
+17%+24%
$0
Facility $0
WA AVG $87.7k
Rank #1 / 92
52
Facility 52
WA AVG 48.9
Rank #51 / 92
17.3
Facility 17.3
WA AVG 6.9
Rank #89 / 92
-29-
98
Facility 98
WA AVG 51
Rank #7 / 628
Presbyterian Retirement Communities Northwest
$5.4M
Facility $5.4M
WA AVG $13.2M
Rank #3 / 94
$14.4M
Facility $14.4M
WA AVG $5.7M
Rank #8 / 94
266.3%
Facility 266.3%
WA AVG 45.5%
Rank #91 / 94
505469
Kin On
NH
AL
HC
NC
Seattle (Rainier Valley)
100
Facility 100
WA AVG 82
Rank #93 / 366
90.0%
Facility 90.0%
WA AVG 72.5%
Rank #47 / 310
+24%
4.18
Facility 4.18
WA AVG 4.22
Rank #38 / 90
+41%-1%
$25.5k
Facility $25.5k
WA AVG $87.7k
Rank #47 / 92
47
Facility 47
WA AVG 48.9
Rank #43 / 92
7.8
Facility 7.8
WA AVG 6.9
Rank #62 / 92
193-
84
Facility 84
WA AVG 51
Rank #62 / 628
Dennis Lam
$14.3M
Facility $14.3M
WA AVG $13.2M
Rank #33 / 94
$9.9M
Facility $9.9M
WA AVG $5.7M
Rank #20 / 94
69.7%
Facility 69.7%
WA AVG 45.5%
Rank #16 / 94
505453

Financial Assistance for
Nursing Home in Washington

Skyline is located in Seattle, Washington.
Here are the financial assistance programs available to residents in Washington.

Get Financial aid guidance

Community Options Program Entry System (COPES)

WA Medicaid COPES

Age 65+ or disabled
General Washington resident, Medicaid-eligible, nursing home-level care need.
Income Limits (2025) ~$2,829/month 300% FBR, individual
Asset Limits $2,000 (individual), $3,000 (couple).
WA

High demand in urban areas (e.g., Seattle).

Benefits
Personal care (5-7 hours/day) Respite (240 hours/year) Adult day care ($70/day) Home modifications ($1,500 avg.)

Washington Family Caregiver Support Program

WA NFCSP

Age Caregiver of someone 60+ (or with dementia)
General Washington resident.
Income Limits No strict limit; prioritizes low-income.
Asset Limits Not applicable.
WA

High urban demand; rural outreach.

Benefits
In-home respite (4-6 hours/day) Adult day care (~$70/day) Short-term facility care (up to 5 days)

Community First Choice (CFC)

Washington Community First Choice

Age 65+ (or disabled 18+)
General WA resident, Medicaid-eligible, need help with 2+ ADLs/IADLs.
Income Limits (2025) ~$2,829/month; QIT optional.
Asset Limits $2,000 (individual), $3,000 (couple).
WA

Broader than COPES; serves ~20,000; self-directed option.

Benefits
Personal care (4-6 hours/day) Respite (~240 hours/year) Assistive devices Training Transportation

Older Americans Act (OAA) Services

Washington OAA Services

Age 60+
General WA resident; no income/asset limits.
Income Limits (2025) None; donations encouraged.
Asset Limits Not assessed.
WA

13 AAAs; includes Meals on Wheels; rural focus.

Benefits
Meals (~$5-$7/meal) Transportation Homemaker services (~4 hours/week) Respite (~5 days/year) Legal aid

Medicare Savings Program (MSP)

Washington Medicare Savings Program

Age 65+ or disabled
General WA resident, Medicare Part A/B.
Income Limits (2025) ~$2,510/month (QMB), ~$3,380/month (SLMB), ~$3,598/month (QI)—individual.
Asset Limits $9,430 (individual), $14,130 (couple).
WA

Includes Extra Help for Part D; no waitlist.

Benefits
Covers Part B premiums ($174.70/month) Deductibles ($240/year) Copays (~20%)

VA Aid and Attendance (A&A) and Housebound Benefits

Washington VA Aid and Attendance/Housebound

Age 65+ or disabled veteran/spouse
General WA resident, wartime service, ADL help (A&A) or homebound.
Income Limits (2025) Net income < ~$1,984/month (veteran with dependent, A&A); pension offsets income.
Asset Limits ~$155,356 net worth
WA

High veteran use; supports rural/urban needs.

Benefits
Cash (~$1,433-$2,642/month veteran, ~$951-$1,318 spouse) for care costs

Senior Citizens Property Tax Exemption

Washington Senior Property Tax Exemption

Age 61+ or disabled retiree
General WA resident, homeowner, income-based.
Income Limits (2025) ~$45,000-$70,000/year varies by county, e.g., King: $70,000
Asset Limits Not assessed; home value cap varies ~$250,000-$400,000
WA

Saves ~$500-$1,500/year; offered statewide.

Benefits
Tax exemption (~$500-$1,500/year depending on county)

Senior Farmers’ Market Nutrition Program (SFMNP)

Washington SFMNP

Age 60+
General WA resident, low-income.
Income Limits (2025) ~$2,322/month 185% FPL
Asset Limits Not assessed.
WA

Vouchers (~$80/season); serves ~20,000 via AAAs.

Benefits
Vouchers (~$80/season) for produce at farmers’ markets

Frequently Asked Questions about Skyline

What neighborhood is Skyline in?

Skyline is in the Downtown Seattle neighborhood.

Is Skyline in a walkable area?

Skyline has a walk score of 98. Walker's paradise. Daily errands do not require a car, with many shops and services nearby.

What is the occupancy rate at Skyline?

Skyline's occupancy is 79.3%.

Does Skyline operate as a for-profit or non-profit?

Skyline is registered as a non-profit.

Are there photos of Skyline?

Yes — there are 4 photos of Skyline in the photo gallery on this page.

What is the address of Skyline?

Skyline is located at 725 9Th Ave, Seattle, WA 98104.

What is the phone number of Skyline?

(206) 405-4100 will put you in contact with the team at Skyline.

Guides for Better Senior Living

Care Cost Calculator: See Prices in Your Area

Nursing Home Data Explorer

Don’t Wait Too Long: 7 Red Flag Signs Your Parent Needs Assisted Living Now

The True Cost of Assisted Living in 2025 – And How Families Are Paying For It

Understanding Senior Living Costs: Pricing Models, Discounts & Financial Assistance