SMP Health – Ave Maria
Nursing Home · North Dakota, ND
CMS overall rating Info The Overall CMS Rating is scored from 1 to 5 stars and combines results from health inspections, staffing levels, and quality measures. Health inspections carry the most weight. Staffing and quality scores can increase or decrease the final rating based on performance compared to state and national standards.

SMP Health – Ave Maria

Nursing Home · North Dakota, ND
CMS overall rating Info The Overall CMS Rating is scored from 1 to 5 stars and combines results from health inspections, staffing levels, and quality measures. Health inspections carry the most weight. Staffing and quality scores can increase or decrease the final rating based on performance compared to state and national standards.
Calculator: See prices in your area
SMP Health – Ave Maria accepts Medicare, Medicaid, and private pay.

Overview of Smp Health – Ave Maria

SMP Health – Ave Maria is a Catholic health care ministry in Jamestown, ND, providing short-term rehabilitation and transitional care, in addition to traditional skilled nursing and long-term care services. The facility serves individuals of all faiths and strives to address the needs of the whole person, including physical, emotional, social, and spiritual needs. It is sponsored by the Sisters of Mary of the Presentation.
(701) 252-6404

Quality ratings

Measured by Centers for Medicare & Medicaid Services (CMS)

Overall rating Info The Overall CMS Rating combines results from health inspections, staffing levels and quality measures. Health inspections carry the most weight. Staffing and quality scores can increase or decrease the final rating based on performance compared to state and national standards.
▲ 31.6% Above ND avg. ▲ 31.6% Above ND avg.Click the badge to see the full State ranking.Click here to see the full State ranking.
Health Inspection Info Based on the results of the facility's three most recent standard inspections and any complaint investigations. CMS reviews the number, scope, and severity of deficiencies, with more recent findings weighted more heavily.
▲ 29.0% Above ND avg. ▲ 29.0% Above ND avg.Click the badge to see the full State ranking.Click here to see the full State ranking.
Staffing Info Measures average nursing staff hours per resident per day, including Registered Nurses (RNs) and total nursing staff. Ratings are adjusted based on the level of care residents require and are compared to state and national benchmarks.
▲ 13.6% Above ND avg. ▲ 13.6% Above ND avg.Click the badge to see the full State ranking.Click here to see the full State ranking.
Quality Measures Info Based on clinical and physical health indicators reported to CMS, such as hospital readmissions, falls, pressure ulcers, and improvements in mobility. These measures reflect how well residents' health needs are being managed.
▼ 35.5% Below ND avg. ▼ 35.5% Below ND avg.Click the badge to see the full State ranking.Click here to see the full State ranking.

Staffing hours breakdown

Info Daily nursing hours per resident by staff type, reported to CMS. Higher is generally better — compare this facility to state and national averages to see where staffing stands.

Hours per resident per day — compared to North Dakota state averages

Total nursing care / resident Info This home is ranked 2nd out of 25 homes in North Dakota. Total adjusted nursing hours per resident per day, combining RN, LPN, and aide time. CMS adjusts this for case-mix so facilities can be fairly compared.
6h 9m per day
Rank #2 / 25Nurse hours — State benchmarkedThis home is ranked 2nd out of 25 homes in North Dakota. Shows adjusted nurse hours per resident per day benchmarked to the North Dakota average, with a ranking across 25 North Dakota SNFs. More hours mean more direct care. The national average is about 3.5 hrs; below 3.0 is a red flag.Click the rank badge to see the full State ranking.Click here to see the full State ranking.
This facility North Dakota avg (4h 58m per day)
vs North Dakota avg
+24%

2 of 6 metrics below state avg

Standout metric Physical Therapist is +100% above state avg
Staff type Hours / Day / Resident vs state avg
Registered Nurse (RN) Info RNs hold the highest nursing license and can assess residents, interpret test results, and direct care plans. More RN hours per day often signals stronger clinical oversight and faster response to health changes. 59m per day ▲ 5% State avg: 56m per day · National avg: 41m per day
LPN / LVN Info Licensed Practical Nurses (LPNs) or Licensed Vocational Nurses (LVNs) deliver routine hands-on care — medication administration, wound dressing, and monitoring vital signs. They work under RN supervision and make up a large share of daily bedside care. 28m per day ▼ 7% State avg: 30m per day · National avg: 52m per day
Nurse Aide Info Certified Nurse Aides (CNAs) provide the most direct day-to-day assistance: bathing, dressing, feeding, and mobility. Nurse aide hours are typically the largest staffing category and directly affect residents' quality of life. 3h 58m per day ▲ 33% State avg: 2h 59m per day · National avg: 2h 20m per day
Weekend Total Nursing Info Combined nursing hours (RN + LPN + Nurse Aide) per resident per day on weekends. Staffing often drops on weekends — this figure reveals whether the facility maintains adequate coverage outside of weekday hours. 4h 39m per day ▲ 24% State avg: 3h 45m per day · National avg: 3h 26m per day
Physical Therapist Info Hours per resident per day provided by licensed Physical Therapists (PTs) or PT Assistants. PT services help residents recover mobility after injury or illness and are especially important for post-acute (short-stay) rehabilitation. 4m per day ▲ 100% State avg: 2m per day · National avg: 4m per day
Weekend RN Info Registered nurse hours specifically on weekends. Facilities sometimes reduce RN presence on Saturdays and Sundays — a low weekend RN figure compared to weekday hours can indicate reduced clinical oversight when most administrative staff are absent. 29m per day ▼ 17% State avg: 35m per day · National avg: 28m per day

Capacity and availability

This home is often near full

Occupancy higher than 95% suggests steady demand, but availability may be limited.

Higher occupancy than the North Dakota average: 87.8%
Occupancy rate 95.7% Rank #9 / 23Occupancy rate — State benchmarkedThis home is ranked 9th out of 23 homes in North Dakota. Shows this facility's occupancy rate versus the North Dakota average, with its Statewide rank out of 23. Higher occupancy signals strong local demand and financial stability.Click the rank badge to see the full State ranking.Click here to see the full State ranking.
Avg. Length of Stay 312 days
Occupancy rate
95.7% Rank #9 / 23Occupancy rate — State benchmarkedThis home is ranked 9th out of 23 homes in North Dakota. Shows this facility's occupancy rate versus the North Dakota average, with its Statewide rank out of 23. Higher occupancy signals strong local demand and financial stability.Click the rank badge to see the full State ranking.Click here to see the full State ranking.
Avg. Length of Stay
312 days
Bed community size
58-bed community Rank #31 / 51Bed count — State benchmarkedThis home is ranked 31st out of 51 homes in North Dakota. Shows this facility's certified or reported bed count compared to other North Dakota SNFs. Larger communities may offer more amenities, programs, and on-site services for residents and families.Click the rank badge to see the full State ranking.Click here to see the full State ranking.
A moderately sized community that may balance personal attention with shared amenities and social activities.
Walk Score
Walk Score: 63 / 100 Rank #19 / 80Walk Score — State benchmarkedThis home is ranked 19th out of 80 homes in North Dakota. Shows how walkable this facility's neighborhood is compared to the average Walk Score across North Dakota SNFs. Higher scores benefit residents, families, and staff.Click the rank badge to see the full State ranking.Click here to see the full State ranking.
Moderately walkable. Some errands can be accomplished on foot, with a mix of nearby amenities.

About this community

License Details

Facility TypeAssisted Living Facility
CMS Certification Number355082

Therapy & Rehabilitation

1 service
Rehabilitation Services

Staffing & Medical

1 service
24-Hour Staffing

Additional Services

3 services
Rehabilitation & Transitional Care
Spiritual Care
Palliative Care

Contact SMP Health – Ave Maria

Inspection History

In North Dakota, the Department of Health and Human Services, Health Facilities Division is the agency authorized to perform unannounced inspections and issue official health quality reports.

Since 2022 · 4 years of data 10 deficiencies 4 inspections

Inspection Scorecard Info This scorecard compares key inspection, citation, and complaint metrics at this facility against the North Dakota state average. Metrics rated ≥15% worse than average are highlighted in red; those ≥15% better are highlighted in green.

Since 2022 vs. North Dakota state average
Overall vs. ND average 0 Worse No metrics in this bucket. 4 Better Metrics better than North Dakota average:
• Total deficiencies (55% below)
• Deficiencies per year (55% below)
• Deficiencies per inspection (19% below)
• Total inspections (43% below)
Latest Inspection September 11, 2024 Routine

Deficiencies Info Deficiencies are formal regulatory issues recorded during state inspections.

This Facility ND Average vs. ND Avg
Total deficiencies Info Formal regulatory issues recorded by inspectors across all inspection types. 10 22 This facility has 55% fewer total deficiencies than a typical North Dakota nursing home (10 vs. ND avg 22).↓ 55% better
Deficiencies per year Info Average deficiencies per year since 2022. 2.5 5.5 This facility has 55% fewer deficiencies per year than a typical North Dakota nursing home (2.5 vs. ND avg 5.5).↓ 55% better
Deficiencies per inspection Info Average deficiencies per inspection. 2.5 3.1 This facility has 19% fewer deficiencies per inspection than a typical North Dakota nursing home (2.5 vs. ND avg 3.1).↓ 19% better

Inspections Info State inspections evaluate whether the facility meets health and safety standards.

This Facility ND Average vs. ND Avg
Total inspections Info Combined count of all routine and focused inspections. Excludes complaint investigations. 4 7 This facility has 43% fewer total inspections than a typical North Dakota nursing home (4 vs. ND avg 7).↓ 43% better

Health Inspection History

Inspections since 2022
Total health inspections 4

North Dakota average 4.2


Last Health inspection on Sep 2024
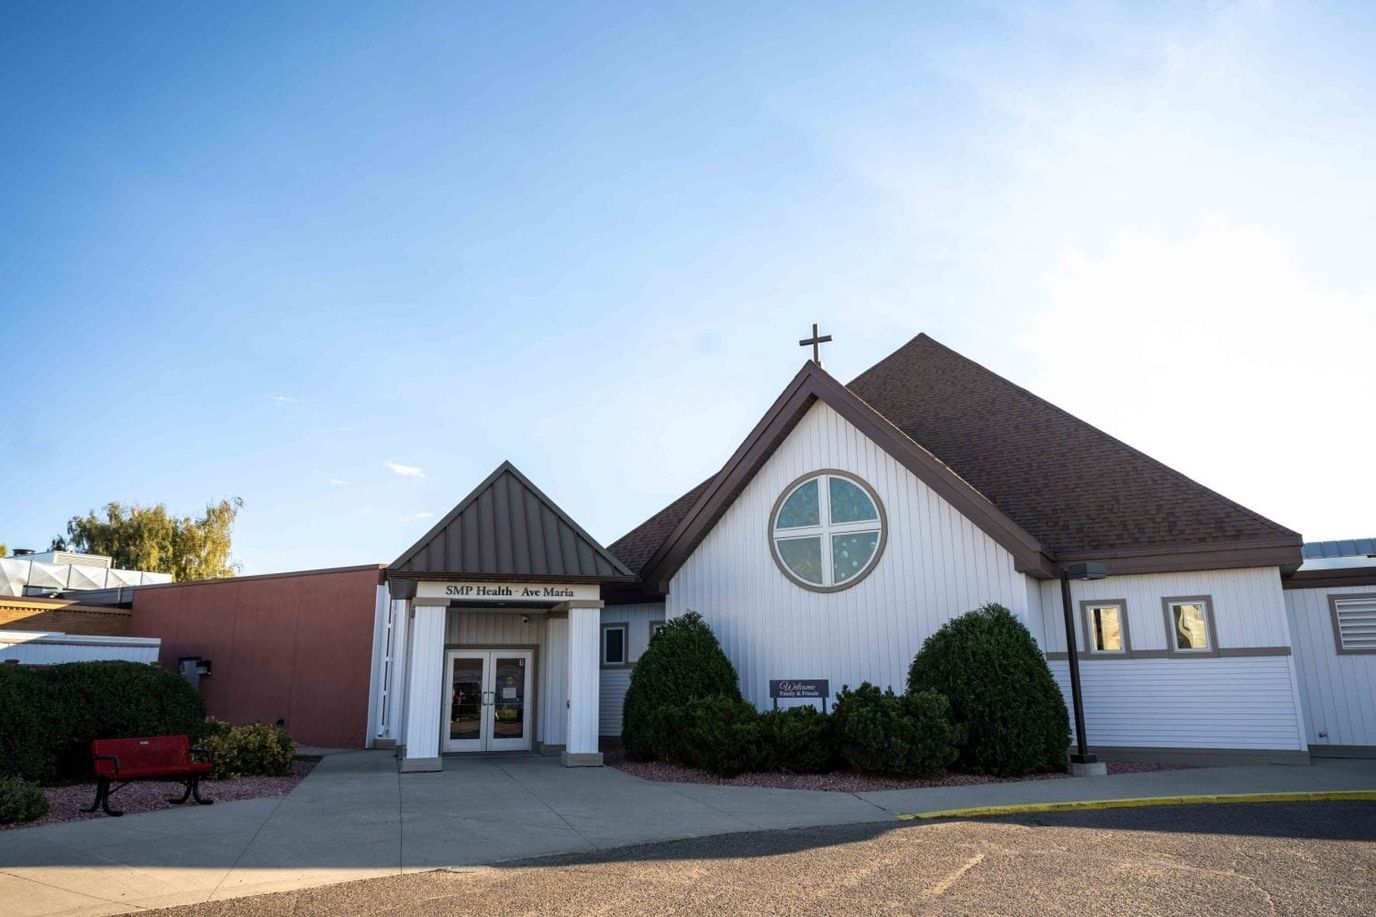
Total health citations
7 Rank #2 / 25Health citations — State benchmarkedThis home is ranked 2nd out of 25 homes in North Dakota. Shows this facility's total health deficiency citations benchmarked to the North Dakota State average, with a ranking across all 25 ND SNFs. Lower citation counts earn a better rank.Click the rank badge to see the full State ranking.Click here to see the full State ranking.

North Dakota average 16.5

Citations per inspection
1.75 Rank #3 / 25Citations per inspection — State benchmarkedThis home is ranked 3rd out of 25 homes in North Dakota. Shows average deficiency citations per CMS inspection for this facility versus the North Dakota mean across 25 SNFs with citation data. Lower is better.Click the rank badge to see the full State ranking.Click here to see the full State ranking.

North Dakota average 3.93


Health citations are formal notices following inspections when they fail to comply with safety and care standards.

4 of 7 citations resulted from standard inspections; 1 of 7 resulted from complaint investigations; and 2 of 7 came from combined inspections (standard and complaint).

Breakdown of citation severity (last 4 years)
Critical Health citations
0
100% better than North Dakota average

North Dakota average: 0.5


Serious Health citations
1 Rank #1 / 14Serious citations (G–I) — State benchmarkedThis home is ranked 1st out of 14 homes in North Dakota. Shows G–I scope serious health citations for this facility versus other North Dakota SNFs. Lower counts rank better.Click the rank badge to see the full State ranking.Click here to see the full State ranking.
In line with North Dakota average

North Dakota average: 1

0 critical citations North Dakota average: 0.5

1 serious citation North Dakota average: 1

6 moderate citations North Dakota average: 14.8

0 minor citations North Dakota average: 0.2
Citations history (last 4 years)
Infection Control moderate citation Sep 11, 2024
Corrected

Pharmacy moderate citation Sep 11, 2024
Corrected

Resident Rights moderate citation Sep 11, 2024
Corrected

Abuse/Neglect serious citation Jun 13, 2024
Corrected

Staffing Data

Reporting period: October 1 – December 31, 2025 (Q4 2025). Source: CMS Payroll-Based Journal report.

Total staff 207
Employees 195
Contractors 12
Staff to resident ratio 2.38:1
24% better than North Dakota average
North Dakota average ratio: 1.92:1 North Dakota average ratio: 1.92:1See full North Dakota ranking
Avg staff/day 73
Average shift 7.5 hours
5% worse than North Dakota average
North Dakota average: 7.9 hours North Dakota average shift: 7.9 hoursSee full North Dakota ranking
Total staff hours (quarter) 50,554

Nursing staff breakdown

Q4 2025 · Oct 1 – Dec 31 More info This data comes from the CMS Payroll-Based Journal report covering October 1 – December 31, 2025.
Registered Nurse

Manages medical care and health needs.

RN Staff 24
Average shift length Info Average shift length. Calculated as total hours divided by days worked and average staff per day. 8.4 hours

No contractors work on this role.

Licensed Practical Nurse

Assists with medical care and medications.

LPN Staff 15
Average shift length Info Average shift length. Calculated as total hours divided by days worked and average staff per day. 8.2 hours

This role is partially covered by contractors.

Certified Nursing Assistant

Helps with daily care and mobility.

CNA Staff 126
Average shift length Info Average shift length. Calculated as total hours divided by days worked and average staff per day. 7.3 hours

No contractors work on this role.

Contractor staffing

Q4 2025 · Oct 1 – Dec 31 More info This data comes from the CMS Payroll-Based Journal report covering October 1 – December 31, 2025.

Total hours from contractors

3.1%

1,542 contractor hours this quarter

Physical Therapy Assistant: 2 Speech Language Pathologist: 2 Licensed Practical Nurse: 1 Respiratory Therapy Technician: 1 Qualified Social Worker: 1 Physical Therapy Aide: 1 Administrator: 1 Occupational Therapy Assistant: 1 Medical Director: 1 Qualified Activities Professional: 1

Staff by category

Q4 2025 · Oct 1 – Dec 31 More info This data comes from the CMS Payroll-Based Journal report covering October 1 – December 31, 2025.
Certified Nursing Assistant 126 0 126 29,695 92 100% 7.3
Registered Nurse 24 0 24 7,398 92 100% 8.4
Licensed Practical Nurse 14 1 15 4,449 92 100% 8.2
Medication Aide/Technician 18 0 18 2,466 92 100% 7.9
Other Dietary Services Staff 5 0 5 1,768 92 100% 6.8
Dental Services Staff 3 0 3 985 61 66% 7.6
Dietitian 1 0 1 471 59 64% 8
Occupational Therapy Aide 1 0 1 463 58 63% 8
Mental Health Service Worker 1 0 1 463 58 63% 8
Respiratory Therapy Technician 0 1 1 458 57 62% 8
Nurse Practitioner 1 0 1 456 58 63% 7.9
Administrator 0 1 1 449 58 63% 7.7
Clinical Nurse Specialist 1 0 1 415 52 57% 8
Physical Therapy Aide 0 1 1 330 65 71% 5.1
Qualified Social Worker 0 1 1 126 51 55% 2.5
Physical Therapy Assistant 0 2 2 102 34 37% 2.8
Occupational Therapy Assistant 0 1 1 39 6 7% 6.5
Speech Language Pathologist 0 2 2 13 3 3% 4.3
Qualified Activities Professional 0 1 1 3 4 4% 0.8
Medical Director 0 1 1 3 3 3% 1
126 Certified Nursing Assistant
% of Days 100%
24 Registered Nurse
% of Days 100%
15 Licensed Practical Nurse
% of Days 100%
18 Medication Aide/Technician
% of Days 100%
5 Other Dietary Services Staff
% of Days 100%
3 Dental Services Staff
% of Days 66%
1 Dietitian
% of Days 64%
1 Occupational Therapy Aide
% of Days 63%
1 Mental Health Service Worker
% of Days 63%
1 Respiratory Therapy Technician
% of Days 62%
1 Nurse Practitioner
% of Days 63%
1 Administrator
% of Days 63%
1 Clinical Nurse Specialist
% of Days 57%
1 Physical Therapy Aide
% of Days 71%
1 Qualified Social Worker
% of Days 55%
2 Physical Therapy Assistant
% of Days 37%
1 Occupational Therapy Assistant
% of Days 7%
2 Speech Language Pathologist
% of Days 3%
1 Qualified Activities Professional
% of Days 4%
1 Medical Director
% of Days 3%

Penalties and fines

Includes penalties issued in 2024

Federal penalties imposed by CMS for regulatory violations, including civil money penalties (fines) and denials of payment for new Medicare/Medicaid admissions.

Source: CMS Penalties Database (Data as of Jan 2026)

Total fines amount $7K Rank #12 / 25Federal fines — State benchmarkedThis home is ranked 12th out of 25 homes in North Dakota. Shows this facility's cumulative CMS federal fine dollars versus the North Dakota average among facilities with fines, and where it ranks among 25 skilled nursing facilities in the pool. Lower total dollars mean a better rank.Click the rank badge to see the full State ranking.Click here to see the full State ranking.
83% lower than North Dakota average

North Dakota average: $39K

Number of fines 1
35% fewer fines than North Dakota average

North Dakota average: 1.5

Payment Denials Info Serious action where Medicare and/or Medicaid temporarily stops payments for new residents until issues are fixed. 0
100% fewer payment denials than North Dakota average

North Dakota average: 0.0

Fines amount comparison
This facility $7K
North Dakota average $39K
Penalty History

Penalties are imposed by CMS for violations of federal nursing home regulations.

1 penalty in the past 3 years

Jun 13, 2024 · $7K

Civil Money Penalty Info Fines imposed for noncompliance, which can be assessed per day or per instance of violation. Jun 13, 2024
$7K

Last updated: Jan 2026

Quality of care over time

These measures show how residents usually do over time at this home, based on health outcomes and preventive care.

High-risk clinical events score Info A composite score based on pressure ulcers, falls with injury, weight loss, walking ability decline, and activities of daily living decline. 11.8
In line with North Dakota average

North Dakota average: 11.4

Functional decline score Info A composite score based on activities of daily living decline, walking ability decline, and incontinence. 24.7
12% worse than North Dakota average

North Dakota average: 22.0

Long-stay resident measures
Below average North Dakota avg: 3.0 Info CMS star rating based on long-stay quality measure performance. 5 stars = significantly above average, 1 star = significantly below average.
Need for Help with Daily Activities Increased Info Percent of long-stay residents whose need for help with daily activities has increased 20.3%
In line with North Dakota average

North Dakota average: 20.4%

Walking Ability Worsened Info Percent of long-stay residents whose ability to move independently worsened 23.0%
12% worse than North Dakota average

North Dakota average: 20.6%

Low Risk Residents with Bowel/Bladder Incontinence Info Percent of low risk long-stay residents who lose control of their bowels or bladder 30.9%
23% worse than North Dakota average

North Dakota average: 25.0%

Falls with Major Injury Info Percent of long-stay residents experiencing one or more falls with major injury 7.2%
44% worse than North Dakota average

North Dakota average: 5.0%

High Risk Residents with Pressure Ulcers Info Percent of long-stay high risk residents with pressure ulcers 6.9%
24% worse than North Dakota average

North Dakota average: 5.6%

Urinary Tract Infection Info Percent of long-stay residents with a urinary tract infection 1.9%
44% better than North Dakota average

North Dakota average: 3.4%

Lost Too Much Weight Info Percent of long-stay residents who lose too much weight 1.8%
69% better than North Dakota average

North Dakota average: 5.7%

Depressive Symptoms Info Percent of long-stay residents who have depressive symptoms 0.3%
92% better than North Dakota average

North Dakota average: 4.4%

Antipsychotic Use Info Percent of long-stay residents who received an antipsychotic medication 20.8%
In line with North Dakota average

North Dakota average: 21.4%

Pneumococcal Vaccine Info Percent of long-stay residents assessed and appropriately given the pneumococcal vaccine 100.0%
In line with North Dakota average

North Dakota average: 98.4%

Influenza Vaccine Info Percent of long-stay residents assessed and appropriately given the seasonal influenza vaccine 100.0%
In line with North Dakota average

North Dakota average: 98.8%

Hospitalizations per 1,000 days Info Number of hospitalizations per 1,000 long-stay resident days. 1.24
14% better than North Dakota average

North Dakota average: 1.45

ED visits per 1,000 days Info Number of outpatient emergency department visits per 1,000 long-stay resident days. 2.59
35% worse than North Dakota average

North Dakota average: 1.92

Short-stay resident measures
Below average North Dakota avg: 2.3 Info CMS star rating based on short-stay quality measure performance. 5 stars = much above average, 1 star = much below average.
Pneumococcal Vaccine Info Percent of short-stay residents assessed and appropriately given the pneumococcal vaccine 97.8%
In line with North Dakota average

North Dakota average: 94.4%

Antipsychotic medication increase Info Percent of short-stay residents who newly received an antipsychotic medication 2.4%
17% worse than North Dakota average

North Dakota average: 2.1%

Influenza Vaccine Info Percent of short-stay residents assessed and appropriately given the seasonal influenza vaccine 99.1%
12% better than North Dakota average

North Dakota average: 88.6%

Re-hospitalized after SNF stay Info Percentage of short-stay residents who were re-hospitalized after their nursing home admission. 28.8%
40% worse than North Dakota average

North Dakota average: 20.5%

Emergency department visits Info Percentage of short-stay residents who had an outpatient emergency department visit. 14.6%
36% worse than North Dakota average

North Dakota average: 10.7%

Falls with major injury Info Percentage of SNF residents who experience falls with major injury during their stay. 1.8%
132% worse than North Dakota average

North Dakota average: 0.8%

Ability to care for self at discharge Info Percentage of residents at or above expected ability to care for themselves at discharge. 52.2%
In line with North Dakota average

North Dakota average: 53.7%

Successful return to home or community Info Rate of successful return to home or community from a skilled nursing facility. 42.3%
16% worse than North Dakota average

North Dakota average: 50.6%

Breakdown by payment type

Medicare

65% of new residents, usually for short-term rehab.

Typical stay 1 months

Private pay

25% of new residents, often for short stays.

Typical stay 9 - 10 months

Medicaid

9% of new residents, often for long-term daily care.

Typical stay 3 - 4 years

Facility Characteristics

Source: CMS Long-Term Care Facility Characteristics (Data as of Jan 2026)

Total residents 87
Medicare
2
2.3% of residents
Medicaid
50
57.5% of residents
Private pay or other
35
40.2% of residents
Programs & Services
Residents Group

Residents meet regularly to discuss policies, care quality, and activities

Active Resident Council

Organized group of residents that meets regularly to discuss facility policies, quality of life, and activities.

Finances and operations

Voluntary non-profit community
Home revenue
$16.7M
Surplus of revenue
$1.0M
Voluntary non-profit community
Home revenue
$16.7M Rank #9 / 22Revenue — State benchmarkedThis home is ranked 9th out of 22 homes in North Dakota. Shows this facility's annual revenue compared to the North Dakota SNF average. Higher revenue generally means more resources for staffing and capital — read alongside Payroll %.Click the rank badge to see the full State ranking.Click here to see the full State ranking.
Surplus of revenue
$1.0M
Payroll costs Info The portion of the home's budget spent on staff, including nurses, caregivers, and other employees who support care and operations. Rank #8 / 22Payroll — State benchmarkedThis home is ranked 8th out of 22 homes in North Dakota. Shows total annual staff payroll benchmarked to the North Dakota average. Higher payroll investment relative to peers often signals better staffing and less reliance on cheaper contract labor.Click the rank badge to see the full State ranking.Click here to see the full State ranking.
$11.5M
69.1% of revenue Rank #6 / 22Payroll % — State benchmarkedThis home is ranked 6th out of 22 homes in North Dakota. Shows payroll as a percentage of revenue versus the North Dakota average. Well-run North Dakota SNFs typically land around 67–77% — the top third Statewide. Below 25% may signal understaffing or heavy agency use — read with Staffing ratings.Click the rank badge to see the full State ranking.Click here to see the full State ranking.
Other operating costs Info All remaining costs needed to run the home, such as food, utilities, building maintenance, supplies and administrative expenses.
$4.1M
Total costs $15.6M

Who this home usually serves

TYPE OF STAY

Mostly short-term rehab stays

Most residents typically stay for a few weeks or months before returning home or moving on.

Places of interest near SMP Health – Ave Maria

Address 0.0 miles from city center Info Estimated distance in miles from Jamestown's city center to SMP Health – Ave Maria's address, calculated via Google Maps.

Calculate Travel Distance to SMP Health – Ave Maria

Add your location

Address

Financial Assistance for
Nursing Home in North Dakota

SMP Health – Ave Maria is located in Jamestown, North Dakota.
Here are the financial assistance programs available to residents in North Dakota.

Get Financial aid guidance

Aged and Disabled Waiver

ND Medicaid A&D Waiver

Age 65+ or disabled
General North Dakota resident, Medicaid- eligible, nursing home-level care need.
Income Limits (2025) ~$2,829/month 300% FBR, individual
Asset Limits $3,000 individual, higher than most states
ND

Higher asset limit; sparse population aids rural access.

Benefits
Personal care (5-7 hours/day) Respite (240 hours/year) Adult day care (~$60/day) Home aides

Service Payments for Elderly and Disabled (SPED)

ND SPED

Age 65+ or disabled
General North Dakota resident, at risk of decline.
Income Limits ~$1,732/month individual, varies
Asset Limits $50,000 individual, higher limit
ND

Higher asset limit; rural focus.

Benefits
In-home care (2-4 hours/week) Respite (up to 5 days/year) Transportation (~5 trips/month)

Basic Care Assistance Program (BCAP)

North Dakota Basic Care Assistance Program

Age 65+ (or disabled 18+)
General ND resident, in licensed basic care facility, low-income.
Income Limits (2025) ~$1,255/month (individual, after facility costs); varies by facility rate.
Asset Limits $3,000 individual
ND

Supplements SSI; covers ~50 facilities statewide.

Benefits
Cash (~$1,000-$1,500/month) for room/board/care in basic care facilities

Family Home Care Program

North Dakota Family Home Care Program

Age 60+
General ND resident, need help with 1+ ADL, family caregiver available.
Income Limits (2025) No strict cap; prioritizes low-income ~$24,980/year
Asset Limits Not assessed; need-based.
ND

Caregiver must be family; payment varies by hours/service.

Benefits
Family caregiver payment (~$10-$15/hour, up to 20 hours/week) Respite support

Medicare Savings Program (MSP)

North Dakota Medicare Savings Program

Age 65+ or disabled
General ND resident, Medicare Part A/B.
Income Limits (2025) ~$2,510/month (QMB), ~$3,380/month (SLMB), ~$3,598/month (QI)—individual.
Asset Limits $9,430 (individual), $14,130 (couple).
ND

Three tiers; no waitlist; includes Extra Help for Part D.

Benefits
Covers Part B premiums ($174.70/month) Deductibles ($240/year) Copays (~20%)

Family Caregiver Support Program (FCSP)

North Dakota Family Caregiver Support Program

Age
General Caregivers of 60+ needing care or 55+ caregivers of others; ND resident; functional needs (2+ ADLs).
Income Limits (2025) Prioritizes ~$24,980/year (individual); no strict cap.
Asset Limits Not assessed; need-based.
ND

8 regions; rural/low-income priority.

Benefits
Respite (4-6 hours/week or 5 days/year) Adult day care ($50/day) Training Supplies (~$500/year)

VA Aid and Attendance (A&A) and Housebound Benefits

North Dakota VA Aid and Attendance/Housebound

Age 65+ or disabled veteran/spouse
General ND resident, wartime service, need for ADL help (A&A) or homebound.
Income Limits (2025) Net income < ~$1,984/month (veteran with dependent, A&A); pension offsets income.
Asset Limits ~$155,356 net worth limit
ND

High veteran demand in rural areas; ND Veterans Home option.

Benefits
Cash (~$1,433-$2,642/month veteran, ~$951-$1,318 spouse) for care costs (e.g., in-home, assisted living)

Property Tax Homestead Credit for Seniors

North Dakota Homestead Property Tax Credit

Age 65+ (or disabled)
General ND resident, homeowner, low-income.
Income Limits (2025) ~$22,500/year (individual), ~$29,500/year (couple).
Asset Limits Home value < $500,000; other assets not assessed.
ND

Credit up to $500-$1,000; applies to primary residence.

Benefits
Tax reduction (~$500-$1,000/year) on property taxes

Medicaid Personal Care Option (PCO)

North Dakota Medicaid Personal Care Option

Age 65+ (or disabled)
General ND resident, Medicaid-eligible, need help with 1+ ADL.
Income Limits (2025) ~$1,255/month (100% FPL, individual); QIT optional for excess income.
Asset Limits $3,000 (individual), $6,000 (couple) (excludes home up to $713,000, car).
ND

Self-directed option (hire family); part of Medicaid State Plan, not a waiver.

Benefits
Personal care (5-20 hours/week) Homemaker services Respite (~5 days/year)

Compare Nursing Home around North Dakota

The information below is reported by the North Dakota Department of Health and Human Services, Health Facilities Division.

2 facilities compared · CMS & ND Dept. of Health data

Filter by care type
SMP Health – Ave Maria
NH

Nursing Home Licensed facility providing 24/7 skilled nursing care for residents with complex, ongoing medical needs. Staffed by RNs, LPNs, and CNAs. Inspected and star-rated annually by CMS. Accepts Medicare (short-term rehab) and Medicaid (long-term care).

AL

Assisted Living A licensed, long-term care setting for seniors or individuals with disabilities who need help with daily activities — like bathing, dressing, and medication management — but not 24-hour skilled nursing. Offers housing, meals, and around-the-clock support while aiming to maximize resident independence.

Jamestown (Midway Township) 58 95.7% +9% 6.16 -12% +19% $6.8k 7 1.8 1 89 63 Sisters Of Mary Of The Presentation Long Term Care $16.7M $11.5M 69.1% 355082
Edgewood Grand Forks
NH

Nursing Home Licensed facility providing 24/7 skilled nursing care for residents with complex, ongoing medical needs. Staffed by RNs, LPNs, and CNAs. Inspected and star-rated annually by CMS. Accepts Medicare (short-term rehab) and Medicaid (long-term care).

AL

Assisted Living A licensed, long-term care setting for seniors or individuals with disabilities who need help with daily activities — like bathing, dressing, and medication management — but not 24-hour skilled nursing. Offers housing, meals, and around-the-clock support while aiming to maximize resident independence.

MC

Memory Care Secured, specialized care for people living with Alzheimer's or dementia. Staff trained in cognitive impairment, with higher staff-to-resident ratios and an environment designed to reduce confusion and wandering risk.

Grand Forks 122 - - 4.44 +98% -14% $54.9k 12 3.0 3 32 21 Edgewood Group, LLC - - - 355087

Frequently Asked Questions about SMP Health – Ave Maria

What neighborhood is SMP Health – Ave Maria in?

SMP Health – Ave Maria is in the Midway Township neighborhood of Jamestown.

Is SMP Health – Ave Maria in a walkable area?

SMP Health – Ave Maria has a walk score of 63. Moderately walkable. Some errands can be accomplished on foot, with a mix of nearby amenities.

How many beds does SMP Health – Ave Maria have?

SMP Health – Ave Maria has 58 beds.

Are there photos of SMP Health – Ave Maria?

Yes — there are 2 photos of SMP Health – Ave Maria in the photo gallery on this page.

What is the address of SMP Health – Ave Maria?

SMP Health – Ave Maria is located at 421 18th Street NE.

What is the phone number of SMP Health – Ave Maria?

(701) 252-6404 will put you in contact with the team at SMP Health – Ave Maria.

Is SMP Health – Ave Maria Medicare or Medicaid certified?

Yes — SMP Health – Ave Maria is a CMS-certified provider of Medicare and Medicaid.

Guides for Better Senior Living

Care Cost Calculator: See Prices in Your Area

Nursing Home Data Explorer

Don’t Wait Too Long: 7 Red Flag Signs Your Parent Needs Assisted Living Now

The True Cost of Assisted Living in 2025 – And How Families Are Paying For It

Understanding Senior Living Costs: Pricing Models, Discounts & Financial Assistance

Explore Open Rooms
1 Contact details
2 What type of senior care service are you looking for?
3 What budget do you have in mind for senior care?
4 How soon do you need to find care?
5 Additional details

Thank you for your interest!

Our team will be in touch shortly to help with next steps.