Solaris Healthcare College Park

Nursing Home · Orlando, FL
CMS overall rating Info The Overall CMS Rating is scored from 1 to 5 stars and combines results from health inspections, staffing levels, and quality measures. Health inspections carry the most weight. Staffing and quality scores can increase or decrease the final rating based on performance compared to state and national standards.
Solaris Healthcare College Park
Nursing Home · Orlando, FL
CMS overall rating Info The Overall CMS Rating is scored from 1 to 5 stars and combines results from health inspections, staffing levels, and quality measures. Health inspections carry the most weight. Staffing and quality scores can increase or decrease the final rating based on performance compared to state and national standards.
Calculator: See prices in your area
Solaris Healthcare College Park accepts Medicare, Medicaid, and private pay.

Overview of Solaris Healthcare College Park

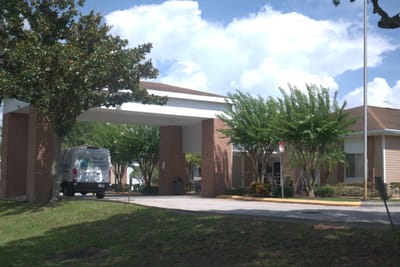
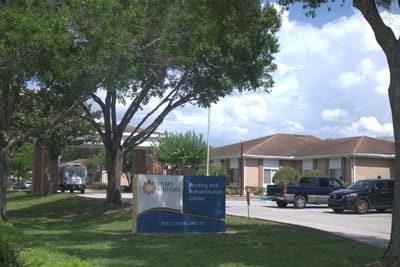
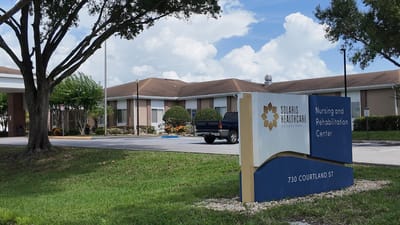
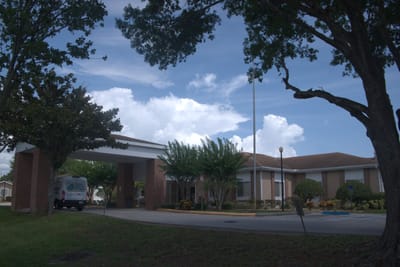
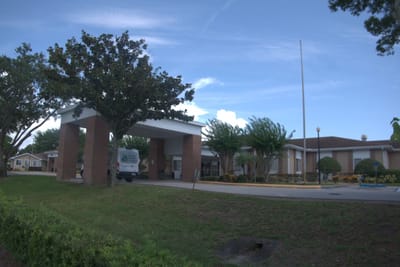
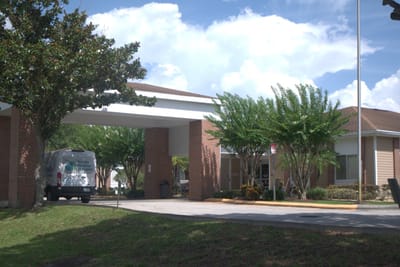
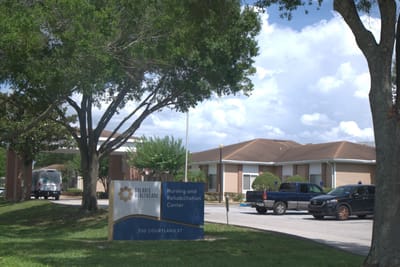
Surrounded by convenient local amenities in Orlando, FL, Solaris Healthcare College Park is an outstanding community offering short-term rehabilitation and long-term care. With a compassionate and highly trained team, residents receive the highest quality of care tailored to their unique needs 24/7. Purposely built and spacious accommodations are also provided in a nurturing and welcoming environment, ensuring residents feel a sense of belonging during their stay.

The community also provides various rehabilitation services, including physical, occupational, speech, and respiratory therapy, to enhance residents’ living experiences. Residents also enjoy a delightful dining experience with delicious and healthy meals. With its wide range of care and extensive amenities, residents experience the best of their golden years without worries. The community serves the residents of Orange County, ensuring accessible healthcare.

(407) 975-3800

Quality ratings

Measured by Centers for Medicare & Medicaid Services (CMS)

Overall rating Info The Overall CMS Rating combines results from health inspections, staffing levels and quality measures. Health inspections carry the most weight. Staffing and quality scores can increase or decrease the final rating based on performance compared to state and national standards.
▼ 37.0% Below FL avg.
Health Inspection Info Based on the results of the facility's three most recent standard inspections and any complaint investigations. CMS reviews the number, scope, and severity of deficiencies, with more recent findings weighted more heavily.
▼ 28.9% Below FL avg.
Staffing Info Measures average nursing staff hours per resident per day, including Registered Nurses (RNs) and total nursing staff. Ratings are adjusted based on the level of care residents require and are compared to state and national benchmarks.
▼ 11.3% Below FL avg.
Quality Measures Info Based on clinical and physical health indicators reported to CMS, such as hospital readmissions, falls, pressure ulcers, and improvements in mobility. These measures reflect how well residents' health needs are being managed.
▼ 1.4% Below FL avg.

Staffing hours breakdown

Info Daily nursing hours per resident by staff type, reported to CMS. Higher is generally better — compare this facility to state and national averages to see where staffing stands.

Hours per resident per day — compared to Florida state averages

Total nursing care / resident Info This home is ranked 114th out of 157 homes in Florida.

Total adjusted nursing hours per resident per day, combining RN, LPN, and aide time. CMS adjusts this for case-mix so facilities can be fairly compared.
3h 41m per day
Rank #114 / 157Nurse hours — state benchmarkedThis home is ranked 114th out of 157 homes in Florida.Shows adjusted nurse hours per resident per day benchmarked to the Florida average, with a ranking across 157 Florida SNFs. More hours mean more direct care. The national average is about 3.5 hrs; below 3.0 is a red flag.
This facility Florida avg (4h 2m per day)
vs Florida avg
-9%

4 of 6 metrics below state avg

Standout metric LPN / LVN is +21% above state avg
Staff typeHours / dayvs state avg
Registered Nurse (RN) Info RNs hold the highest nursing license and can assess residents, interpret test results, and direct care plans. More RN hours per day often signals stronger clinical oversight and faster response to health changes. 32m per day ▼ 27% State avg: 44m per day · National avg: 41m per day
LPN / LVN Info Licensed Practical Nurses (LPNs) or Licensed Vocational Nurses (LVNs) deliver routine hands-on care — medication administration, wound dressing, and monitoring vital signs. They work under RN supervision and make up a large share of daily bedside care. 57m per day ▲ 21% State avg: 47m per day · National avg: 52m per day
Nurse Aide Info Certified Nurse Aides (CNAs) provide the most direct day-to-day assistance: bathing, dressing, feeding, and mobility. Nurse aide hours are typically the largest staffing category and directly affect residents' quality of life. 2h 10m per day ▼ 7% State avg: 2h 20m per day · National avg: 2h 21m per day
Total Nursing (Weekend) Info Combined nursing hours (RN + LPN + Nurse Aide) per resident per day on weekends. Staffing often drops on weekends — this figure reveals whether the facility maintains adequate coverage outside of weekday hours. 3h 18m per day ▼ 6% State avg: 3h 31m per day · National avg: 3h 26m per day
Physical Therapist Info Hours per resident per day provided by licensed Physical Therapists (PTs) or PT Assistants. PT services help residents recover mobility after injury or illness and are especially important for post-acute (short-stay) rehabilitation. 5m per day ■ Avg State avg: 5m per day · National avg: 4m per day
RN (Weekend) Info Registered nurse hours specifically on weekends. Facilities sometimes reduce RN presence on Saturdays and Sundays — a low weekend RN figure compared to weekday hours can indicate reduced clinical oversight when most administrative staff are absent. 21m per day ▼ 34% State avg: 32m per day · National avg: 29m per day

Capacity and availability

This home usually has limited availability

Occupancy between 85% and 95% suggests balanced demand.

Higher occupancy than the Florida average: 84.3%
Occupancy rate 89.8% Rank #69 / 159Occupancy rate — state benchmarkedThis home is ranked 69th out of 159 homes in Florida.Shows this facility's occupancy rate versus the Florida average, with its statewide rank out of 159. Higher occupancy signals strong local demand and financial stability.
Avg. Length of Stay 79 days
Occupancy rate
89.8% Rank #69 / 159Occupancy rate — state benchmarkedThis home is ranked 69th out of 159 homes in Florida.Shows this facility's occupancy rate versus the Florida average, with its statewide rank out of 159. Higher occupancy signals strong local demand and financial stability.
Avg. Length of Stay
79 days

Who this home usually serves

TYPE OF STAY

Mostly long-term care residents

Most residents stay for extended periods and receive ongoing daily care.

Breakdown by payment type

Medicare

35% of new residents, usually for short-term rehab.

Typical stay 22 days

Private pay

11% of new residents, often for short stays.

Typical stay 4 - 5 months

Medicaid

54% of new residents, often for long-term daily care.

Typical stay 3 - 4 months

Finances and operations

Privately-owned community
Operated by a partnership between two or more business owners.
Home revenue
$7.9M
Operating loss
-$1.6M
Privately-owned community Operated by a partnership between two or more business owners.
Home revenue
$7.9M Rank #140 / 160Revenue — state benchmarkedThis home is ranked 140th out of 160 homes in Florida.Shows this facility's annual revenue compared to the Florida SNF average. Higher revenue generally means more resources for staffing and capital — read alongside Payroll %.
Operating loss
-$1.6M
Payroll costs Info The portion of the home's budget spent on staff, including nurses, caregivers, and other employees who support care and operations. Rank #135 / 160Payroll — state benchmarkedThis home is ranked 135th out of 160 homes in Florida.Shows total annual staff payroll benchmarked to the Florida average. Higher payroll investment relative to peers often signals better staffing and less reliance on cheaper contract labor.
$4.7M
60.2% of revenue Rank #43 / 160Payroll % — state benchmarkedThis home is ranked 43rd out of 160 homes in Florida.Shows payroll as a percentage of revenue versus the Florida average. Well-run SNFs often land around 55–65%. Below 25% may signal understaffing or heavy agency use — read with Staffing ratings.
Other operating costs Info All remaining costs needed to run the home, such as food, utilities, building maintenance, supplies and administrative expenses.
$4.7M
Total costs $9.5M
Walk Score
Walk Score: 59 / 100 Rank #45 / 133Walk Score — state benchmarkedThis home is ranked 45th out of 133 homes in Florida.Shows how walkable this facility's neighborhood is compared to the average Walk Score across Florida SNFs. Higher scores benefit residents, families, and staff.
Moderately walkable. Some errands can be accomplished on foot, with a mix of nearby amenities.

About this community

Therapy & Rehabilitation

3 services
Rehabilitation Services
Respite Care
Short-Term Rehab

Staffing & Medical

1 service
24-Hour Staffing

Amenities & Lifestyle

Specific ProgramsLong-term eldercare, Dementia care, Wound care, Palliative care, Hospice services

Dining & Nutrition

Food DescriptionThree delicious meals every day, along with an exquisite Sunday brunch, served restaurant style and prepared by our talented chef and cooks.

What does this home offer?

Housing options icon

Housing Options: Private / Shared Suites

Building type icon
Building type icon

Building Type: Single-story

Dining services icon

Dining Services

Health Programs icon

Health Programs

Wellness Programs icon

Wellness Programs

Housekeeping icon
Housekeeping icon

Housekeeping Services

Types of Care at Solaris Healthcare College Park

Nursing Home

Contact Solaris Healthcare College Park

Health Inspection History

Inspections
Total health inspections 6

Florida average 4.3


Last Health inspection on Jul 2025

Total health citations
21 Rank #95 / 158Health citations — state benchmarkedThis home is ranked 95th out of 158 homes in Florida.Shows this facility's total health deficiency citations benchmarked to the Florida state average, with a ranking across all 158 FL SNFs. Lower citation counts earn a better rank.

Florida average 19.7

Citations per inspection
3.5 Rank #51 / 158Citations per inspection — state benchmarkedThis home is ranked 51st out of 158 homes in Florida.Shows average deficiency citations per CMS inspection for this facility versus the Florida mean across 158 SNFs with citation data. Lower is better.

Florida average 4.48


Health citations are formal notices following inspections when they fail to comply with safety and care standards.

16 of 21 citations resulted from standard inspections; and 5 of 21 resulted from complaint investigations.

Breakdown of citation severity (last 4 years)
Critical Health citations More info
2
150% worse than Florida average

Florida average: 0.8


Serious Health citations More info 1
150% worse than Florida average

Florida average: 0.4

2 critical citations More info Florida average: 0.8

1 serious citation More info Florida average: 0.4

18 moderate citations More info Florida average: 18.4

0 minor citations More info Florida average: 0.2
Citations history (last 4 years)
Abuse/Neglect moderate citation Info Issues related to protecting resident's from harm, including abuse, neglect, or mistreatment. Jul 24, 2025
Corrected

Resident Rights moderate citation Info Issues related to resident's rights, including dignity, privacy, and the ability to make decisions about their care. Jul 24, 2025
Corrected

Resident Rights moderate citation Info Issues related to resident's rights, including dignity, privacy, and the ability to make decisions about their care. May 15, 2025
Corrected

Abuse/Neglect critical citation Info Issues related to protecting resident's from harm, including abuse, neglect, or mistreatment. Dec 04, 2024
Corrected

Financial Assistance for
Nursing Home in Florida

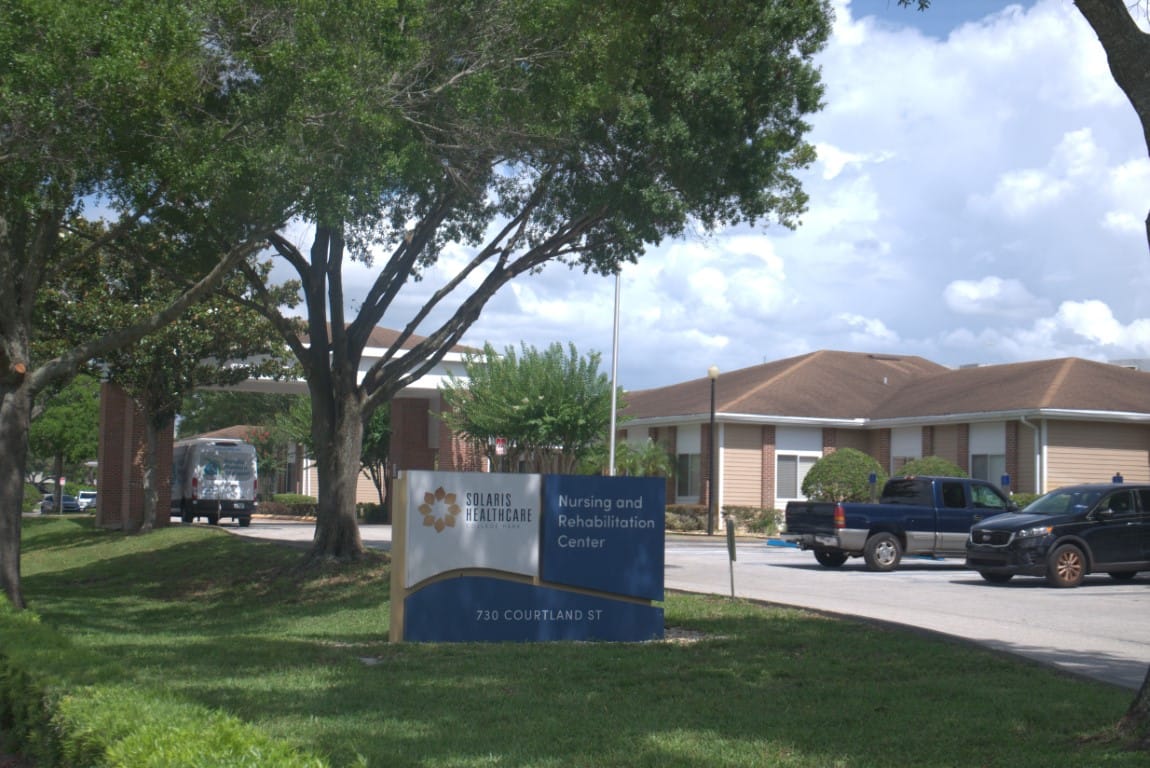
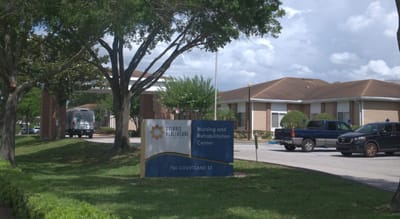
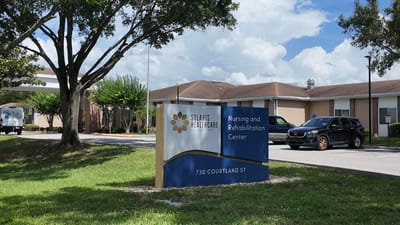
Solaris Healthcare College Park is located in Orlando, Florida.
Here are the financial assistance programs available to residents in Florida.

Get Financial aid guidance

Long-Term Care Waiver

Florida Medicaid LTC Waiver

Age 65+ or 21+ disabled
General Florida resident, Medicaid- eligible, nursing home-level care need.
Income Limits (2025) ~$2,829/month 300% FBR, individual
Asset Limits $2,000 (individual), $3,000 (couple).
FL

High demand; waitlists common.

Benefits
In-home care (6-8 hours/day) Assisted living Respite (240 hours/year) Case management

Community Care for the Elderly (CCE)

Florida CCE

Age 60+
General Florida resident, at risk of nursing home.
Income Limits ~$2,000/month varies
Asset Limits $5,000 individual
FL

Limited funding; regional variation.

Benefits
Homemaker services (3-5 hours/week) Adult day care (~$60/day) Respite (up to 10 days/year)

Home Care for the Elderly (HCE)

Florida Home Care for the Elderly

Age 60+
General Florida resident, at risk of nursing home placement; caregiver must be approved.
Income Limits (2025) ~$2,829/month individual, aligned with Medicaid thresholds
Asset Limits ~$2,000 (individual); varies by case manager discretion.
FL

Limited funding (~3,500 served annually); prioritizes low-income frail seniors.

Benefits
Basic subsidy (~$160/month) for housing/medical costs; special subsidies for supplies/services (e.g., incontinence supplies, ~$50-$200/month)

Program of All-Inclusive Care for the Elderly (PACE)

Florida Medicaid PACE

Age 55+
General Florida resident, nursing home-level care need, safe with PACE support.
Income Limits (2025) ~$2,829/month 300% FBR
Asset Limits $2,000 (individual), $3,000 (couple).
FL

Limited to specific counties (e.g., Hillsborough, Miami-Dade); ~10 sites statewide.

Benefits
Personal care (5-7 hours/day) Medical care Meals Transportation Therapy

Optional State Supplementation (OSS)

Florida Optional State Supplementation

Age 65+ or disabled
General Florida resident, living in approved facility, receiving SSI or low-income.
Income Limits (2025) ~$1,004/month individual, including SSI
Asset Limits $2,000 (individual), $3,000 (couple).
FL

Limited to specific facility types; ~$78.40/month max supplement.

Benefits
Cash payment (~$78.40/month) for room/board or personal needs in facilities

Senior Community Service Employment Program (SCSEP)

Florida SCSEP (federally funded, state-administered)

Age 55+
General unemployed, low-income, Florida resident.
Income Limits (2025) ~$1,983/month 125% FPL, individual
Asset Limits Not specified; income-focused.
FL

Priority for veterans, rural residents; ~1,000 slots/year.

Benefits
Paid training (~20 hours/week at ~$7.25/hour) Job placement

Places of interest near Solaris Healthcare College Park

Address 5.7 miles from city center Info Estimated distance in miles from Orlando's city center to Solaris Healthcare College Park's address, calculated via Google Maps.

Calculate Travel Distance to Solaris Healthcare College Park

Add your location

Address

Staffing Data (Q2 2025)

This data corresponds to Q2 2025 and is based on CMS Payroll-Based Journal.

Total staff 166
Employees 156
Contractors 10
Staff to resident ratio 1.46:1
0% compared with Florida average

Florida average ratio: 1.52:1

Avg staff/day 65
Average shift 7.5 hours
5% worse than Florida average

Florida average: 7.9 hours

Total staff hours (quarter) 44,541
Nursing staff breakdown
Registered Nurse

Manages medical care and health needs.

Total count 17
Average shift length Info Average shift length. Calculated as total hours divided by days worked and average staff per day. 8.4 hours

No contractors work on this role.

Licensed Practical Nurse

Assists with medical care and medications.

Total count 31
Average shift length Info Average shift length. Calculated as total hours divided by days worked and average staff per day. 8 hours

No contractors work on this role.

Certified Nursing Assistant

Helps with daily care and mobility.

Total count 72
Average shift length Info Average shift length. Calculated as total hours divided by days worked and average staff per day. 7.5 hours

No contractors work on this role.

Contractor staffing

Total hours from contractors

3.2%

1,444 contractor hours this quarter

Speech Language Pathologist: 3 Mental Health Service Worker: 2 Physical Therapy Assistant: 1 Occupational Therapy Aide: 1 Respiratory Therapy Technician: 1 Medical Director: 1 Occupational Therapy Assistant: 1
Staff by category
Certified Nursing Assistant7207221,77291100%7.5
Licensed Practical Nurse310319,44391100%8
Registered Nurse170174,29391100%8.4
Dietitian6061,43791100%7.6
Respiratory Therapy Technician7181,2427987%7.7
RN Director of Nursing2029767178%8
Physical Therapy Aide4049657582%7
Speech Language Pathologist2359407684%7.6
Mental Health Service Worker4269136571%6.8
Physical Therapy Assistant3145517987%4.9
Administrator2025286571%8
Clinical Nurse Specialist2025246167%8
Nurse Practitioner1015206571%8
Occupational Therapy Aide0112343235%7.3
Qualified Social Worker3031354145%3.1
Medical Director011521314%4
Occupational Therapy Assistant0111833%6
72 Certified Nursing Assistant
% of Days 100%
31 Licensed Practical Nurse
% of Days 100%
17 Registered Nurse
% of Days 100%
6 Dietitian
% of Days 100%
8 Respiratory Therapy Technician
% of Days 87%
2 RN Director of Nursing
% of Days 78%
4 Physical Therapy Aide
% of Days 82%
5 Speech Language Pathologist
% of Days 84%
6 Mental Health Service Worker
% of Days 71%
4 Physical Therapy Assistant
% of Days 87%
2 Administrator
% of Days 71%
2 Clinical Nurse Specialist
% of Days 67%
1 Nurse Practitioner
% of Days 71%
1 Occupational Therapy Aide
% of Days 35%
3 Qualified Social Worker
% of Days 45%
1 Medical Director
% of Days 14%
1 Occupational Therapy Assistant
% of Days 3%

Facility Characteristics

Source: CMS Long-Term Care Facility Characteristics (Data as of Jan 2026)

Total residents 114
Medicare
14
12.3% of residents
Medicaid
73
64% of residents
Private pay or other
27
23.7% of residents
Programs & Services
Residents Group

Residents meet regularly to discuss policies, care quality, and activities

Active Resident Council

Organized group of residents that meets regularly to discuss facility policies, quality of life, and activities.

Quality of care over time

These measures show how residents usually do over time at this home, based on health outcomes and preventive care.

High-risk clinical events score Info A composite score based on pressure ulcers, falls with injury, weight loss, walking ability decline, and activities of daily living decline. 8.3
12% worse than Florida average

Florida average: 7.4

Functional decline score Info A composite score based on activities of daily living decline, walking ability decline, and incontinence. 13.8
11% worse than Florida average

Florida average: 12.4

Long-stay resident measures
Significantly above average Info CMS star rating based on long-stay quality measure performance. 5 stars = significantly above average, 1 star = significantly below average.
Need for Help with Daily Activities Increased Info Percent of long-stay residents whose need for help with daily activities has increased 7.1%
33% better than Florida average

Florida average: 10.5%

Walking Ability Worsened Info Percent of long-stay residents whose ability to move independently worsened 25.9%
100% worse than Florida average

Florida average: 12.9%

Low Risk Residents with Bowel/Bladder Incontinence Info Percent of low risk long-stay residents who lose control of their bowels or bladder 8.5%
37% better than Florida average

Florida average: 13.5%

Falls with Major Injury Info Percent of long-stay residents experiencing one or more falls with major injury 2.6%
In line with Florida average

Florida average: 2.6%

High Risk Residents with Pressure Ulcers Info Percent of long-stay high risk residents with pressure ulcers 3.9%
27% better than Florida average

Florida average: 5.4%

Urinary Tract Infection Info Percent of long-stay residents with a urinary tract infection 1.4%
56% worse than Florida average

Florida average: 0.9%

Lost Too Much Weight Info Percent of long-stay residents who lose too much weight 1.9%
68% better than Florida average

Florida average: 6.0%

Depressive Symptoms Info Percent of long-stay residents who have depressive symptoms 4.1%
21% worse than Florida average

Florida average: 3.3%

Antipsychotic Use Info Percent of long-stay residents who received an antipsychotic medication 6.1%
24% better than Florida average

Florida average: 8.0%

Pneumococcal Vaccine Info Percent of long-stay residents assessed and appropriately given the pneumococcal vaccine 100.0%
In line with Florida average

Florida average: 97.7%

Influenza Vaccine Info Percent of long-stay residents assessed and appropriately given the seasonal influenza vaccine 100.0%
In line with Florida average

Florida average: 99.2%

Hospitalizations per 1,000 days Info Number of hospitalizations per 1,000 long-stay resident days. 2.86
36% worse than Florida average

Florida average: 2.10

ED visits per 1,000 days Info Number of outpatient emergency department visits per 1,000 long-stay resident days. 1.25
6% worse than Florida average

Florida average: 1.18

Short-stay resident measures
Below average Info CMS star rating based on short-stay quality measure performance. 5 stars = much above average, 1 star = much below average.
Pneumococcal Vaccine Info Percent of short-stay residents assessed and appropriately given the pneumococcal vaccine 92.6%
In line with Florida average

Florida average: 94.0%

Antipsychotic medication increase Info Percent of short-stay residents who newly received an antipsychotic medication 0.8%
44% better than Florida average

Florida average: 1.5%

Influenza Vaccine Info Percent of short-stay residents assessed and appropriately given the seasonal influenza vaccine 95.6%
In line with Florida average

Florida average: 94.7%

Re-hospitalized after SNF stay Info Percentage of short-stay residents who were re-hospitalized after their nursing home admission. 23.6%
10% better than Florida average

Florida average: 26.2%

Emergency department visits Info Percentage of short-stay residents who had an outpatient emergency department visit. 9.7%
In line with Florida average

Florida average: 9.3%

Falls with major injury Info Percentage of SNF residents who experience falls with major injury during their stay. 0.6%
21% better than Florida average

Florida average: 0.8%

Ability to care for self at discharge Info Percentage of residents at or above expected ability to care for themselves at discharge. 29.8%
44% worse than Florida average

Florida average: 53.7%

Successful return to home or community Info Rate of successful return to home or community from a skilled nursing facility. 50.7%
In line with Florida average

Florida average: 50.6%

Penalties and fines

Federal penalties imposed by CMS for regulatory violations, including civil money penalties (fines) and denials of payment for new Medicare/Medicaid admissions.

Source: CMS Penalties Database (Data as of Jan 2026)

Total fines amount $47K
35% lower than Florida average

Florida average: $72K

Number of fines 3
14% more fines than Florida average

Florida average: 2.6

Payment Denials Info Serious action where Medicare and/or Medicaid temporarily stops payments for new residents until issues are fixed. 0
100% fewer payment denials than Florida average

Florida average: 0.1

Fines amount comparison
This facility $47K
Florida average $72K
Penalty History

Penalties are imposed by CMS for violations of federal nursing home regulations.

3 penalties in the past 3 years

Multiple penalties were reported in the last 3 years.

Civil Money Penalty Info Fines imposed for noncompliance, which can be assessed per day or per instance of violation. Dec 4, 2024
$8K
Civil Money Penalty Info Fines imposed for noncompliance, which can be assessed per day or per instance of violation. Dec 4, 2024
$8K
Civil Money Penalty Info Fines imposed for noncompliance, which can be assessed per day or per instance of violation. Sep 14, 2023
$30K

Last updated: Jan 2026

Compare Nursing Home around Orlando The information below is reported by the Florida Agency for Health Care Administration (AHCA).

5 facilities compared · CMS & FL Dept. of Health data · Updated May 2026

Filter by care type
Coastal Health and Rehabilitation Center
NH

Nursing Home Licensed facility providing 24/7 skilled nursing care for residents with complex, ongoing medical needs. Staffed by RNs, LPNs, and CNAs. Inspected and star-rated annually by CMS. Accepts Medicare (short-term rehab) and Medicaid (long-term care).

AL

Assisted Living A licensed, long-term care setting for seniors or individuals with disabilities who need help with daily activities — like bathing, dressing, and medication management — but not 24-hour skilled nursing. Offers housing, meals, and around-the-clock support while aiming to maximize resident independence.

Daytona Beach (Medical Center)120 89.9% +7%4.02 -58%0%0153.0-111A+ 35 Coastal Center Operations Holdings Llc$12.1M$5.6M46.4%105565
Delaney Park Health and Rehabilitation Center
NH

Nursing Home Licensed facility providing 24/7 skilled nursing care for residents with complex, ongoing medical needs. Staffed by RNs, LPNs, and CNAs. Inspected and star-rated annually by CMS. Accepts Medicare (short-term rehab) and Medicaid (long-term care).

AL

Assisted Living A licensed, long-term care setting for seniors or individuals with disabilities who need help with daily activities — like bathing, dressing, and medication management — but not 24-hour skilled nursing. Offers housing, meals, and around-the-clock support while aiming to maximize resident independence.

Orlando (Lake Copeland)89 90.9% +8%3.02 +74%-25%1234.6284- 66 Mines, Matthew$15.3M$4.8M31.6%105791
Daytona Beach Health and Rehabilitation Center
NH

Nursing Home Licensed facility providing 24/7 skilled nursing care for residents with complex, ongoing medical needs. Staffed by RNs, LPNs, and CNAs. Inspected and star-rated annually by CMS. Accepts Medicare (short-term rehab) and Medicaid (long-term care).

AL

Assisted Living A licensed, long-term care setting for seniors or individuals with disabilities who need help with daily activities — like bathing, dressing, and medication management — but not 24-hour skilled nursing. Offers housing, meals, and around-the-clock support while aiming to maximize resident independence.

Daytona Beach180 78.3% -7%4.97 -33%+23%1163.24143- 51 Mathes, Loretta$16.1M$7.8M48.6%105311
Solaris Healthcare College Park
NH

Nursing Home Licensed facility providing 24/7 skilled nursing care for residents with complex, ongoing medical needs. Staffed by RNs, LPNs, and CNAs. Inspected and star-rated annually by CMS. Accepts Medicare (short-term rehab) and Medicaid (long-term care).

AL

Assisted Living A licensed, long-term care setting for seniors or individuals with disabilities who need help with daily activities — like bathing, dressing, and medication management — but not 24-hour skilled nursing. Offers housing, meals, and around-the-clock support while aiming to maximize resident independence.

Orlando (Lake Fairview)120 89.8% +7%3.68 -14%-9%3213.53115- 59 Orlando North Snf Operations Holdings Llc$7.9M$3.8M48.2%106024
Guardian Care Nursing & Rehabilitation Center
NH

Nursing Home Licensed facility providing 24/7 skilled nursing care for residents with complex, ongoing medical needs. Staffed by RNs, LPNs, and CNAs. Inspected and star-rated annually by CMS. Accepts Medicare (short-term rehab) and Medicaid (long-term care).

AL

Assisted Living A licensed, long-term care setting for seniors or individuals with disabilities who need help with daily activities — like bathing, dressing, and medication management — but not 24-hour skilled nursing. Offers housing, meals, and around-the-clock support while aiming to maximize resident independence.

Orlando (Southwest Orlando)99 93.1% +10%3.91 +4%-3%1196.3194- 39 Abrahams, Eloise$11.2M$5.3M47.8%105797

Guides for Better Senior Living

Care Cost Calculator: See Prices in Your Area

Nursing Home Data Explorer

Don’t Wait Too Long: 7 Red Flag Signs Your Parent Needs Assisted Living Now

The True Cost of Assisted Living in 2025 – And How Families Are Paying For It

Understanding Senior Living Costs: Pricing Models, Discounts & Financial Assistance

Frequently Asked Questions about Solaris Healthcare College Park

What neighborhood is Solaris Healthcare College Park in?

Solaris Healthcare College Park is in the Lake Fairview neighborhood.

Is Solaris Healthcare College Park in a walkable area?

Solaris Healthcare College Park has a walk score of 59. Moderately walkable. Some errands can be accomplished on foot, with a mix of nearby amenities.

What is the address of Solaris Healthcare College Park?

Solaris Healthcare College Park is located at 730 Courtland St, Orlando, FL 32804, United States.

What is the phone number of Solaris Healthcare College Park?

(407) 975-3800 will put you in contact with the team at Solaris Healthcare College Park.

Is Solaris Healthcare College Park Medicare or Medicaid certified?

Yes — Solaris Healthcare College Park is a CMS-certified provider of Medicare and Medicaid.

Explore Open Rooms
1 Contact details
2 What type of senior care service are you looking for?
3 What budget do you have in mind for senior care?
4 How soon do you need to find care?
5 Additional details

Thank you for your interest!

Our team will be in touch shortly to help with next steps.