Explore Open Rooms

1 Contact details
2 What type of senior care service are you looking for?
3 What budget do you have in mind for senior care?
4 How soon do you need to find care?
5 Additional details

Thank you for your interest!

Our team will be in touch shortly to help with next steps.

Nursing Home in Roanoke

CMS overall rating Info The Overall CMS Rating combines results from health inspections, staffing levels and quality measures. Health inspections carry the most weight. Staffing and quality scores can increase or decrease the final rating based on performance compared to state and national standards.

South Roanoke Nursing and Rehabilitation

3823 Franklin Rd SW, Roanoke, VA 24014 View map
Overview of South Roanoke Nursing and Rehabilitation

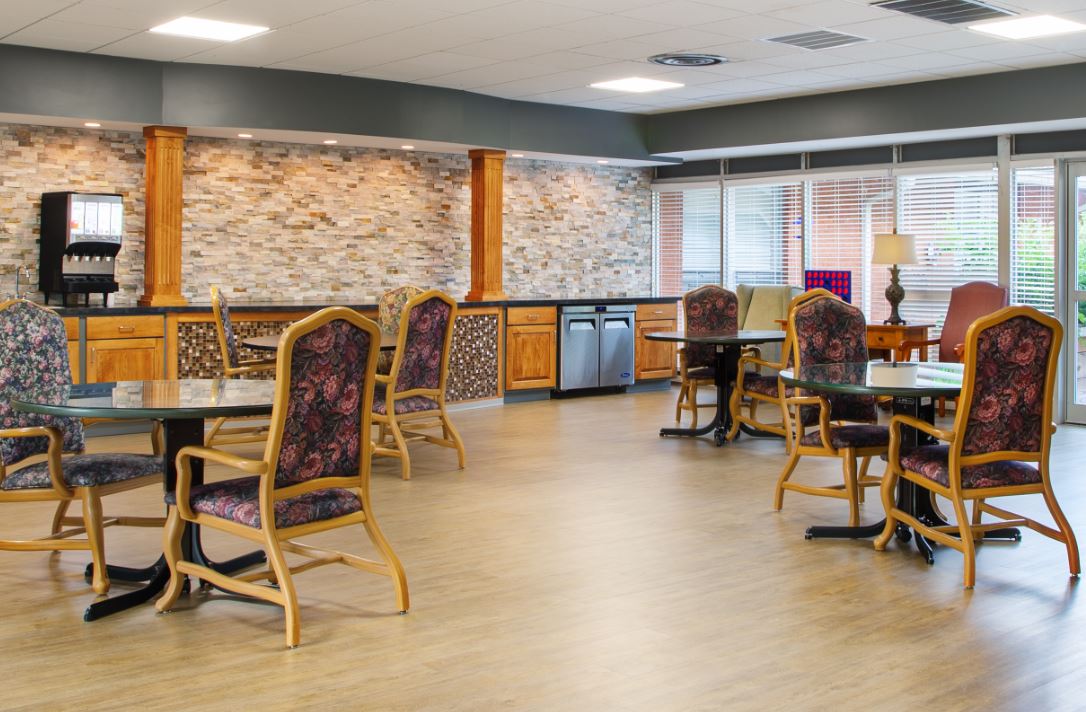
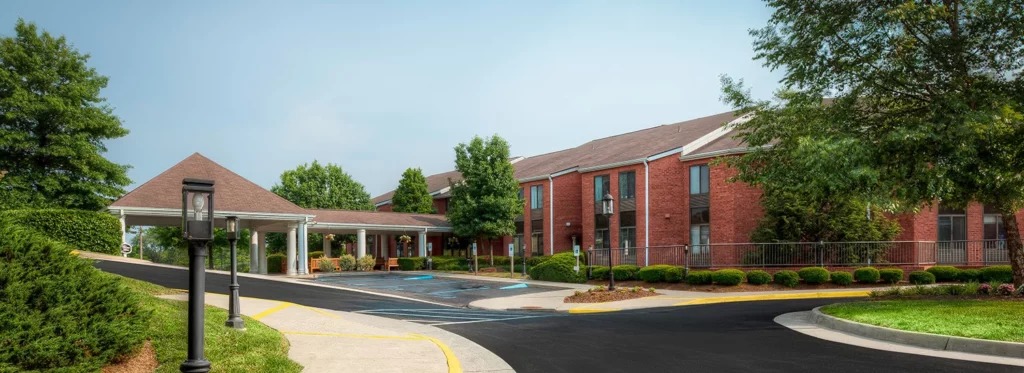
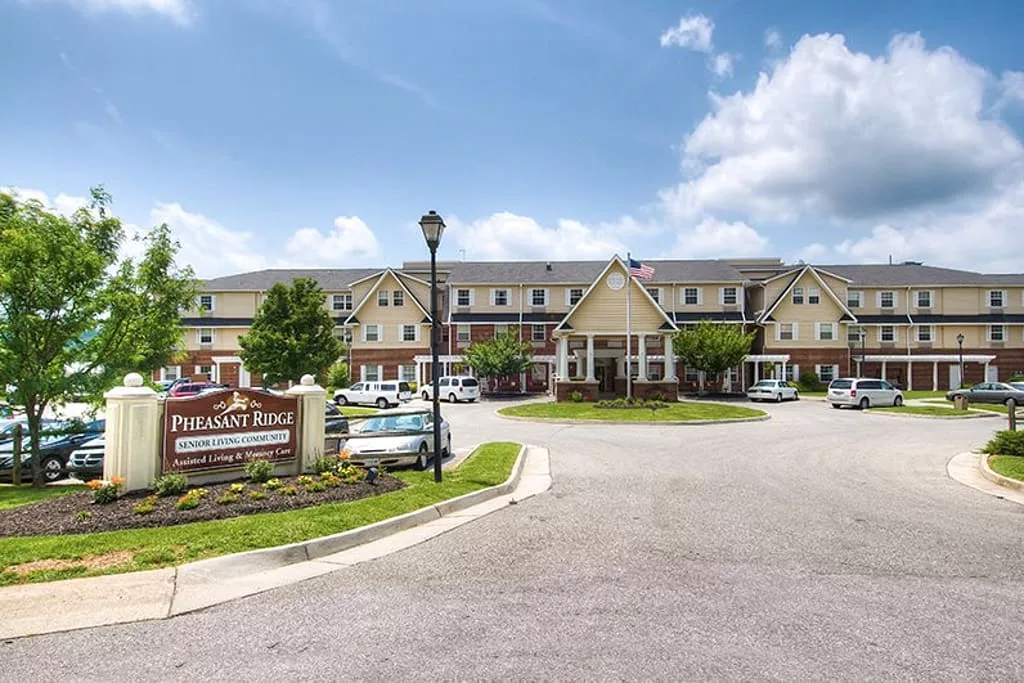
Providing top-tier care since 1964, South Roanoke Nursing and Rehabilitation located in the serene community of Franklin Road, South West Roanoke, VA, focuses on rehabilitation, skilled care, long-term care, and respite. The community promises a comfortable and safe residence while receiving the utmost attention for their needs. Spend a relaxing time within the beautiful grounds with heartwarming individuals. South Roanoke Nursing and Rehabilitation is dedicated to giving seniors a warm and welcoming environment during their healing journey.

South Roanoke Nursing and Rehabilitation takes pride in a team of reliable and highly skilled professionals, who deliver exceptional care and support. With its stunning amenities and peaceful surroundings, seniors enjoy leisure while maintaining their well-being. The community is a safe place for seniors to thrive and reach their full potential.

(540) 344-4325

Quality ratings

Measured by Centers for Medicare & Medicaid Services (CMS)

Overall rating Info The Overall CMS Rating combines results from health inspections, staffing levels and quality measures. Health inspections carry the most weight. Staffing and quality scores can increase or decrease the final rating based on performance compared to state and national standards.
3/5
Virginia average: 3.8/5
Health Inspection Info Based on the results of the facility's three most recent standard inspections and any complaint investigations. CMS reviews the number, scope, and severity of deficiencies, with more recent findings weighted more heavily.
2/5
Virginia average: 3.4/5
Staffing Info Measures average nursing staff hours per resident per day, including Registered Nurses (RNs) and total nursing staff. Ratings are adjusted based on the level of care residents require and are compared to state and national benchmarks.
2/5
Virginia average: 3.6/5
Quality Measures Info Based on clinical and physical health indicators reported to CMS, such as hospital readmissions, falls, pressure ulcers, and improvements in mobility. These measures reflect how well residents' health needs are being managed.
5/5
Virginia average: 4.0/5

Nursing care per resident

Info This shows how many total hours of nursing staff time are available per resident each day. Higher numbers usually mean more staff support.
3h 22m per day

This home provides 30% less nursing time per resident than the Virginia average.

Virginia average: 4h 47m per day

Staffing hours breakdown

Info Hours of care per resident per day, broken down by staff type. Data from CMS Medicare.
Staff type Facility State avg National avg
Registered Nurse (RN) Info Registered nurse hours per resident per day. 31m per day 41m per day 41m per day
Nurse Aide Info Nurse aide hours per resident per day. 1h 55m per day 2h 8m per day 2h 21m per day
Total Nursing (Weekend) Info Total number of nurse staff hours per resident per day on weekends. 2h 48m per day 3h 19m per day 3h 26m per day
Physical Therapist Info Physical therapist staff hours per resident per day. 2m per day 5m per day 4m per day
RN (Weekend) Info Registered nurse hours per resident per day on weekends. 22m per day 28m per day 29m per day

Capacity and availability

Smaller home

May offer a more intimate, personalized care environment.

Total beds 98

This home usually has limited availability

Occupancy is moderate, suggesting balanced demand.

Similar demand to the Virginia average
Occupancy rate 85.7%
Residents per day (avg) 85
Occupancy rate
85.7%
Residents per day (avg)
85

Who this home usually serves

TYPE OF STAY

Primarily short stays

Residents typically stay for brief periods, with frequent admissions and discharges throughout the year.

Might be optimal for
Post-acute recovery Temporary care Transitional stays

Breakdown by payment type

Medicare

29% of new residents, usually for short-term rehab.

Typical stay 1 - 2 months

Private pay

66% of new residents, often for short stays.

Typical stay 4 - 5 months

Medicaid

5% of new residents, often for long-term daily care.

Typical stay 7 - 8 years

Finances and operations

Privately-owned community
Operated by a business corporation.
Home revenue
$10.6M
Operating loss
-$307.0K
Privately-owned community Operated by a business corporation.
Home revenue
$10,572,126.00
Operating loss
$-306,983.00
Payroll costs Info The portion of the home's budget spent on staff, including nurses, caregivers, and other employees who support care and operations.
$4.5M
42.6% of revenue
Other operating costs Info All remaining costs needed to run the home, such as food, utilities, building maintenance, supplies and administrative expenses.
$6.4M
Total costs $10.9M
Walk Score
Walk Score: 45 / 100
Somewhat walkable. A few nearby services may be reachable on foot, but most trips require transportation.
BBB Rating
BBB Rating: A+ (Not Accredited)
An independent rating from the Better Business Bureau based on factors such as complaint history, transparency, and business practices.
How BBB ratings work

Additional Licensing Details

CMS Certification Number495002

Staffing

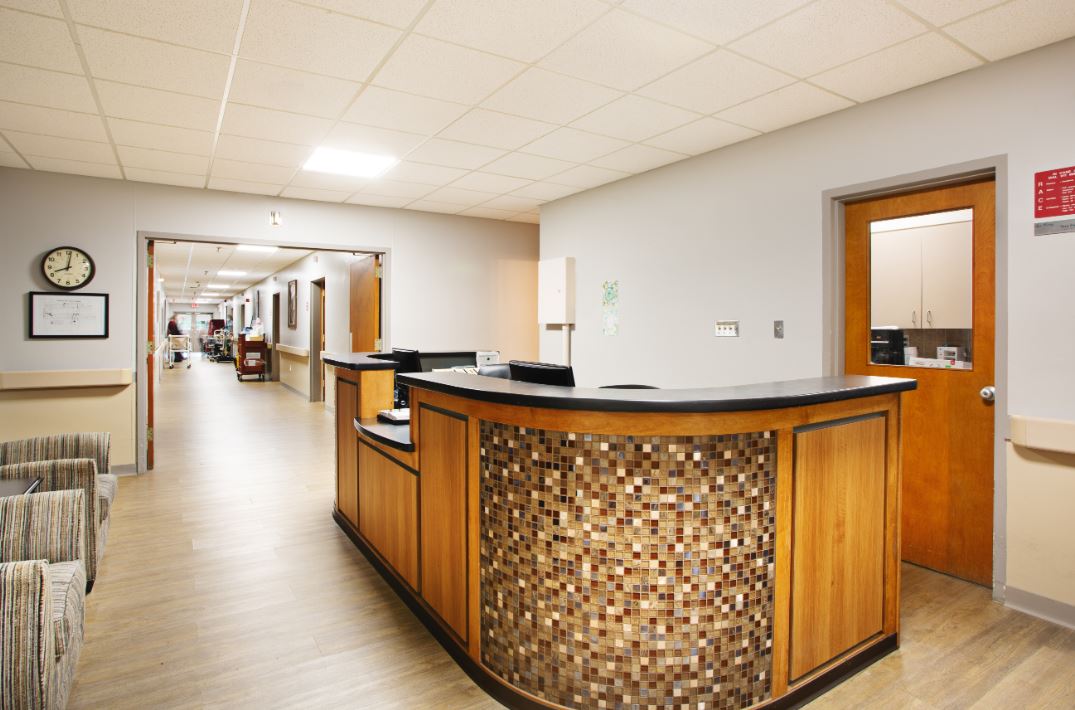
Key information about the people who lead and staff this community.

Leadership

ContactMr. Walker Champney, Administrator

What does this home offer?

Housing options icon

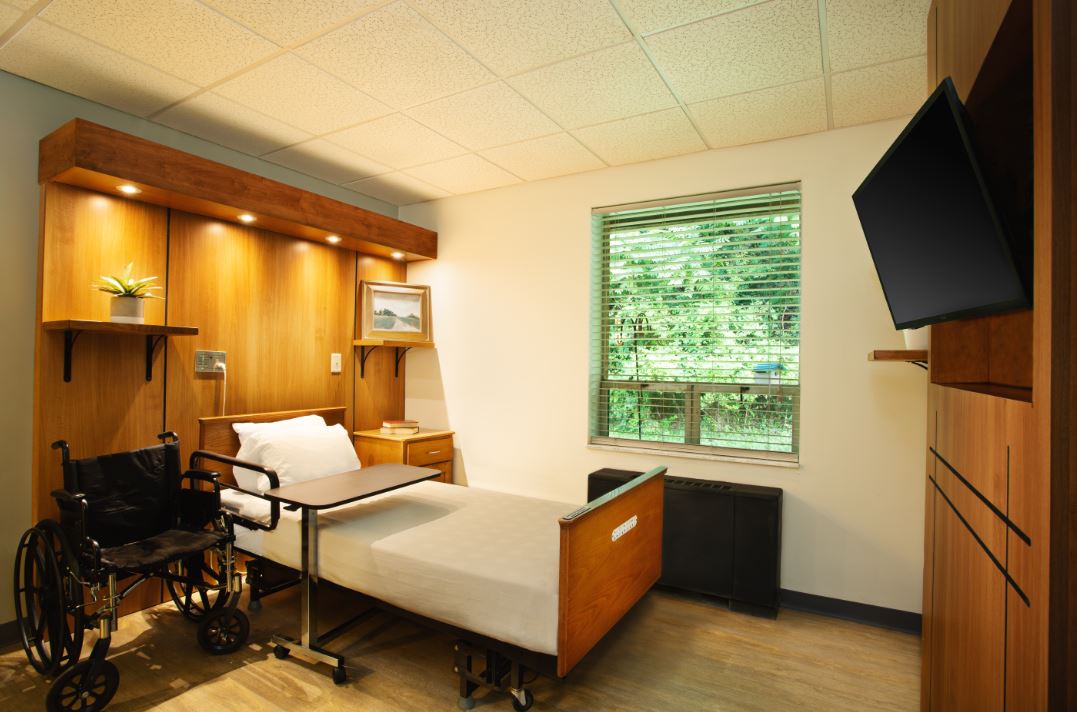
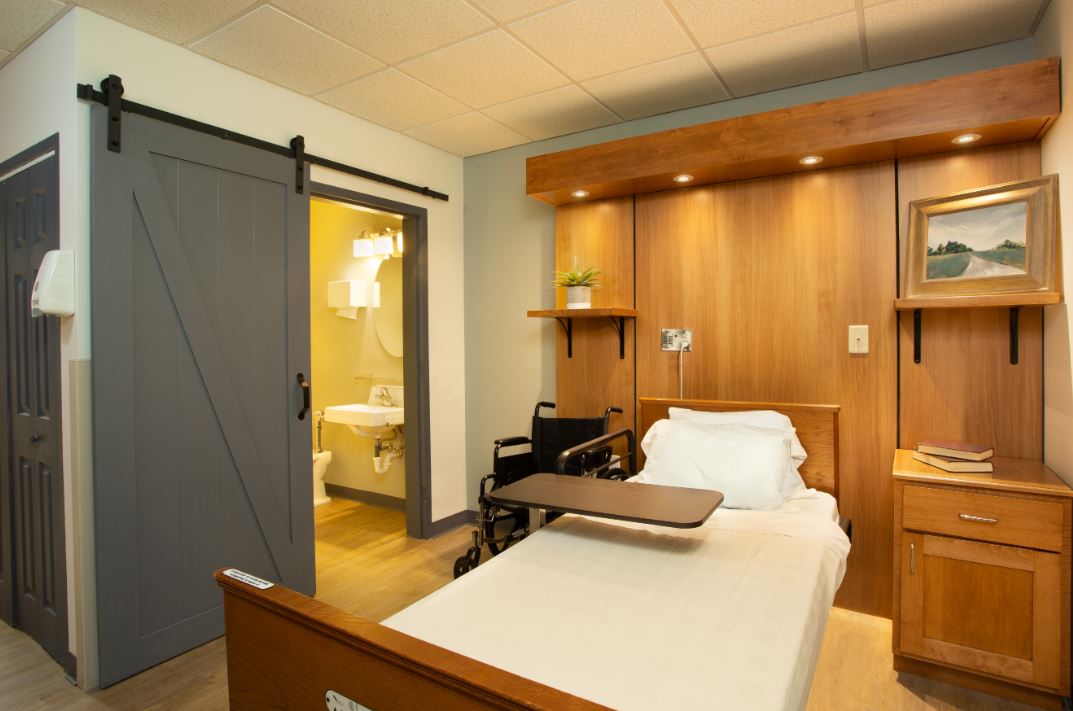
Housing Options: Private Rooms

Building type icon
Building type icon

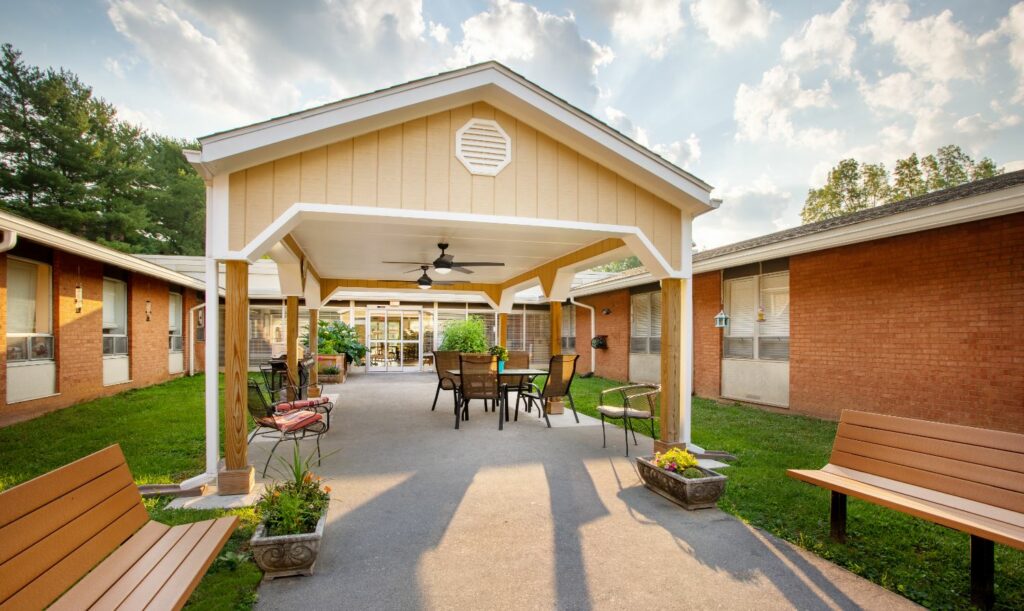
Building Type: Single-story

Fitness and recreation icon

Fitness and Recreation

Types of Care at South Roanoke Nursing and Rehabilitation

Nursing Home

Inspection History

In Virginia, the Department of Social Services (for assisted living facilities) and the Department of Health (for nursing homes) perform the inspections required to maintain state and federal licensing.

Health Inspection History

Inspections
Total health inspections 3

Virginia average 4.2


Last Health inspection on Apr 2025

Total health citations 39

Virginia average 38.4

Citations per inspection
13

Virginia average 8.93


Health citations are formal notices following inspections when they fail to comply with safety and care standards.

All 39 citations resulted from standard inspections.

Breakdown of citation severity (last 3 years)
Critical Health citations More info 0
100% better than Virginia average

Virginia average: 0.4


Serious Health citations More info 0
100% better than Virginia average

Virginia average: 1

0 critical citations More info Virginia average: 0.4

0 serious citations More info Virginia average: 1

39 moderate citations More info Virginia average: 36.3

0 minor citations More info Virginia average: 0.8
Citations history (last 3 years)
Environmental moderate citation Info Issues related to building safety, cleanliness, maintenance, and overall living conditions. Apr 24, 2025
Corrected

Nutrition moderate citation Info Issues related to food quality, meal service, and resident's nutritional needs. Apr 24, 2025
Corrected

Quality of Care moderate citation Info Issues related to how well residents receive appropriate treatment and support for their medical and daily care needs. Apr 24, 2025
Corrected

Quality of Care moderate citation Info Issues related to how well residents receive appropriate treatment and support for their medical and daily care needs. Apr 24, 2025
Corrected

Compare Nursing Homes around Roanoke The information below is reported by the Virginia Department of Social Services and Department of Health.

3 facilities compared · CMS & VA Dept. of Health data · Updated Apr 2026

Filter by care type
Our Lady of the Valley
AL

Assisted Living A licensed, long-term care setting for seniors or individuals with disabilities who need help with daily activities — like bathing, dressing, and medication management — but not 24-hour skilled nursing. Offers housing, meals, and around-the-clock support while aiming to maximize resident independence.

IL

Independent Living Lifestyle-focused communities for older adults offering dining, activities, and transportation with minimal personal care. Best for active, independent seniors who want community without medical support.

MC

Memory Care Secured, specialized care for people living with Alzheimer's or dementia. Staff trained in cognitive impairment, with higher staff-to-resident ratios and an environment designed to reduce confusion and wandering risk.

NH

Nursing Home Licensed facility providing 24/7 skilled nursing care for residents with complex, ongoing medical needs. Staffed by RNs, LPNs, and CNAs. Inspected and star-rated annually by CMS. Accepts Medicare (short-term rehab) and Medicaid (long-term care).

Roanoke (Gainsboro)
189
88.2%
+3%
3.79
-15%
+1%
0
14
4.7
0
65
A+
68
Rawlings, David
$16.4M
$6.7M
40.9%
495357
Private Rooms
South Roanoke Nursing and Rehabilitation
NH

Nursing Home Licensed facility providing 24/7 skilled nursing care for residents with complex, ongoing medical needs. Staffed by RNs, LPNs, and CNAs. Inspected and star-rated annually by CMS. Accepts Medicare (short-term rehab) and Medicaid (long-term care).

Roanoke
98
85.7%
0%
3.36
-15%
-10%
0
39
13.0
0
85
A+
45
American Healthcare Llc
$10.6M
$4.5M
42.7%
495002
Private Rooms
Pheasant Ridge Nursing and Rehab Center
AL

Assisted Living A licensed, long-term care setting for seniors or individuals with disabilities who need help with daily activities — like bathing, dressing, and medication management — but not 24-hour skilled nursing. Offers housing, meals, and around-the-clock support while aiming to maximize resident independence.

IL

Independent Living Lifestyle-focused communities for older adults offering dining, activities, and transportation with minimal personal care. Best for active, independent seniors who want community without medical support.

MC

Memory Care Secured, specialized care for people living with Alzheimer's or dementia. Staff trained in cognitive impairment, with higher staff-to-resident ratios and an environment designed to reduce confusion and wandering risk.

NH

Nursing Home Licensed facility providing 24/7 skilled nursing care for residents with complex, ongoing medical needs. Staffed by RNs, LPNs, and CNAs. Inspected and star-rated annually by CMS. Accepts Medicare (short-term rehab) and Medicaid (long-term care).

Roanoke
101
89.3%
+4%
3.56
-2%
-5%
13
25
6.3
1
89
A+
15
Bell, Victor
$14.0M
$4.6M
32.5%
495325
Private Rooms

Places of interest near South Roanoke Nursing and Rehabilitation

Address 3.4 miles from city center — 1.86 miles to nearest hospital (Carilion Clinic Aortic Center - Roanoke)

Address 3823 Franklin Rd SW, Roanoke, VA 24014

Calculate Travel Distance to South Roanoke Nursing and Rehabilitation

Add your location

Address

Staffing Data (Q2 2025)

This data corresponds to Q2 2025 and is based on CMS Payroll-Based Journal.

Total staff 115
Employees 96
Contractors 19
Staff to resident ratio 1.35:1
19% worse than Virginia average

Virginia average ratio: 1.67:1

Avg staff/day 41
Average shift 8 hours
0% compared with Virginia average

Virginia average: 8 hours

Total staff hours (quarter) 29,680
Nursing staff breakdown
Registered Nurse

Manages medical care and health needs.

Total count 9
Average shift length Info Average shift length. Calculated as total hours divided by days worked and average staff per day. 8.4 hours

No contractors work on this role.

Licensed Practical Nurse

Assists with medical care and medications.

Total count 17
Average shift length Info Average shift length. Calculated as total hours divided by days worked and average staff per day. 8.7 hours

No contractors work on this role.

Certified Nursing Assistant

Helps with daily care and mobility.

Total count 57
Average shift length Info Average shift length. Calculated as total hours divided by days worked and average staff per day. 8.2 hours

No contractors work on this role.

Contractor staffing

Total hours from contractors

8.1%

2,394 contractor hours this quarter

Respiratory Therapy Technician: 4 Physical Therapy Aide: 4 Speech Language Pathologist: 4 Qualified Social Worker: 4 Occupational Therapy Assistant: 1 Physical Therapy Assistant: 1 Occupational Therapy Aide: 1
Staff by category
Certified Nursing Assistant5705714,70091100%8.2
Licensed Practical Nurse170175,64591100%8.7
Registered Nurse9092,54491100%8.4
RN Director of Nursing2029987481%7.7
Physical Therapy Aide0449757279%7.4
Clinical Nurse Specialist4046406470%7.8
Speech Language Pathologist0445277077%6.9
Dietitian1015106875%7.5
Mental Health Service Worker1015106571%7.8
Other Dietary Services Staff1015036875%7.4
Nurse Practitioner1014786167%7.8
Administrator1014565763%8
Nurse Aide in Training2023033741%7.4
Qualified Social Worker0442804145%6.8
Respiratory Therapy Technician0442664651%5.8
Physical Therapy Assistant0112085156%4.1
Occupational Therapy Aide011873134%2.8
Occupational Therapy Assistant011511719%3
57 Certified Nursing Assistant
% of Days 100%
17 Licensed Practical Nurse
% of Days 100%
9 Registered Nurse
% of Days 100%
2 RN Director of Nursing
% of Days 81%
4 Physical Therapy Aide
% of Days 79%
4 Clinical Nurse Specialist
% of Days 70%
4 Speech Language Pathologist
% of Days 77%
1 Dietitian
% of Days 75%
1 Mental Health Service Worker
% of Days 71%
1 Other Dietary Services Staff
% of Days 75%
1 Nurse Practitioner
% of Days 67%
1 Administrator
% of Days 63%
2 Nurse Aide in Training
% of Days 41%
4 Qualified Social Worker
% of Days 45%
4 Respiratory Therapy Technician
% of Days 51%
1 Physical Therapy Assistant
% of Days 56%
1 Occupational Therapy Aide
% of Days 34%
1 Occupational Therapy Assistant
% of Days 19%

Facility Characteristics

Source: CMS Long-Term Care Facility Characteristics (Data as of Jan 2026)

Total census
85 residents
Residents by payment source
Medicare
5 residents (5.9%)
Medicaid
50 residents (58.8%)
Private pay or other
30 residents (35.3%)
Programs & Services
Residents' Group

Residents meet regularly to discuss policies, care quality, and activities

Family Member Group

Family members meet regularly to discuss policies, care quality, and activities

Active Family Council

Organized group of family members that meets regularly to discuss facility policies, resident care, and activities.

Active Resident Council

Organized group of residents that meets regularly to discuss facility policies, quality of life, and activities.

Quality of care over time

These measures show how residents usually do over time at this home, based on health outcomes and preventive care.

High-risk clinical events score Info A composite score based on pressure ulcers, falls with injury, weight loss, walking ability decline, and activities of daily living decline. 8.4
17% better than Virginia average

Virginia average: 10.1

Functional decline score Info A composite score based on activities of daily living decline, walking ability decline, and incontinence. 18.1
8% better than Virginia average

Virginia average: 19.7

Long-stay resident measures
Significantly above average Virginia avg: 4.3 Info CMS star rating based on long-stay quality measure performance. 5 stars = significantly above average, 1 star = significantly below average.
Need for Help with Daily Activities Increased Info Percent of long-stay residents whose need for help with daily activities has increased 15.6%
7% better than Virginia average

Virginia average: 16.8%

Walking Ability Worsened Info Percent of long-stay residents whose ability to move independently worsened 17.7%
11% better than Virginia average

Virginia average: 19.7%

Low Risk Residents with Bowel/Bladder Incontinence Info Percent of low risk long-stay residents who lose control of their bowels or bladder 21.2%
6% better than Virginia average

Virginia average: 22.6%

Falls with Major Injury Info Percent of long-stay residents experiencing one or more falls with major injury 1.3%
64% better than Virginia average

Virginia average: 3.6%

High Risk Residents with Pressure Ulcers Info Percent of long-stay high risk residents with pressure ulcers 2.2%
59% better than Virginia average

Virginia average: 5.4%

Urinary Tract Infection Info Percent of long-stay residents with a urinary tract infection 0.3%
79% better than Virginia average

Virginia average: 1.5%

Lost Too Much Weight Info Percent of long-stay residents who lose too much weight 5.2%
12% better than Virginia average

Virginia average: 5.9%

Depressive Symptoms Info Percent of long-stay residents who have depressive symptoms 3.5%
77% better than Virginia average

Virginia average: 14.9%

Antipsychotic Use Info Percent of long-stay residents who received an antipsychotic medication 4.6%
65% better than Virginia average

Virginia average: 12.9%

Pneumococcal Vaccine Info Percent of long-stay residents assessed and appropriately given the pneumococcal vaccine 97.4%
7% better than Virginia average

Virginia average: 91.3%

Influenza Vaccine Info Percent of long-stay residents assessed and appropriately given the seasonal influenza vaccine 96.6%
In line with Virginia average

Virginia average: 94.0%

Hospitalizations per 1,000 days Info Number of hospitalizations per 1,000 long-stay resident days. 0.91
38% better than Virginia average

Virginia average: 1.46

ED visits per 1,000 days Info Number of outpatient emergency department visits per 1,000 long-stay resident days. 0.49
65% better than Virginia average

Virginia average: 1.41

Short-stay resident measures
Significantly above average Virginia avg: 4.0 Info CMS star rating based on short-stay quality measure performance. 5 stars = much above average, 1 star = much below average.
Pneumococcal Vaccine Info Percent of short-stay residents assessed and appropriately given the pneumococcal vaccine 74.0%
In line with Virginia average

Virginia average: 74.9%

Antipsychotic medication increase Info Percent of short-stay residents who newly received an antipsychotic medication 1.9%
56% worse than Virginia average

Virginia average: 1.2%

Influenza Vaccine Info Percent of short-stay residents assessed and appropriately given the seasonal influenza vaccine 31.2%
58% worse than Virginia average

Virginia average: 73.6%

Re-hospitalized after SNF stay Info Percentage of short-stay residents who were re-hospitalized after their nursing home admission. 18.3%
17% better than Virginia average

Virginia average: 22.0%

Emergency department visits Info Percentage of short-stay residents who had an outpatient emergency department visit. 2.6%
78% better than Virginia average

Virginia average: 11.7%

Falls with major injury Info Percentage of SNF residents who experience falls with major injury during their stay. 0.0%
100% better than Virginia average

Virginia average: 0.8%

Ability to care for self at discharge Info Percentage of residents at or above expected ability to care for themselves at discharge. 73.1%
36% better than Virginia average

Virginia average: 53.7%

Successful return to home or community Info Rate of successful return to home or community from a skilled nursing facility. 44.0%
13% worse than Virginia average

Virginia average: 50.6%

Guides for Better Senior Living

Care Cost Calculator: See Prices in Your Area

Nursing Home Data Explorer

Don’t Wait Too Long: 7 Red Flag Signs Your Parent Needs Assisted Living Now

The True Cost of Assisted Living in 2025 – And How Families Are Paying For It

Understanding Senior Living Costs: Pricing Models, Discounts & Financial Assistance

Financial Aid for Virginia Seniors

Get financial aid guidance

Commonwealth Coordinated Care Plus (CCC Plus)

VA Medicaid CCC Plus

Age 65+ or disabled, Virginia resident, Medicaid-eligible, nursing home-level care need.

~$2,829/month (300% FBR, individual).

$2,000 (individual), $3,000 (couple).

Managed care model; high demand in urban areas.

Virginia Respite Care Grant Program

VA Respite Grant

Caregiver of someone 60+, Virginia resident.

~$2,500/month (individual, varies).

$40,000 (individual).

Limited grants; rural/urban balance.

Adult Services Program

Virginia Adult Services (AS)

Age 60+ (or disabled 18+), VA resident, need significant care (2+ ADLs), not Medicaid-eligible.

Varies by locality; typically < ~$2,510/month (200% FPL).

Limited assets (excludes home, car); varies by DSS.

Serves ~5,000 annually; focuses on low-income independence.

Auxiliary Grant Program

Virginia Auxiliary Grant (AG)

Age 65+ (or disabled 18+), VA resident, living in approved ALF/foster care, SSI-eligible or low-income.

~$1,041/month (individual, SSI level + $20 disregard); higher with medical deductions.

$2,000 (individual).

Serves 4,000; personal needs allowance ($90/month).

Medicare Savings Program (MSP)

Virginia Medicare Savings Program

Age 65+ or disabled, VA resident, Medicare Part A/B.

~$2,510/month (QMB), ~$3,380/month (SLMB), ~$3,598/month (QI)—individual.

$9,430 (individual), $14,130 (couple).

Includes Extra Help for Part D; no waitlist.

Energy Assistance Program (EAP)

Virginia Energy Assistance Program

Age 60+ prioritized, VA resident, low-income household.

~$3,970/month (185% FPL).

Not assessed.

Fuel, Crisis, Cooling components; serves ~100,000 households.

Senior Community Service Employment Program (SCSEP)

Virginia SCSEP

Age 55+, unemployed, low-income, VA resident.

~$1,983/month (125% FPL).

Not specified.

Priority for veterans, rural residents; AARP/Goodwill partnership.

VA Aid and Attendance (A&A) and Housebound Benefits

Virginia VA Aid and Attendance/Housebound

Age 65+ or disabled veteran/spouse, VA resident, wartime service, ADL help (A&A) or homebound.

Net income < ~$1,984/month (veteran with dependent, A&A); pension offsets income.

~$155,356 (net worth).

High veteran population; supports rural/urban needs.

Property Tax Relief for the Elderly and Disabled

Virginia Property Tax Relief

Age 65+ or disabled, VA resident, homeowner, income/asset limits vary by locality.

~$50,000-$75,000/year (household, e.g., Fairfax: $72,000; Richmond: $50,000).

Varies (e.g., Fairfax: $400,000 net worth; Richmond: $100,000).

Offered in 90% of localities; saves ~$500-$2,000/year.

Senior Farmers’ Market Nutrition Program (SFMNP)

Virginia SFMNP

Age 60+, VA resident, low-income.

~$2,322/month (185% FPL).

Not assessed.

Vouchers (~$50-$75/season); serves ~15,000 via AAAs.