Pheasant Ridge Nursing and Rehab Center
Nursing Home & Memory Care · Roanoke, VA
CMS overall rating Info CMS (the Centers for Medicare & Medicaid Services) is the federal agency that rates nursing home quality. Its Overall Rating runs from 1 to 5 stars, combining health inspections, staffing, and quality measures, with inspections weighted most heavily.

Pheasant Ridge Nursing and Rehab Center

Nursing Home & Memory Care · Roanoke, VA
CMS overall rating Info CMS (the Centers for Medicare & Medicaid Services) is the federal agency that rates nursing home quality. Its Overall Rating runs from 1 to 5 stars, combining health inspections, staffing, and quality measures, with inspections weighted most heavily.
Calculator: See prices in your area
Pheasant Ridge Nursing and Rehab Center accepts Medicare, Medicaid, and private pay.

Overview of Pheasant Ridge Nursing and Rehab Center

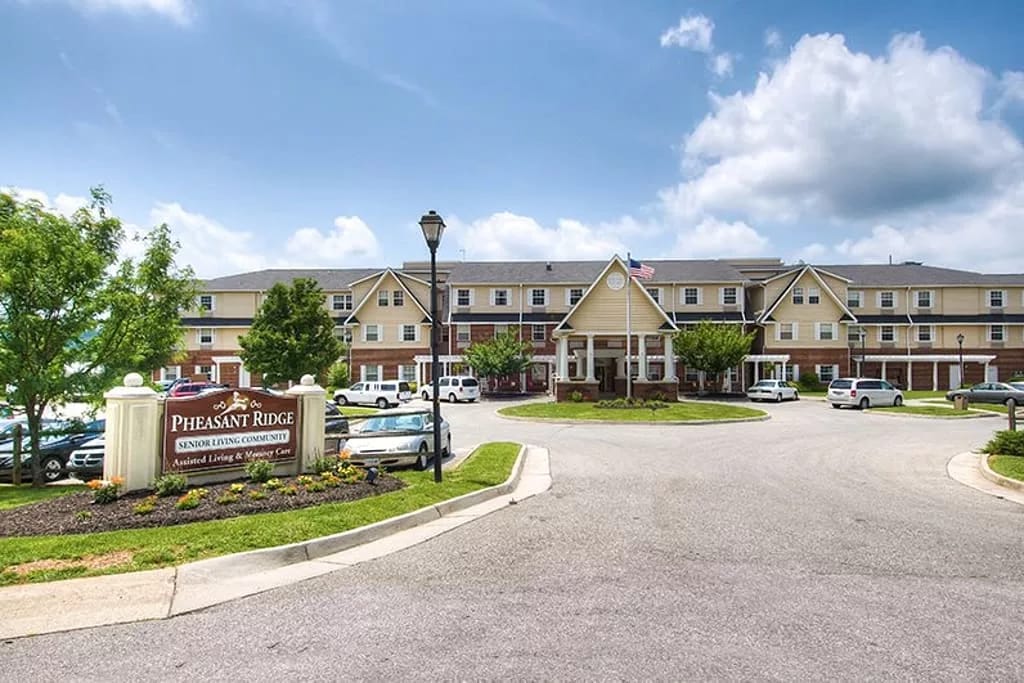
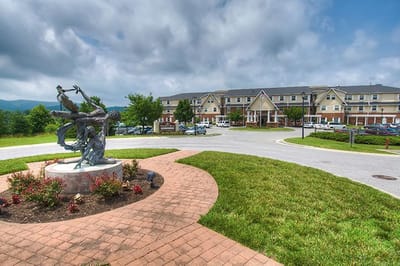
Pheasant Ridge Nursing and Rehab Center, a remarkable senior living community in Roanoke, VA, invites seniors to enjoy its scenic environment while offering memory care and skilled nursing services. The community’s mission is to support residents in maintaining their independence while prioritizing their safety and comfort all the time. With thoughtfully designed resident agreements tailored to each individual, this community ensures peace of mind for all.

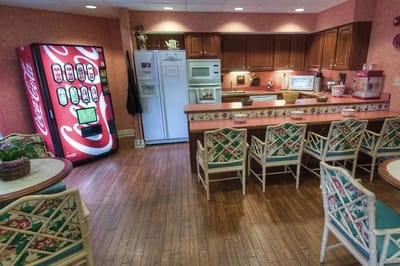
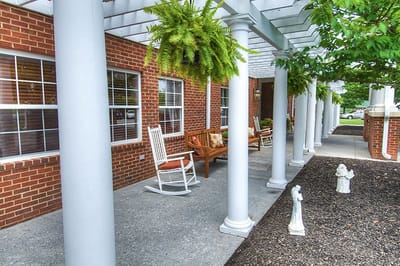
At Pheasant Ridge Nursing and Rehab Center, residents can explore new hobbies and rediscover past ones through a variety of exciting activities and events. There are ample opportunities to socialize with friends and stay active through the community’s wide range of amenities and services. The Center also offers multiple dining options regularly, catering to different dietary needs and preferences. Thus, seniors can enjoy a fulfilling retirement in this vibrant community.

Quality ratings

Measured by Centers for Medicare & Medicaid Services (CMS)

Overall rating Info The Overall CMS Rating combines results from health inspections, staffing levels and quality measures. Health inspections carry the most weight. Staffing and quality scores can increase or decrease the final rating based on performance compared to state and national standards.
At VA avg. At VA avg.VA average: 3.0Click the badge to see the full State ranking.Click here to see the full State ranking.
Health Inspection Info Based on the results of the facility's three most recent standard inspections and any complaint investigations. CMS reviews the number, scope, and severity of deficiencies, with more recent findings weighted more heavily.
▲ 8.1% Above VA avg. ▲ 8.1% Above VA avg.VA average: 2.8Click the badge to see the full State ranking.Click here to see the full State ranking.
Staffing Info Measures average nursing staff hours per resident per day, including Registered Nurses (RNs) and total nursing staff. Ratings are adjusted based on the level of care residents require and are compared to state and national benchmarks.
▲ 21.5% Above VA avg. ▲ 21.5% Above VA avg.VA average: 2.5Click the badge to see the full State ranking.Click here to see the full State ranking.
Quality Measures Info Based on clinical and physical health indicators reported to CMS, such as hospital readmissions, falls, pressure ulcers, and improvements in mobility. These measures reflect how well residents' health needs are being managed.
▼ 22.0% Below VA avg. ▼ 22.0% Below VA avg.VA average: 3.8Click the badge to see the full State ranking.Click here to see the full State ranking.

Staffing hours breakdown

Info Daily nursing hours per resident by staff type, reported to CMS. Higher is generally better — compare this facility to state and national averages to see where staffing stands.

Hours per resident per day — compared to Virginia state averages

Total nursing care / resident Info This home is ranked 52nd out of 89 homes in Virginia for nurse hours. Total adjusted nursing hours per resident per day, combining RN, LPN, and aide time. CMS adjusts this for case-mix so facilities can be fairly compared.
3h 34m per day
Rank #52 / 89Nurse hours — State benchmarkedThis home is ranked 52nd out of 89 homes in Virginia. Shows adjusted nurse hours per resident per day benchmarked to the Virginia average, with a ranking across 89 Virginia facilities. More hours mean more direct care. The national average is about 3.5 hrs; below 3.0 is a red flag.Rankings are based only on facilities in Virginia that report data for that category. Facilities without available data are excluded from the ranking.Click the rank badge to see the full State ranking.Click here to see the full State ranking.
This facility Virginia avg (3h 45m per day)
vs Virginia avg
-5%

3 of 6 metrics below state avg

Standout metric LPN / LVN is +3% above state avg
Staff typeHours / Day / Residentvs state avg
Registered Nurse (RN) Info RNs hold the highest nursing license and can assess residents, interpret test results, and direct care plans. More RN hours per day often signals stronger clinical oversight and faster response to health changes. 40m per day ■ Avg State avg: 41m per day · National avg: 41m per day
LPN / LVN Info Licensed Practical Nurses (LPNs) or Licensed Vocational Nurses (LVNs) deliver routine hands-on care — medication administration, wound dressing, and monitoring vital signs. They work under RN supervision and make up a large share of daily bedside care. 1h 2m per day ▲ 3% State avg: 1h 0m per day · National avg: 52m per day
Nurse Aide Info Certified Nurse Aides (CNAs) provide the most direct day-to-day assistance: bathing, dressing, feeding, and mobility. Nurse aide hours are typically the largest staffing category and directly affect residents' quality of life. 1h 50m per day ▼ 14% State avg: 2h 8m per day · National avg: 2h 21m per day
Weekend Total Nursing Info Combined nursing hours (RN + LPN + Nurse Aide) per resident per day on weekends. Staffing often drops on weekends — this figure reveals whether the facility maintains adequate coverage outside of weekday hours. 3h 14m per day ■ Avg State avg: 3h 19m per day · National avg: 3h 26m per day
Physical Therapist Info Hours per resident per day provided by licensed Physical Therapists (PTs) or PT Assistants. PT services help residents recover mobility after injury or illness and are especially important for post-acute (short-stay) rehabilitation. 3m per day ▼ 46% State avg: 5m per day · National avg: 4m per day
Weekend RN Info Registered nurse hours specifically on weekends. Facilities sometimes reduce RN presence on Saturdays and Sundays — a low weekend RN figure compared to weekday hours can indicate reduced clinical oversight when most administrative staff are absent. 20m per day ▼ 29% State avg: 28m per day · National avg: 29m per day

Capacity and availability

Avg. Length of Stay
106 days
Bed community size
101-bed community Rank #140 / 371Bed count — State benchmarkedThis home is ranked 140th out of 371 homes in Virginia. Shows this facility's certified or reported bed count compared to other Virginia facilities. Larger communities may offer more amenities, programs, and on-site services for residents and families.Rankings are based only on facilities in Virginia that report data for that category. Facilities without available data are excluded from the ranking.Click the rank badge to see the full State ranking.Click here to see the full State ranking.
A larger shared setting that may offer more common spaces and organized community services.
Years in operation
29 years in operation
A longer operating history, which may indicate experience navigating regulations and delivering ongoing care.
Walk Score
Walk Score: 15 / 100 Rank #385 / 449Walk Score — State benchmarkedThis home is ranked 385th out of 449 homes in Virginia. Shows how walkable this facility's neighborhood is compared to the average Walk Score across Virginia facilities. Higher scores benefit residents, families, and staff.Rankings are based only on facilities in Virginia that report data for that category. Facilities without available data are excluded from the ranking.Click the rank badge to see the full State ranking.Click here to see the full State ranking.
Car-dependent. Most errands require a car, with limited nearby walkable options.
BBB Rating
BBB Rating: A+ (Not Accredited)
An independent rating from the Better Business Bureau based on factors such as complaint history, transparency, and business practices.
How BBB ratings work

About this community

License Details

CMS Certification Number495325

Staffing

Key information about the people who lead and staff this community.

Leadership

ContactMr. Phillip Jerman, Executive Director

Contact Pheasant Ridge Nursing and Rehab Center

Inspection History

In Virginia, the Department of Social Services (for assisted living facilities) and the Department of Health (for nursing homes) perform the inspections required to maintain state and federal licensing.

Since 2021 · 5 years of data 28 deficiencies 4 inspections

Inspection Scorecard Info This scorecard compares key inspection, deficiency, and complaint metrics at this facility against the Virginia state average. Metrics rated ≥15% worse than average are highlighted in red; those ≥15% better are highlighted in green.

Since 2021 vs. Virginia state average
Overall vs. VA average 1 Worse Metrics worse than Virginia average:
• Deficiencies per inspection (204% above)
3 Better Metrics better than Virginia average:
• Total deficiencies (13% below)
• Deficiencies per year (13% below)
• Total inspections (71% below)
Latest Inspection November 21, 2024 Complaint Investigation

Deficiencies Info Deficiencies are formal regulatory issues recorded during state inspections.

This FacilityVA Averagevs. VA Avg
Total deficiencies Info Formal regulatory issues recorded by inspectors across all inspection types. 2832 This facility has 13% fewer total deficiencies than a typical Virginia nursing home (28 vs. VA avg 32).↓ 13% better
Deficiencies per year Info Average deficiencies per year since 2021. 5.66.4 This facility has 13% fewer deficiencies per year than a typical Virginia nursing home (5.6 vs. VA avg 6.4).↓ 13% better
Deficiencies per inspection Info Average deficiencies per inspection. 72.3 This facility has 204% more deficiencies per inspection than a typical Virginia nursing home (7 vs. VA avg 2.3).↑ 204% worse

Inspections Info State inspections evaluate whether the facility meets health and safety standards.

This FacilityVA Averagevs. VA Avg
Total inspections Info Combined count of all routine and focused inspections. Excludes complaint investigations. 414 This facility has 71% fewer total inspections than a typical Virginia nursing home (4 vs. VA avg 14).↓ 71% better

Health Inspection History

Inspections since 2021
Total health inspections 4

Virginia average 4.2


Last Health inspection on Nov 2024

Total health citations
25 Rank #43 / 90Health citations — State benchmarkedThis home is ranked 43rd out of 90 homes in Virginia. Shows this facility's total health deficiency citations benchmarked to the Virginia State average, with a ranking across all 90 VA facilities. Lower citation counts earn a better rank.Rankings are based only on facilities in Virginia that report data for that category. Facilities without available data are excluded from the ranking.Click the rank badge to see the full State ranking.Click here to see the full State ranking.

Virginia average 38.4

Citations per inspection
6.25 Rank #33 / 90Citations per inspection — State benchmarkedThis home is ranked 33rd out of 90 homes in Virginia. Shows average deficiency citations per CMS inspection for this facility versus the Virginia mean across 90 facilities with citation data. Lower is better.Rankings are based only on facilities in Virginia that report data for that category. Facilities without available data are excluded from the ranking.Click the rank badge to see the full State ranking.Click here to see the full State ranking.

Virginia average 8.93


Health citations are formal notices following inspections when they fail to comply with safety and care standards.

13 of 25 citations resulted from standard inspections; 10 of 25 resulted from complaint investigations; and 2 of 25 came from combined inspections (standard and complaint).

Breakdown of citation severity (last 5 years)
Critical health citations
1
150% worse than Virginia average

Virginia average: 0.4


Serious health citations
0
100% better than Virginia average

Virginia average: 1

1 critical citation Virginia average: 0.4

0 serious citations Virginia average: 1

23 moderate citations Virginia average: 36.3

1 minor citation Virginia average: 0.8
Citations history (last 5 years)
Nursing Services moderate citation Nov 21, 2024
Corrected

Pharmacy moderate citation Nov 21, 2024
Corrected

Quality of Care critical citation Nov 21, 2024
Corrected

Quality of Care moderate citation Nov 21, 2024
Corrected

Staffing Data

Reporting period: October 1 – December 31, 2025 (Q4 2025). Source: CMS Payroll-Based Journal report.

Total staff 120
Employees 88
Contractors 32
Staff to resident ratio 1.40 : 1
16% fewer staff per resident than Virginia average
Virginia average ratio: 1.67 : 1 Virginia average ratio: 1.67 : 1See full Virginia ranking
Avg staff/day 43
Average shift 8.6 hours
8% better than Virginia average
Virginia average: 8 hours Virginia average shift: 8 hoursSee full Virginia ranking
Total staff hours (quarter) 34,204

Nursing staff breakdown

Q4 2025 · Oct 1 – Dec 31 More info This data comes from the CMS Payroll-Based Journal report covering October 1 – December 31, 2025.
Registered Nurse

Manages medical care and health needs.

RN Staff Info All 12 RN Staff are full-time employees. No contractors work on this role. 12
Average shift length Info Average shift length. Calculated as total hours divided by days worked and average staff per day. 10.1 hours
Licensed Practical Nurse

Assists with medical care and medications.

LPN Staff Info All 19 LPN Staff are full-time employees. No contractors work on this role. 19
Average shift length Info Average shift length. Calculated as total hours divided by days worked and average staff per day. 9.4 hours
Certified Nursing Assistant

Helps with daily care and mobility.

CNA Staff Info All 45 CNA Staff are full-time employees. No contractors work on this role. 45
Average shift length Info Average shift length. Calculated as total hours divided by days worked and average staff per day. 9.1 hours

Contractor staffing

Q4 2025 · Oct 1 – Dec 31 More info This data comes from the CMS Payroll-Based Journal report covering October 1 – December 31, 2025.

Total hours from contractors

8.4%

2,882 contractor hours this quarter

Respiratory Therapy Technician: 8 Occupational Therapy Aide: 6 Physical Therapy Aide: 5 Occupational Therapy Assistant: 4 Speech Language Pathologist: 4 Physical Therapy Assistant: 2 Qualified Social Worker: 2 Medical Director: 1

Staff by category

Q4 2025 · Oct 1 – Dec 31 More info This data comes from the CMS Payroll-Based Journal report covering October 1 – December 31, 2025.
Certified Nursing Assistant4504514,77992100%9.1
Licensed Practical Nurse190198,03492100%9.4
Registered Nurse120123,4319098%10.1
Clinical Nurse Specialist4041,5017480%8.9
Physical Therapy Aide0557796571%6.5
Other Dietary Services Staff2027767480%7.7
Speech Language Pathologist0447116874%6.1
Qualified Social Worker0225416368%8.4
Administrator1015286672%8
Mental Health Service Worker1015206571%8
Nurse Practitioner1015126470%8
Dietitian1014966267%8
Dental Services Staff1014756065%7.9
Physical Therapy Assistant0223755560%6.7
Respiratory Therapy Technician0883606672%4.7
RN Director of Nursing1012702628%10.4
Medical Director011466672%0.7
Occupational Therapy Assistant044444549%0.9
Occupational Therapy Aide0662778%3
45 Certified Nursing Assistant
% of Days 100%
19 Licensed Practical Nurse
% of Days 100%
12 Registered Nurse
% of Days 98%
4 Clinical Nurse Specialist
% of Days 80%
5 Physical Therapy Aide
% of Days 71%
2 Other Dietary Services Staff
% of Days 80%
4 Speech Language Pathologist
% of Days 74%
2 Qualified Social Worker
% of Days 68%
1 Administrator
% of Days 72%
1 Mental Health Service Worker
% of Days 71%
1 Nurse Practitioner
% of Days 70%
1 Dietitian
% of Days 67%
1 Dental Services Staff
% of Days 65%
2 Physical Therapy Assistant
% of Days 60%
8 Respiratory Therapy Technician
% of Days 72%
1 RN Director of Nursing
% of Days 28%
1 Medical Director
% of Days 72%
4 Occupational Therapy Assistant
% of Days 49%
6 Occupational Therapy Aide
% of Days 8%

Penalties and fines

Federal penalties imposed by CMS for regulatory violations, including civil money penalties (fines) and denials of payment for new Medicare/Medicaid admissions.

Source: CMS Penalties Database (Data as of Jan 2026)

Total fines amount $40K Rank #1 / 93Federal fines — State benchmarkedThis home is ranked 1st out of 93 homes in Virginia. Shows this facility's cumulative CMS federal fine dollars versus the Virginia average among facilities with fines, and where it ranks among 93 facilities in the pool. Lower total dollars mean a better rank.Rankings are based only on facilities in Virginia that report data for that category. Facilities without available data are excluded from the ranking.Click the rank badge to see the full State ranking.Click here to see the full State ranking.
23% lower than Virginia average

Virginia average: $52K

Number of fines 11
525% more fines than Virginia average

Virginia average: 1.8

Payment Denials Info Serious action where Medicare and/or Medicaid temporarily stops payments for new residents until issues are fixed. 0
100% fewer payment denials than Virginia average

Virginia average: 0.1

Fines amount comparison
This facility $40K
Virginia average $52K

No penalties in the past 3 years

No civil money penalties or payment denials were reported in the last 3 years.

Quality of care over time

These measures show how residents usually do over time at this home, based on health outcomes and preventive care.

High-risk clinical events score Info A composite score based on pressure ulcers, falls with injury, weight loss, walking ability decline, and activities of daily living decline. 11.1
9% worse than Virginia average

Virginia average: 10.1

Functional decline score Info A composite score based on activities of daily living decline, walking ability decline, and incontinence. 19.2
In line with Virginia average

Virginia average: 19.7

Long-stay resident measures
Average Virginia avg: 3.9 Info CMS star rating based on long-stay quality measure performance. 5 stars = significantly above average, 1 star = significantly below average.
Need for Help with Daily Activities Increased Info Percent of long-stay residents whose need for help with daily activities has increased 14.9%
12% better than Virginia average

Virginia average: 16.8%

Walking Ability Worsened Info Percent of long-stay residents whose ability to move independently worsened 22.5%
14% worse than Virginia average

Virginia average: 19.7%

Low Risk Residents with Bowel/Bladder Incontinence Info Percent of low risk long-stay residents who lose control of their bowels or bladder 20.2%
11% better than Virginia average

Virginia average: 22.6%

Falls with Major Injury Info Percent of long-stay residents experiencing one or more falls with major injury 4.1%
12% worse than Virginia average

Virginia average: 3.6%

High Risk Residents with Pressure Ulcers Info Percent of long-stay high risk residents with pressure ulcers 8.8%
64% worse than Virginia average

Virginia average: 5.4%

Urinary Tract Infection Info Percent of long-stay residents with a urinary tract infection 0.4%
75% better than Virginia average

Virginia average: 1.5%

Lost Too Much Weight Info Percent of long-stay residents who lose too much weight 5.2%
11% better than Virginia average

Virginia average: 5.9%

Depressive Symptoms Info Percent of long-stay residents who have depressive symptoms 4.1%
72% better than Virginia average

Virginia average: 14.9%

Antipsychotic Use Info Percent of long-stay residents who received an antipsychotic medication 19.1%
49% worse than Virginia average

Virginia average: 12.9%

Pneumococcal Vaccine Info Percent of long-stay residents assessed and appropriately given the pneumococcal vaccine 90.0%
In line with Virginia average

Virginia average: 91.3%

Influenza Vaccine Info Percent of long-stay residents assessed and appropriately given the seasonal influenza vaccine 86.7%
8% worse than Virginia average

Virginia average: 94.0%

Hospitalizations per 1,000 days Info Number of hospitalizations per 1,000 long-stay resident days. 1.77
21% worse than Virginia average

Virginia average: 1.46

ED visits per 1,000 days Info Number of outpatient emergency department visits per 1,000 long-stay resident days. 0.75
47% better than Virginia average

Virginia average: 1.41

Short-stay resident measures
Above average Virginia avg: 3.9 Info CMS star rating based on short-stay quality measure performance. 5 stars = much above average, 1 star = much below average.
Pneumococcal Vaccine Info Percent of short-stay residents assessed and appropriately given the pneumococcal vaccine 74.4%
In line with Virginia average

Virginia average: 74.9%

Antipsychotic medication increase Info Percent of short-stay residents who newly received an antipsychotic medication 1.4%
18% worse than Virginia average

Virginia average: 1.2%

Influenza Vaccine Info Percent of short-stay residents assessed and appropriately given the seasonal influenza vaccine 59.7%
19% worse than Virginia average

Virginia average: 73.6%

Re-hospitalized after SNF stay Info Percentage of short-stay residents who were re-hospitalized after their nursing home admission. 20.8%
5% better than Virginia average

Virginia average: 22.0%

Emergency department visits Info Percentage of short-stay residents who had an outpatient emergency department visit. 7.7%
34% better than Virginia average

Virginia average: 11.7%

Falls with major injury Info Percentage of SNF residents who experience falls with major injury during their stay. 1.6%
101% worse than Virginia average

Virginia average: 0.8%

Ability to care for self at discharge Info Percentage of residents at or above expected ability to care for themselves at discharge. 57.5%
7% better than Virginia average

Virginia average: 53.7%

Successful return to home or community Info Rate of successful return to home or community from a skilled nursing facility. 47.1%
7% worse than Virginia average

Virginia average: 50.6%

Breakdown by payment type

Medicare

27% of new residents, usually for short-term rehab.

Typical stay 1 - 2 months

Private pay

45% of new residents, often for short stays.

Typical stay 1 - 2 months

Medicaid

28% of new residents, often for long-term daily care.

Typical stay 9 - 10 months

Facility Characteristics

Source: CMS Long-Term Care Facility Characteristics (Data as of Jan 2026)

Total residents 86
Medicare
9
10.5% of residents
Medicaid
56
65.1% of residents
Private pay or other
21
24.4% of residents
Programs & Services
Residents Group

Residents meet regularly to discuss policies, care quality, and activities

Active Resident Council

Organized group of residents that meets regularly to discuss facility policies, quality of life, and activities.

Finances and operations

Based on CMS SNF Cost Report for fiscal year ending in 12/2023.

For-profit
Corporation
Net patient revenue Info Net patient revenue — what the home actually collects for resident care, after contractual allowances, bad debt and discounts are subtracted from its gross charges (CMS cost report, Worksheet G-3). It covers resident care only; money the home earns from other sources is shown separately as "Other income."
$10.9M
Net patient income Info Net patient income: net patient revenue minus the home's total operating expenses. A positive figure means it earns more from resident care than it spends to deliver it; a negative figure means the opposite. It excludes non-operating "other income."
$738.0K
For-profit Corporation
Net patient revenue Info Net patient revenue — what the home actually collects for resident care, after contractual allowances, bad debt and discounts are subtracted from its gross charges (CMS cost report, Worksheet G-3). It covers resident care only; money the home earns from other sources is shown separately as "Other income."
$10.9M Rank #63 / 89Revenue — State benchmarkedThis home is ranked 63rd out of 89 homes in Virginia. Shows this facility's annual revenue compared to the Virginia average. Higher revenue generally means more resources for staffing and capital — read alongside Payroll %.Rankings are based only on facilities in Virginia that report data for that category. Facilities without available data are excluded from the ranking.Click the rank badge to see the full State ranking.Click here to see the full State ranking.
Net patient income Info Net patient income: net patient revenue minus the home's total operating expenses. A positive figure means it earns more from resident care than it spends to deliver it; a negative figure means the opposite. It excludes non-operating "other income."
$738.0K
Other income Info Money the home earns outside of resident care — such as investments, grants, rentals and other non-operating sources (CMS cost report, Worksheet G-3). It is tracked separately from net patient revenue: it is not part of that figure, and it is not included in net patient income.
$448.2K
Payroll costs Info Staff salaries plus wage-related costs — benefits such as payroll taxes, health insurance and retirement — from the home's own accounting records (CMS cost report, Worksheet A). Contract or agency labor is counted separately, under other operating costs. Rank #87 / 89Payroll — State benchmarkedThis home is ranked 87th out of 89 homes in Virginia. Shows total annual staff payroll benchmarked to the Virginia average. Higher payroll investment relative to peers often signals better staffing and less reliance on cheaper contract labor.Rankings are based only on facilities in Virginia that report data for that category. Facilities without available data are excluded from the ranking.Click the rank badge to see the full State ranking.Click here to see the full State ranking.
$5.1M 47.1% of net patient revenue Info Payroll as a share of revenue: staff salaries and wage-related benefits divided by net patient revenue. A higher figure means more of each revenue dollar goes to staff pay. Rank #71 / 89Payroll % — State benchmarkedThis home is ranked 71st out of 89 homes in Virginia. Shows payroll as a percentage of revenue versus the Virginia average. Well-run Virginia facilities typically land around 51–60% — the top third Statewide. Below 25% may signal understaffing or heavy agency use — read with Staffing ratings.Rankings are based only on facilities in Virginia that report data for that category. Facilities without available data are excluded from the ranking.Click the rank badge to see the full State ranking.Click here to see the full State ranking.
Other operating costs Info Everything it costs to run the home apart from payroll — food, utilities, supplies, maintenance, contract labor and administration. Calculated as total operating expense minus payroll (staff salaries and wage-related benefits).
$5.0M
Total costs Info The home's total operating expense for the year — all the costs of running it, salaries included (CMS cost report, Worksheet G-3).
$10.2M

What does this home offer?

Building type icon
Building type icon

Building Type: 3-story

Who this home usually serves

TYPE OF STAY

Mix of rehab and long-term care

This home supports both short-term rehab and long-term care, with residents staying for a wide range of durations.

New residents most often arrive under private pay (45% of admissions), and a typical private pay stay runs around 1 - 2 months.

Admissions
310 total

Coverage residents most often arrive under.

Medicare 27%
Private pay 45%
Medicaid 28%
Discharges
311 total

Coverage residents most often leave under.

Medicare 26%
Private pay 48%
Medicaid 27%

Places of interest near Pheasant Ridge Nursing and Rehab Center

Address 3.4 miles from city center Info Estimated distance in miles from Roanoke's city center to Pheasant Ridge Nursing and Rehab Center's address, calculated via Google Maps.

Calculate Travel Distance to Pheasant Ridge Nursing and Rehab Center

Add your location

Address

Compare Nursing Homes around Roanoke

The information below is reported by the Virginia Department of Social Services and Department of Health.

5 facilities compared · CMS & VA Dept. of Health data

Brandon Oaks Nursing and Rehabilitation Center
NH
AL
HC
IL
MC
NC
Roanoke (Westland)
43
Facility 43
VA AVG 95
Rank #319 / 371
53.5%
Facility 53.5%
VA AVG 85.7%
Rank #255 / 314
-38%
5.33
Facility 5.33
VA AVG 3.74
Rank #16 / 89
+28%+42%
$0
Facility $0
VA AVG $54.3k
Rank #1 / 93
12
Facility 12
VA AVG 38.4
Rank #9 / 90
4.0
Facility 4.0
VA AVG 8.9
Rank #11 / 90
-23-
33
Facility 33
VA AVG 44
Rank #282 / 449
Heather Neff
$7.2M
Facility $7.2M
VA AVG $18.3M
Rank #32 / 89
$7.0M
Facility $7.0M
VA AVG $6.9M
Rank #60 / 89
96.3%
Facility 96.3%
VA AVG 39.7%
Rank #86 / 89
495373
Our Lady of the Valley
NH
AL
MC
NC
RC
Roanoke (Gainsboro)
127
Facility 127
VA AVG 95
Rank #78 / 371
87.4%
Facility 87.4%
VA AVG 85.7%
Rank #65 / 314
+2%
3.79
Facility 3.79
VA AVG 3.74
Rank #47 / 89
-42%+1%
$0
Facility $0
VA AVG $54.3k
Rank #1 / 93
14
Facility 14
VA AVG 38.4
Rank #15 / 90
4.7
Facility 4.7
VA AVG 8.9
Rank #19 / 90
-111A+
68
Facility 68
VA AVG 44
Rank #74 / 449
David Rawlings
$14.8M
Facility $14.8M
VA AVG $18.3M
Rank #58 / 89
$8.2M
Facility $8.2M
VA AVG $6.9M
Rank #53 / 89
55.5%
Facility 55.5%
VA AVG 39.7%
Rank #37 / 89
495357
Friendship Retirement Community
NH
AL
IL
MC
RC
Roanoke (Hollins)
253
Facility 253
VA AVG 95
Rank #5 / 371
93.1%
Facility 93.1%
VA AVG 85.7%
Rank #27 / 314
+9%
4.46
Facility 4.46
VA AVG 3.74
Rank #33 / 89
+4%+19%
$0
Facility $0
VA AVG $54.3k
Rank #1 / 93
18
Facility 18
VA AVG 38.4
Rank #29 / 90
4.5
Facility 4.5
VA AVG 8.9
Rank #18 / 90
-231A+
48
Facility 48
VA AVG 44
Rank #186 / 449
Friendship Foundation Inc
$29.8M
Facility $29.8M
VA AVG $18.3M
Rank #20 / 89
$15.3M
Facility $15.3M
VA AVG $6.9M
Rank #22 / 89
51.5%
Facility 51.5%
VA AVG 39.7%
Rank #55 / 89
495092
Pheasant Ridge Nursing and Rehab Center
NH
MC
Roanoke (Southern Hills)
101
Facility 101
VA AVG 95
Rank #140 / 371
--
3.56
Facility 3.56
VA AVG 3.74
Rank #52 / 89
+4%-5%
$0
Facility $0
VA AVG $54.3k
Rank #1 / 93
25
Facility 25
VA AVG 38.4
Rank #43 / 90
6.3
Facility 6.3
VA AVG 8.9
Rank #33 / 90
119A+
15
Facility 15
VA AVG 44
Rank #385 / 449
Victor Bell
$10.9M
Facility $10.9M
VA AVG $18.3M
Rank #63 / 89
$5.1M
Facility $5.1M
VA AVG $6.9M
Rank #87 / 89
47.1%
Facility 47.1%
VA AVG 39.7%
Rank #71 / 89
495325
Old Southwest Rehabilitation and Nursing
NH
HC
MC
PC
RC
Roanoke (Old Southwest)
130
Facility 130
VA AVG 95
Rank #69 / 371
25.4%
Facility 25.4%
VA AVG 85.7%
Rank #307 / 314
-70%
3.82
Facility 3.82
VA AVG 3.74
Rank #47 / 89
-27%+2%
$143.8k
Facility $143.8k
VA AVG $54.3k
Rank #93 / 93
131
Facility 131
VA AVG 38.4
Rank #89 / 90
18.7
Facility 18.7
VA AVG 8.9
Rank #88 / 90
433A+
57
Facility 57
VA AVG 44
Rank #133 / 449
Andrew Shuler
$8.8M
Facility $8.8M
VA AVG $18.3M
Rank #85 / 89
$4.2M
Facility $4.2M
VA AVG $6.9M
Rank #79 / 89
47.8%
Facility 47.8%
VA AVG 39.7%
Rank #23 / 89
495156

Financial Assistance for
Nursing Home in Virginia

Pheasant Ridge Nursing and Rehab Center is located in Roanoke, Virginia.
Here are the financial assistance programs available to residents in Virginia.

Get Financial aid guidance

Commonwealth Coordinated Care Plus (CCC Plus)

VA Medicaid CCC Plus

Age 65+ or disabled
General Virginia resident, Medicaid-eligible, nursing home-level care need.
Income Limits (2025) ~$2,829/month 300% FBR, individual
Asset Limits $2,000 (individual), $3,000 (couple).
VA

Managed care model; high demand in urban areas.

Benefits
Personal care (5-7 hours/day) Respite (240 hours/year) Adult day care ($65/day) Home modifications ($1,500 avg.)

Virginia Respite Care Grant Program

VA Respite Grant

Age Caregiver of someone 60+
General Virginia resident.
Income Limits ~$2,500/month individual, varies
Asset Limits $40,000 individual
VA

Limited grants; rural/urban balance.

Benefits
In-home respite (up to 30 days/year) Adult day care (~$65/day) Facility respite (up to 5 days)

Adult Services Program

Virginia Adult Services (AS)

Age 60+ (or disabled 18+)
General VA resident, need significant care (2+ ADLs), not Medicaid-eligible.
Income Limits (2025) Varies by locality; typically < ~$2,510/month 200% FPL
Asset Limits Limited assets (excludes home, car); varies by DSS.
VA

Serves ~5,000 annually; focuses on low-income independence.

Benefits
Personal care (4-6 hours/week) Adult day care (~$60/day) Chore services Assessments Respite (~5 days/year)

Auxiliary Grant Program

Virginia Auxiliary Grant (AG)

Age 65+ (or disabled 18+)
General VA resident, living in approved ALF/foster care, SSI-eligible or low-income.
Income Limits (2025) ~$1,041/month (individual, SSI level + $20 disregard); higher with medical deductions.
Asset Limits $2,000 individual
VA

Serves 4,000; personal needs allowance ($90/month).

Benefits
Cash (~$1,400-$1,700/month in 2025, varies by region) for ALF/foster care costs; basic care included

Medicare Savings Program (MSP)

Virginia Medicare Savings Program

Age 65+ or disabled
General VA resident, Medicare Part A/B.
Income Limits (2025) ~$2,510/month (QMB), ~$3,380/month (SLMB), ~$3,598/month (QI)—individual.
Asset Limits $9,430 (individual), $14,130 (couple).
VA

Includes Extra Help for Part D; no waitlist.

Benefits
Covers Part B premiums ($174.70/month) Deductibles ($240/year) Copays (~20%)

Energy Assistance Program (EAP)

Virginia Energy Assistance Program

Age 60+ prioritized
General VA resident, low-income household.
Income Limits (2025) ~$3,970/month 185% FPL
Asset Limits Not assessed.
VA

Fuel, Crisis, Cooling components; serves ~100,000 households.

Benefits
Heating/cooling aid ($300-$1,000/season) Crisis aid ($500 max) Equipment repair (~$250)

VA Aid and Attendance (A&A) and Housebound Benefits

Virginia VA Aid and Attendance/Housebound

Age 65+ or disabled veteran/spouse
General VA resident, wartime service, ADL help (A&A) or homebound.
Income Limits (2025) Net income < ~$1,984/month (veteran with dependent, A&A); pension offsets income.
Asset Limits ~$155,356 net worth
VA

High veteran population; supports rural/urban needs.

Benefits
Cash (~$1,433-$2,642/month veteran, ~$951-$1,318 spouse) for care costs

Property Tax Relief for the Elderly and Disabled

Virginia Property Tax Relief

Age 65+ or disabled
General VA resident, homeowner, income/asset limits vary by locality.
Income Limits (2025) ~$50,000-$75,000/year household, e.g., Fairfax: $72,000; Richmond: $50,000
Asset Limits Varies e.g., Fairfax: $400,000 net worth; Richmond: $100,000
VA

Offered in 90% of localities; saves ~$500-$2,000/year.

Benefits
Tax exemption/deferral (~$500-$2,000/year depending on locality)

Senior Farmers’ Market Nutrition Program (SFMNP)

Virginia SFMNP

Age 60+
General VA resident, low-income.
Income Limits (2025) ~$2,322/month 185% FPL
Asset Limits Not assessed.
VA

Vouchers (~$50-$75/season); serves ~15,000 via AAAs.

Benefits
Vouchers (~$50-$75/season) for produce at farmers’ markets

Frequently Asked Questions about Pheasant Ridge Nursing and Rehab Center

What neighborhood is Pheasant Ridge Nursing and Rehab Center in?

Pheasant Ridge Nursing and Rehab Center is in the Southern Hills neighborhood of VA 24014.

Is Pheasant Ridge Nursing and Rehab Center in a walkable area?

Pheasant Ridge Nursing and Rehab Center has a walk score of 15. Car-dependent. Most errands require a car, with limited nearby walkable options.

What is the occupancy rate at Pheasant Ridge Nursing and Rehab Center?

Pheasant Ridge Nursing and Rehab Center's occupancy is 89.3%.

Does Pheasant Ridge Nursing and Rehab Center operate as a for-profit or non-profit?

Pheasant Ridge Nursing and Rehab Center is registered as a for-profit.

Are there photos of Pheasant Ridge Nursing and Rehab Center?

Yes — there are 5 photos of Pheasant Ridge Nursing and Rehab Center in the photo gallery on this page.

What is the address of Pheasant Ridge Nursing and Rehab Center?

Pheasant Ridge Nursing and Rehab Center is located at 4355 Pheasant Ridge Rd, Roanoke, Va 24014, Usa.

What is the phone number of Pheasant Ridge Nursing and Rehab Center?

(540) 725-8210 will put you in contact with the team at Pheasant Ridge Nursing and Rehab Center.

Guides for Better Senior Living

Care Cost Calculator: See Prices in Your Area

Nursing Home Data Explorer

Don’t Wait Too Long: 7 Red Flag Signs Your Parent Needs Assisted Living Now

The True Cost of Assisted Living in 2025 – And How Families Are Paying For It

Understanding Senior Living Costs: Pricing Models, Discounts & Financial Assistance