


Total staff
111
Employees
102
Contractors
9
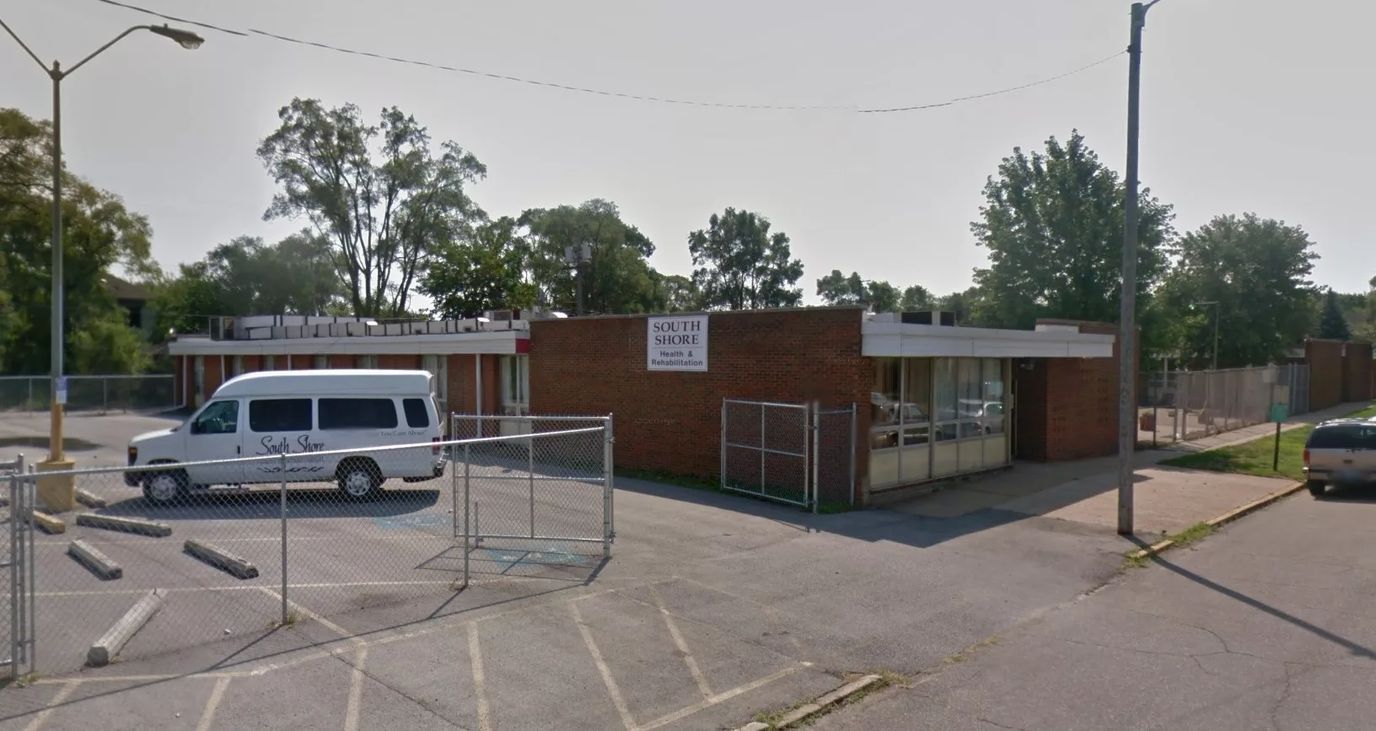

South Shore Health & Rehabilitation, a prominent Skilled Nursing & Rehabilitation facility, is centrally located in the heart of Gary, Indiana. This facility is deeply committed to delivering high-quality healthcare services to the broader community. The multidisciplinary team of professionals collaborates closely with residents’ physicians and area hospitals. Together, they craft individualized care plans for each resident, ensuring a seamless continuum of care, all with the goal of enhancing their recovery journey.
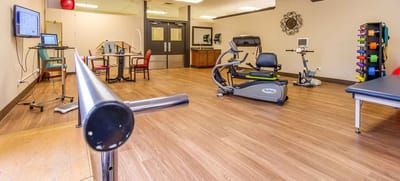
South Shore Health & Rehabilitation is in a constant state of growth and evolution, continuously expanding its services. From long-term care to short-term rehabilitation to complex clinical support, the facility offers a spectrum of services that stand out for their exceptional quality and breadth. Residents at South Shore Health & Rehabilitation can expect an environment that marries compassion with expert care, where their healthcare concerns are thoughtfully managed, always placing the resident’s well-being at the forefront. With an unwavering dedication to patient well-being, South Shore Health & Rehabilitation operates under a singular objective: to provide each patient with the utmost care, facilitating their rehabilitation and the restoration of strength, mobility, and functional capacity.
| Staff type | Hours / Day / Resident | vs state avg |
|---|---|---|
|
Registered Nurse (RN)
| 43m per day | ▲ 8% State avg: 40m per day · National avg: 41m per day |
|
LPN / LVN
| 1h 3m per day | ▲ 38% State avg: 46m per day · National avg: 52m per day |
|
Nurse Aide
| 2h 16m per day | ■ Avg State avg: 2h 16m per day · National avg: 2h 21m per day |
|
Weekend Total Nursing
| 3h 29m per day | ▲ 8% State avg: 3h 14m per day · National avg: 3h 26m per day |
|
Physical Therapist
| 2m per day | ▼ 42% State avg: 4m per day · National avg: 4m per day |
|
Weekend RN
| 29m per day | ▲ 8% State avg: 27m per day · National avg: 29m per day |
Reporting period: October 1 – December 31, 2025 (Q4 2025). Source: CMS Payroll-Based Journal report.
Manages medical care and health needs.
Assists with medical care and medications.
Helps with daily care and mobility.
Total hours from contractors
1,764 contractor hours this quarter
| Certified Nursing Assistant | 53 | 0 | 53 | 15,647 | 92 | 100% | 7.8 |
| Licensed Practical Nurse | 23 | 0 | 23 | 7,575 | 92 | 100% | 7.8 |
| Registered Nurse | 8 | 0 | 8 | 3,494 | 92 | 100% | 8.3 |
| Other Dietary Services Staff | 7 | 0 | 7 | 1,483 | 92 | 100% | 7.5 |
| Clinical Nurse Specialist | 4 | 0 | 4 | 1,237 | 70 | 76% | 8.3 |
| Physical Therapy Aide | 0 | 2 | 2 | 799 | 66 | 72% | 7.5 |
| Medication Aide/Technician | 1 | 0 | 1 | 564 | 74 | 80% | 7.6 |
| Occupational Therapy Aide | 1 | 0 | 1 | 504 | 63 | 68% | 8 |
| Mental Health Service Worker | 1 | 0 | 1 | 504 | 63 | 68% | 8 |
| Speech Language Pathologist | 0 | 2 | 2 | 484 | 86 | 93% | 5.6 |
| Administrator | 1 | 0 | 1 | 464 | 61 | 66% | 7.6 |
| Nurse Practitioner | 1 | 0 | 1 | 424 | 53 | 58% | 8 |
| Dietitian | 2 | 0 | 2 | 380 | 48 | 52% | 7.9 |
| Respiratory Therapy Technician | 0 | 2 | 2 | 275 | 41 | 45% | 6.7 |
| Physical Therapy Assistant | 0 | 2 | 2 | 151 | 33 | 36% | 4.5 |
| Qualified Social Worker | 0 | 1 | 1 | 55 | 25 | 27% | 2.2 |
Federal penalties imposed by CMS for regulatory violations, including civil money penalties (fines) and denials of payment for new Medicare/Medicaid admissions.
Source: CMS Penalties Database
No penalties in the past 3 years
No civil money penalties or payment denials were reported in the last 3 years.
These measures show how residents usually do over time at this home, based on health outcomes and preventive care.
Indiana average: 8.0
Indiana average: 17.1
Indiana average: 12.0%
Indiana average: 14.4%
Indiana average: 24.6%
Indiana average: 3.9%
Indiana average: 4.4%
Indiana average: 1.2%
Indiana average: 5.7%
Indiana average: 24.1%
Indiana average: 12.4%
Indiana average: 93.7%
Indiana average: 95.4%
Indiana average: 1.60
Indiana average: 1.48
Indiana average: 81.7%
Indiana average: 1.4%
Indiana average: 79.0%
Indiana average: 22.4%
Indiana average: 10.5%
Indiana average: 0.8%
Quality measures are calculated from Minimum Data Set (MDS) assessments. For most measures, lower percentages indicate better care quality.
20% of new residents, usually for short-term rehab.
27% of new residents, often for short stays.
54% of new residents, often for long-term daily care.
Source: CMS Long-Term Care Facility Characteristics (Data as of Jan 2026)
Residents meet regularly to discuss policies, care quality, and activities
Organized group of residents that meets regularly to discuss facility policies, quality of life, and activities.
Data sourced from CMS Long-Term Care Facility Characteristics quarterly report. Payer mix reflects the current resident census by primary payment source.
Historical financial and operational data for South Shore Health & Rehabilitation from 2011–2023, based on CMS SNF Cost Reports.
Key figures below are for fiscal year ending in 12/2023.
Based on CMS SNF Cost Report for fiscal year ending in 12/2023.
Most residents stay for extended periods and receive ongoing daily care.
Most new residents arrive under Medicaid (54% of admissions), and a typical Medicaid stay runs around 6 - 7 months.
Coverage residents most often arrive under.
Coverage residents most often leave under.
![]() 0.6 miles from city center
0.6 miles from city center
![]() Estimated distance in miles from Gary's city center to South Shore Health & Rehabilitation's address, calculated via Google Maps.
— 5.53 miles to nearest hospital (St. Catherine Hospital)
Estimated distance in miles from Gary's city center to South Shore Health & Rehabilitation's address, calculated via Google Maps.
— 5.53 miles to nearest hospital (St. Catherine Hospital)
Add your location
Info below is compiled from CMS reports & the IN Dept. of Health (IDOH), senior community websites & trusted data sources such as Walk Score & BBB.
Communities are listed from highest to lowest based on our ranking methodology.
| Aperion Care Tolleston Park | NH HOS MC PC SNF | Gary | 178
Facility
178
IN AVG
116
Rank
#48 / 433 |
70.8%
Facility
70.8%
IN AVG
65.4
Rank
#183 / 423 | +8% | 2.27
Facility
2.27
IN AVG
3.44
Rank
#275 / 280 | -73% | -34% | $0
Facility
$0
IN AVG
$31.4k
Rank
#1 / 282 | 69
Facility
69
IN AVG
83
Rank
#349 / 392 | 60
Facility
60
IN AVG
25.0
Rank
#273 / 282 | 6.0
Facility
6.0
IN AVG
4.1
Rank
#226 / 282 | - | 126 | - |
6
Facility
6
IN AVG
37
Rank
#509 / 587 | Jillian Kutemeier | $17.0MFiscal year ending 12/2023
Facility
$17.0MFiscal year ending 12/2023
IN AVG
$10.7M
Rank
#44 / 282 | $7.3MFiscal year ending 12/2023
Facility
$7.3MFiscal year ending 12/2023
IN AVG
$4.2M
Rank
#53 / 282 | 43%Fiscal year ending 12/2023
Facility
43%Fiscal year ending 12/2023
IN AVG
42%
Rank
#179 / 282 | 155580 | ||||
| South Shore Health & Rehabilitation | NH HOS PC SNF | Gary (Tyler Street) | 100
Facility
100
IN AVG
116
Rank
#235 / 433 |
77.9%
Facility
77.9%
IN AVG
65.4
Rank
#114 / 423 | +19% | 4.37
Facility
4.37
IN AVG
3.44
Rank
#29 / 280 | -27% | +27% | $0
Facility
$0
IN AVG
$31.4k
Rank
#1 / 282 | - | 63
Facility
63
IN AVG
25.0
Rank
#274 / 282 | 7.0
Facility
7.0
IN AVG
4.1
Rank
#258 / 282 | 1 | 78 | - |
56
Facility
56
IN AVG
37
Rank
#172 / 587 | Maybach Partners, LLC | $9.6MFiscal year ending 12/2023
Facility
$9.6MFiscal year ending 12/2023
IN AVG
$10.7M
Rank
#130 / 282 | $5.7MFiscal year ending 12/2023
Facility
$5.7MFiscal year ending 12/2023
IN AVG
$4.2M
Rank
#72 / 282 | 59.5%Fiscal year ending 12/2023
Facility
59.5%Fiscal year ending 12/2023
IN AVG
42%
Rank
#49 / 282 | 155530 |
South Shore Health & Rehabilitation is located in Gary, Indiana.
Here are the financial assistance programs available to residents in Indiana.
South Shore Health & Rehabilitation is in the Tyler Street neighborhood.
South Shore Health & Rehabilitation has a walk score of 56. Moderately walkable. Some errands can be accomplished on foot, with a mix of nearby amenities.
South Shore Health & Rehabilitation's occupancy is 82.8%.
No, South Shore Health & Rehabilitation has a no-pet policy.
South Shore Health & Rehabilitation is a government-operated nursing facility.
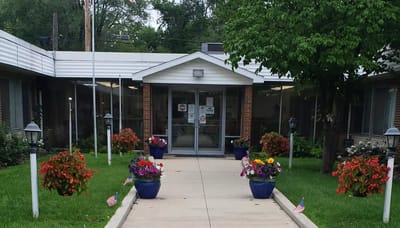
Yes — there are 4 photos of South Shore Health & Rehabilitation in the photo gallery on this page.
South Shore Health & Rehabilitation is located at 353 Tyler St, Gary, IN 46402.
Care Cost Calculator: See Prices in Your Area
Nursing Home Data Explorer
Don’t Wait Too Long: 7 Red Flag Signs Your Parent Needs Assisted Living Now
The True Cost of Assisted Living in 2025 – And How Families Are Paying For It
Understanding Senior Living Costs: Pricing Models, Discounts & Financial Assistance


