SouthWest Commons by New Perspective
CMS overall rating Info CMS (the Centers for Medicare & Medicaid Services) is the federal agency that rates nursing home quality. Its Overall Rating runs from 1 to 5 stars, combining health inspections, staffing, and quality measures, with inspections weighted most heavily.

SouthWest Commons by New Perspective

CMS overall rating Info CMS (the Centers for Medicare & Medicaid Services) is the federal agency that rates nursing home quality. Its Overall Rating runs from 1 to 5 stars, combining health inspections, staffing, and quality measures, with inspections weighted most heavily.
Calculator: See prices in your area
SouthWest Commons by New Perspective accepts Medicare, Medicaid, and private pay.

Overview of Southwest Commons by New Perspective

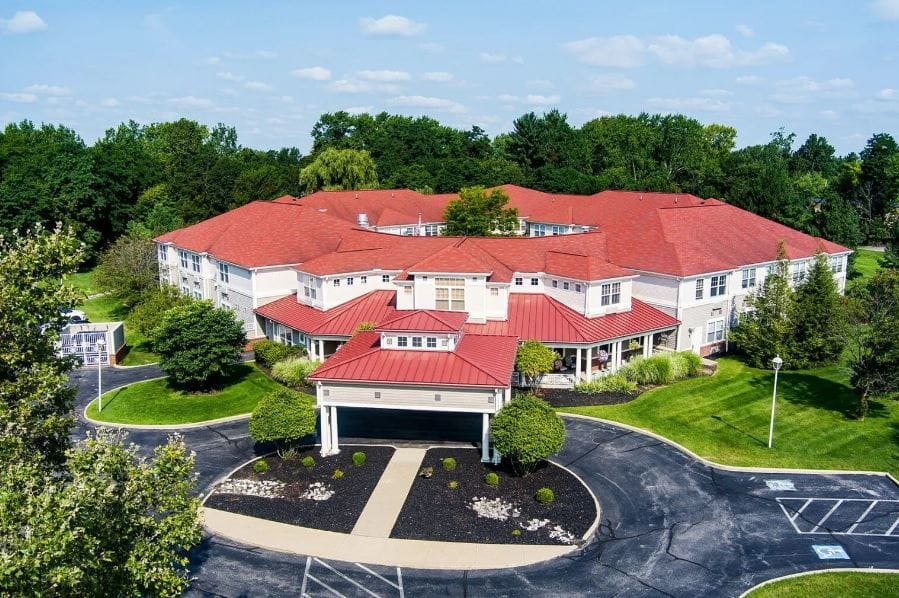
Settled in the peaceful surroundings of, the Southwest Commons by New Perspective is a remarkable senior living community providing assisted living services. Spacious and cozy accommodations are available depending on the preferences of its residents. With a highly skilled and compassionate team, his community offers a round-the-clock on-site and on-call nurse, along with a trained and dedicated team, to attend to the needs of its residents.

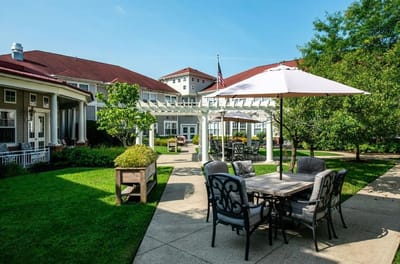
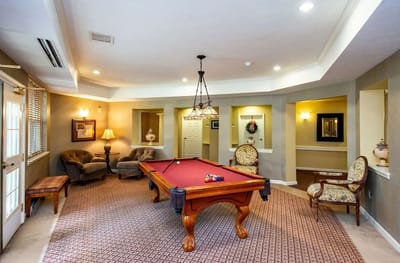
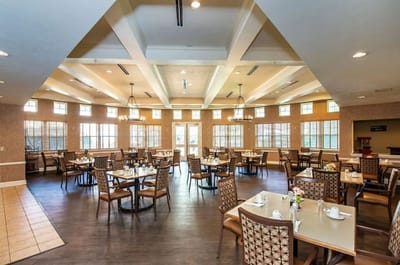
Experience its above-and-beyond amenities and services wherein residents can avail of housekeeping and laundry services, activity great room use, and services from on-site third-party physician providers. Indulge in chef-prepared healthy and delectable meals and relieve yourself through its beautiful spaces like the garden patio. Meet new companions and create meaningful memories by going to community outings with provided transportation. With the Southwest Commons by New Perspective, seniors are guaranteed a wondrous living experience.

(440) 238-3777

Quality ratings

Measured by Centers for Medicare & Medicaid Services (CMS)

Overall rating Info The Overall CMS Rating combines results from health inspections, staffing levels and quality measures. Health inspections carry the most weight. Staffing and quality scores can increase or decrease the final rating based on performance compared to state and national standards.
▲ 17.6% Above OH avg. ▲ 17.6% Above OH avg.Click the badge to see the full State ranking.Click here to see the full State ranking.
Health Inspection Info Based on the results of the facility's three most recent standard inspections and any complaint investigations. CMS reviews the number, scope, and severity of deficiencies, with more recent findings weighted more heavily.
▲ 38.9% Above OH avg. ▲ 38.9% Above OH avg.Click the badge to see the full State ranking.Click here to see the full State ranking.
Staffing Info Measures average nursing staff hours per resident per day, including Registered Nurses (RNs) and total nursing staff. Ratings are adjusted based on the level of care residents require and are compared to state and national benchmarks.
▲ 40.4% Above OH avg. ▲ 40.4% Above OH avg.Click the badge to see the full State ranking.Click here to see the full State ranking.
Quality Measures Info Based on clinical and physical health indicators reported to CMS, such as hospital readmissions, falls, pressure ulcers, and improvements in mobility. These measures reflect how well residents' health needs are being managed.
▼ 32.1% Below OH avg. ▼ 32.1% Below OH avg.Click the badge to see the full State ranking.Click here to see the full State ranking.

Staffing hours breakdown

Info Daily nursing hours per resident by staff type, reported to CMS. Higher is generally better — compare this facility to state and national averages to see where staffing stands.

Hours per resident per day — compared to Ohio state averages

Total nursing care / resident Info This home is ranked 7th out of 203 homes in Ohio for nurse hours. Total adjusted nursing hours per resident per day, combining RN, LPN, and aide time. CMS adjusts this for case-mix so facilities can be fairly compared.
5h 47m per day
Rank #7 / 203Nurse hours — State benchmarkedThis home is ranked 7th out of 203 homes in Ohio. Shows adjusted nurse hours per resident per day benchmarked to the Ohio average, with a ranking across 203 Ohio facilities. More hours mean more direct care. The national average is about 3.5 hrs; below 3.0 is a red flag.Click the rank badge to see the full State ranking.Click here to see the full State ranking.
This facility Ohio avg (3h 50m per day)
vs Ohio avg
+51%

2 of 6 metrics below state avg

Standout metric LPN / LVN is +67% above state avg
Staff typeHours / Day / Residentvs state avg
Registered Nurse (RN) Info RNs hold the highest nursing license and can assess residents, interpret test results, and direct care plans. More RN hours per day often signals stronger clinical oversight and faster response to health changes. 30m per day ▼ 21% State avg: 38m per day · National avg: 41m per day
LPN / LVN Info Licensed Practical Nurses (LPNs) or Licensed Vocational Nurses (LVNs) deliver routine hands-on care — medication administration, wound dressing, and monitoring vital signs. They work under RN supervision and make up a large share of daily bedside care. 1h 37m per day ▲ 67% State avg: 58m per day · National avg: 52m per day
Nurse Aide Info Certified Nurse Aides (CNAs) provide the most direct day-to-day assistance: bathing, dressing, feeding, and mobility. Nurse aide hours are typically the largest staffing category and directly affect residents' quality of life. 3h 18m per day ▲ 55% State avg: 2h 7m per day · National avg: 2h 20m per day
Weekend Total Nursing Info Combined nursing hours (RN + LPN + Nurse Aide) per resident per day on weekends. Staffing often drops on weekends — this figure reveals whether the facility maintains adequate coverage outside of weekday hours. 4h 53m per day ▲ 47% State avg: 3h 20m per day · National avg: 3h 27m per day
Physical Therapist Info Hours per resident per day provided by licensed Physical Therapists (PTs) or PT Assistants. PT services help residents recover mobility after injury or illness and are especially important for post-acute (short-stay) rehabilitation. 4m per day ▲ 23% State avg: 3m per day · National avg: 4m per day
Weekend RN Info Registered nurse hours specifically on weekends. Facilities sometimes reduce RN presence on Saturdays and Sundays — a low weekend RN figure compared to weekday hours can indicate reduced clinical oversight when most administrative staff are absent. 16m per day ▼ 36% State avg: 25m per day · National avg: 29m per day

Capacity and availability

This home usually has limited availability

Higher occupancy than the Ohio average: 78.7%
Occupancy rate
91.1% Rank #56 / 204Occupancy rate — State benchmarkedThis home is ranked 56th out of 204 homes in Ohio. Shows this facility's occupancy rate versus the Ohio average, with its Statewide rank out of 204. Higher occupancy signals strong local demand and financial stability.Click the rank badge to see the full State ranking.Click here to see the full State ranking.
Avg. Length of Stay
201 days
Years in operation
18 years in operation
A longer operating history, which may indicate experience navigating regulations and delivering ongoing care.
Walk Score
Walk Score: 52 / 100 Rank #229 / 705Walk Score — State benchmarkedThis home is ranked 229th out of 705 homes in Ohio. Shows how walkable this facility's neighborhood is compared to the average Walk Score across Ohio facilities. Higher scores benefit residents, families, and staff.Click the rank badge to see the full State ranking.Click here to see the full State ranking.
Moderately walkable. Some errands can be accomplished on foot, with a mix of nearby amenities.
BBB Rating
BBB Rating: A+ (Accredited)
An independent rating from the Better Business Bureau based on factors such as complaint history, transparency, and business practices.
How BBB ratings work

About this community

Staffing

Key information about the people who lead and staff this community.

Leadership

ContactLori Volkman

Contact SouthWest Commons by New Perspective

Inspection History

In Ohio, the Department of Health, Bureau of Survey and Certification conducts unannounced onsite inspections to evaluate the quality of care and environment in all licensed facilities.

Since 2019 · 7 years of data 14 citations 5 inspections

Inspection Scorecard Info This scorecard compares key inspection, citation, and complaint metrics at this facility against the Ohio state average. Metrics rated ≥15% worse than average are highlighted in red; those ≥15% better are highlighted in green.

Since 2019 vs. Ohio state average
Overall vs. OH average 4 Worse Metrics worse than Ohio average:
• Total citations (600% above)
• Citations per year (567% above)
• Citations per inspection (180% above)
• Total inspections (150% above)
0 Better No metrics in this bucket.
Latest Inspection April 10, 2025 Other An inspection that falls outside standard annual surveys and formal complaint investigations. May include administrative compliance checks, documentation reviews, focused surveys on specific concerns, or revisit surveys to verify prior corrections.

Citations Info Citations are formal regulatory issues recorded during state inspections.

This FacilityOH Averagevs. OH Avg
Total citations Info Formal regulatory issues recorded by inspectors across all inspection types. 142 This facility has 600% more total citations than a typical Ohio assisted living residence (14 vs. OH avg 2).↑ 600% worse
Citations per year Info Average citations per year since 2019. 20.3 This facility has 567% more citations per year than a typical Ohio assisted living residence (2 vs. OH avg 0.3).↑ 567% worse
Citations per inspection Info Average citations per inspection. 2.81 This facility has 180% more citations per inspection than a typical Ohio assisted living residence (2.8 vs. OH avg 1).↑ 180% worse

Inspections Info State inspections evaluate whether the facility meets health and safety standards.

This FacilityOH Averagevs. OH Avg
Total inspections Info Combined count of all routine and focused inspections. Excludes complaint investigations. 52 This facility has 150% more total inspections than a typical Ohio assisted living residence (5 vs. OH avg 2).↑ 150% worse

Health Inspection History

Inspections since 2019
Total health inspections 5

Ohio average 6.7


Last Health inspection on Apr 2025

Total health citations
14 Rank #42 / 203Health citations — State benchmarkedThis home is ranked 42nd out of 203 homes in Ohio. Shows this facility's total health deficiency citations benchmarked to the Ohio State average, with a ranking across all 203 OH facilities. Lower citation counts earn a better rank.Click the rank badge to see the full State ranking.Click here to see the full State ranking.

Ohio average 30.9

Citations per inspection
2.8 Rank #36 / 203Citations per inspection — State benchmarkedThis home is ranked 36th out of 203 homes in Ohio. Shows average deficiency citations per CMS inspection for this facility versus the Ohio mean across 203 facilities with citation data. Lower is better.Click the rank badge to see the full State ranking.Click here to see the full State ranking.

Ohio average 4.59


Health citations are formal notices following inspections when they fail to comply with safety and care standards.

11 of 14 citations resulted from standard inspections; and 3 of 14 resulted from complaint investigations.

Breakdown of citation severity (last 7 years)
Critical health citations
0
100% better than Ohio average

Ohio average: 0.3


Serious health citations
1
11% worse than Ohio average

Ohio average: 0.9

0 critical citations Ohio average: 0.3

1 serious citation Ohio average: 0.9

10 moderate citations Ohio average: 29

3 minor citations Ohio average: 0.7
Citations history (last 7 years)
Administration moderate citation Apr 10, 2025
Corrected

Nursing Services minor citation Apr 10, 2025
Corrected

Pharmacy moderate citation Apr 10, 2025
Corrected

Quality of Care moderate citation Oct 05, 2023
Corrected

Staffing Data

Reporting period: October 1 – December 31, 2025 (Q4 2025). Source: CMS Payroll-Based Journal report.

Total staff 220
Employees 95
Contractors 125
Staff to resident ratio 2.68 : 1
32% more staff per resident than Ohio average
Ohio average ratio: 2.04 : 1 Ohio average ratio: 2.04 : 1See full Ohio ranking
Avg staff/day 60
Average shift 8.1 hours
0% compared with Ohio average
Ohio average: 8.1 hours Ohio average shift: 8.1 hoursSee full Ohio ranking
Total staff hours (quarter) 44,598

Nursing staff breakdown

Q4 2025 · Oct 1 – Dec 31 More info This data comes from the CMS Payroll-Based Journal report covering October 1 – December 31, 2025.
Registered Nurse

Manages medical care and health needs.

RN Staff Info All 9 RN Staff are full-time employees. No contractors work on this role. 9
Average shift length Info Average shift length. Calculated as total hours divided by days worked and average staff per day. 8.5 hours
Licensed Practical Nurse

Assists with medical care and medications.

LPN Staff Info 60 total: 28 full-time employees and 32 contractors. 60
Average shift length Info Average shift length. Calculated as total hours divided by days worked and average staff per day. 8.7 hours
Certified Nursing Assistant

Helps with daily care and mobility.

CNA Staff Info 125 total: 49 full-time employees and 76 contractors. 125
Average shift length Info Average shift length. Calculated as total hours divided by days worked and average staff per day. 8.4 hours

Contractor staffing

Q4 2025 · Oct 1 – Dec 31 More info This data comes from the CMS Payroll-Based Journal report covering October 1 – December 31, 2025.

Total hours from contractors

23%

10,264 contractor hours this quarter

Certified Nursing Assistant: 76 Licensed Practical Nurse: 32 Speech Language Pathologist: 4 Qualified Social Worker: 4 Respiratory Therapy Technician: 3 Physical Therapy Assistant: 2 Physical Therapy Aide: 2 Occupational Therapy Aide: 1 Occupational Therapy Assistant: 1

Staff by category

Q4 2025 · Oct 1 – Dec 31 More info This data comes from the CMS Payroll-Based Journal report covering October 1 – December 31, 2025.
Certified Nursing Assistant497612524,63892100%8.4
Licensed Practical Nurse28326011,48292100%8.7
Registered Nurse9092,88392100%8.5
Other Dietary Services Staff4041,5868693%7.4
RN Director of Nursing2025808289%5.1
Administrator1015186267%8.4
Respiratory Therapy Technician0334916773%7.3
Clinical Nurse Specialist1014736470%7.4
Physical Therapy Aide0224507683%5.9
Speech Language Pathologist0444327379%5.9
Nurse Practitioner1014125863%7.1
Occupational Therapy Aide0112142729%7.9
Physical Therapy Assistant0222116470%3.3
Qualified Social Worker0441986267%3.1
Occupational Therapy Assistant0113067%4.9
125 Certified Nursing Assistant
% of Days 100%
60 Licensed Practical Nurse
% of Days 100%
9 Registered Nurse
% of Days 100%
4 Other Dietary Services Staff
% of Days 93%
2 RN Director of Nursing
% of Days 89%
1 Administrator
% of Days 67%
3 Respiratory Therapy Technician
% of Days 73%
1 Clinical Nurse Specialist
% of Days 70%
2 Physical Therapy Aide
% of Days 83%
4 Speech Language Pathologist
% of Days 79%
1 Nurse Practitioner
% of Days 63%
1 Occupational Therapy Aide
% of Days 29%
2 Physical Therapy Assistant
% of Days 70%
4 Qualified Social Worker
% of Days 67%
1 Occupational Therapy Assistant
% of Days 7%

Penalties and fines

Federal penalties imposed by CMS for regulatory violations, including civil money penalties (fines) and denials of payment for new Medicare/Medicaid admissions.

Source: CMS Penalties Database

No penalties in the past 3 years

No civil money penalties or payment denials were reported in the last 3 years.

Quality of care over time

These measures show how residents usually do over time at this home, based on health outcomes and preventive care.

High-risk clinical events score Info A composite score based on pressure ulcers, falls with injury, weight loss, walking ability decline, and activities of daily living decline. 7.9
36% worse than Ohio average

Ohio average: 5.8

Functional decline score Info A composite score based on activities of daily living decline, walking ability decline, and incontinence. 12.6
In line with Ohio average

Ohio average: 12.7

Long-stay resident measures
Need for Help with Daily Activities Increased Info Percent of long-stay residents whose need for help with daily activities has increased 14.8%
116% worse than Ohio average

Ohio average: 6.8%

Walking Ability Worsened Info Percent of long-stay residents whose ability to move independently worsened 14.4%
62% worse than Ohio average

Ohio average: 8.9%

Low Risk Residents with Bowel/Bladder Incontinence Info Percent of low risk long-stay residents who lose control of their bowels or bladder 8.7%
61% better than Ohio average

Ohio average: 22.0%

Falls with Major Injury Info Percent of long-stay residents experiencing one or more falls with major injury 4.0%
16% worse than Ohio average

Ohio average: 3.4%

High Risk Residents with Pressure Ulcers Info Percent of long-stay high risk residents with pressure ulcers 3.7%
6% better than Ohio average

Ohio average: 3.9%

Urinary Tract Infection Info Percent of long-stay residents with a urinary tract infection 1.7%
204% worse than Ohio average

Ohio average: 0.5%

Lost Too Much Weight Info Percent of long-stay residents who lose too much weight 2.9%
53% better than Ohio average

Ohio average: 6.2%

Depressive Symptoms Info Percent of long-stay residents who have depressive symptoms 6.5%
73% better than Ohio average

Ohio average: 24.0%

Antipsychotic Use Info Percent of long-stay residents who received an antipsychotic medication 12.7%
51% worse than Ohio average

Ohio average: 8.4%

Pneumococcal Vaccine Info Percent of long-stay residents assessed and appropriately given the pneumococcal vaccine 91.4%
In line with Ohio average

Ohio average: 92.4%

Influenza Vaccine Info Percent of long-stay residents assessed and appropriately given the seasonal influenza vaccine 100.0%
6% better than Ohio average

Ohio average: 94.5%

Short-stay resident measures
Pneumococcal Vaccine Info Percent of short-stay residents assessed and appropriately given the pneumococcal vaccine 35.0%
55% worse than Ohio average

Ohio average: 78.0%

Antipsychotic medication increase Info Percent of short-stay residents who newly received an antipsychotic medication 0.0%
100% better than Ohio average

Ohio average: 1.3%

Influenza Vaccine Info Percent of short-stay residents assessed and appropriately given the seasonal influenza vaccine 38.0%
50% worse than Ohio average

Ohio average: 75.6%

Breakdown by payment type

Medicare

36% of new residents, usually for short-term rehab.

Typical stay 27 days

Private pay

45% of new residents, often for short stays.

Typical stay 4 - 5 months

Medicaid

19% of new residents, often for long-term daily care.

Typical stay 2 years

Facility Characteristics

Source: CMS Long-Term Care Facility Characteristics (Data as of Jan 2026)

Total residents 82
Medicare
2
2.4% of residents
Medicaid
50
61% of residents
Private pay or other
30
36.6% of residents
Programs & Services
Residents Group

Residents meet regularly to discuss policies, care quality, and activities

Active Resident Council

Organized group of residents that meets regularly to discuss facility policies, quality of life, and activities.

Finances and operations

Governmental community
Operated by a subsidized facility district.
Home revenue
$11.2M
Operating deficit
-$1.5M
Governmental community Operated by a subsidized facility district.
Home revenue
$11.2M Rank #101 / 203Revenue — State benchmarkedThis home is ranked 101st out of 203 homes in Ohio. Shows this facility's annual revenue compared to the Ohio average. Higher revenue generally means more resources for staffing and capital — read alongside Payroll %.Click the rank badge to see the full State ranking.Click here to see the full State ranking.
Operating deficit
-$1.5M
Payroll costs Info The portion of the home's budget spent on staff, including nurses, caregivers, and other employees who support care and operations. Rank #75 / 203Payroll — State benchmarkedThis home is ranked 75th out of 203 homes in Ohio. Shows total annual staff payroll benchmarked to the Ohio average. Higher payroll investment relative to peers often signals better staffing and less reliance on cheaper contract labor.Click the rank badge to see the full State ranking.Click here to see the full State ranking.
$6.1M
54.3% of revenue Rank #64 / 203Payroll % — State benchmarkedThis home is ranked 64th out of 203 homes in Ohio. Shows payroll as a percentage of revenue versus the Ohio average. Well-run Ohio facilities typically land around 54–64% — the top third Statewide. Below 25% may signal understaffing or heavy agency use — read with Staffing ratings.Click the rank badge to see the full State ranking.Click here to see the full State ranking.
Other operating costs Info All remaining costs needed to run the home, such as food, utilities, building maintenance, supplies and administrative expenses.
$6.7M
Total costs $12.8M

What does this home offer?

Pets allowed icon
Pets allowed icon

Pets Allowed

Housing options icon

Housing Options: Studio / 1 Bed

Building type icon
Building type icon

Building Type: 2-story

Transportation services icon

Transportation Services

Fitness and recreation icon

Fitness and Recreation

Who this home usually serves

TYPE OF STAY

Mix of rehab and long-term care

This home supports both short-term rehab and long-term care, with residents staying for a wide range of durations.

Places of interest near SouthWest Commons by New Perspective

Address 21.9 miles from city center Info Estimated distance in miles from Strongsville's city center to SouthWest Commons by New Perspective's address, calculated via Google Maps.

Calculate Travel Distance to SouthWest Commons by New Perspective

Add your location

Address

Financial Assistance for
Assisted Living in Ohio

SouthWest Commons by New Perspective is located in Strongsville, Ohio.
Here are the financial assistance programs available to residents in Ohio.

Get Financial aid guidance

PASSPORT Waiver

Ohio Medicaid PASSPORT

Age 60+
General Ohio resident, Medicaid-eligible, nursing home-level care need.
Income Limits (2025) ~$2,829/month 300% FBR, individual
Asset Limits $2,000 (individual), $3,000 (couple).
OH

Administered through regional agencies; waitlists possible.

Benefits
Personal care (5-7 hours/day) Respite (240 hours/year) Adult day care ($65/day) Home modifications ($1,500 avg.)

Ohio Home Care Program (non-Medicaid)

OH HCP

Age 60+
General Ohio resident, at risk of decline.
Income Limits ~$2,000/month individual, varies
Asset Limits $5,000 individual
OH

Limited funding; regional variation.

Benefits
In-home care (3-5 hours/week) Respite (up to 10 days/year) Transportation (~5 trips/month)

Assisted Living Waiver (ALW)

Ohio Assisted Living Waiver

Age 21+ (65+ prioritized)
General OH resident, Medicaid-eligible, NFLOC.
Income Limits (2025) ~$2,829/month (individual); QIT required.
Asset Limits $2,000 (individual), $3,000 (couple).
OH

Covers ~300 facilities; room/board not included (separate cost).

Benefits
Personal care Meals Medication management Transportation (~$3,000-$4,000/month value)

Program of All-Inclusive Care for the Elderly (PACE)

Ohio PACE (e.g., McGregor PACE)

Age 55+
General OH resident (specific counties), NFLOC, safe with PACE support.
Income Limits (2025) ~$2,829/month (Medicaid-eligible); private pay option available.
Asset Limits $2,000 (individual), $3,000 (couple) for Medicaid enrollees.
OH

Available in 9 counties (e.g., Cuyahoga, Franklin); expanding via Healthy Aging Grants.

Benefits
Personal care (5-7 hours/day) Medical care Meals Transportation Respite Therapies

Medicare Savings Program (MSP)

Ohio Medicare Savings Program

Age 65+ or disabled
General OH resident, Medicare Part A/B.
Income Limits (2025) ~$2,510/month (QMB), ~$3,380/month (SLMB), ~$3,598/month (QI)—individual.
Asset Limits $9,430 (individual), $14,130 (couple).
OH

Three tiers; includes Extra Help for Part D; no waitlist.

Benefits
Covers Part B premiums ($174.70/month) Deductibles ($240/year) Copays (~20%)

Home Energy Assistance Program (HEAP)

Ohio HEAP

Age 60+ prioritized
General OH resident, low-income household.
Income Limits (2025) ~$3,970/month individual, 185% FPL
Asset Limits Not assessed; income-focused.
OH

Covers gas, electric, oil; emergency aid via Winter/Summer Crisis Programs.

Benefits
Heating/cooling aid ($300-$1,000/season) Emergency aid ($500 max)

Family Caregiver Support Program (FCSP)

Ohio Family Caregiver Support Program

Age
General Caregivers of 60+ needing care or 55+ caregivers of others; OH resident; functional needs (2+ ADLs).
Income Limits (2025) Prioritizes ~$24,980/year (individual); no strict cap.
Asset Limits Not assessed; need-based.
OH

12 AAAs; rural/low-income priority; volunteer respite option.

Benefits
Respite (4-6 hours/week or 5 days/year) Adult day care ($60/day) Training Supplies (~$500/year)

VA Aid and Attendance (A&A) and Housebound Benefits

Ohio VA Aid and Attendance/Housebound

Age 65+ or disabled veteran/spouse
General OH resident, wartime service, need for ADL help (A&A) or homebound.
Income Limits (2025) Net income < ~$1,984/month (veteran with dependent, A&A); pension offsets income.
Asset Limits ~$155,356 net worth limit
OH

High veteran demand; supports care in multiple settings.

Benefits
Cash (~$1,433-$2,642/month veteran, ~$951-$1,318 spouse) for care costs (e.g., in-home, assisted living)

Homestead Exemption

Ohio Homestead Exemption

Age 65+ (or disabled)
General OH resident, homeowner, low-income.
Income Limits (2025) ~$38,500/year individual, adjusted annually
Asset Limits Not assessed; home ownership required.
OH

Reduces taxable value by $25,000; applies to primary residence.

Benefits
Tax reduction (~$400-$800/year avg., varies by county)

Save the Dream Ohio (Homeowner Assistance Fund)

Ohio Save the Dream

Age 60+ prioritized
General OH resident, homeowner, hardship post-Jan 21, 2020.
Income Limits (2025) ~$147,600/year family of 4, 150% AMI; varies by county
Asset Limits Not assessed; hardship-focused.
OH

Covers delinquent mortgages, utilities, taxes; max $25,000 mortgage aid.

Benefits
Mortgage aid ($25,000 max) Utility/property tax aid ($5,000 avg.)

Frequently Asked Questions about SouthWest Commons by New Perspective

Is SouthWest Commons by New Perspective in a walkable area?

SouthWest Commons by New Perspective has a walk score of 52. Moderately walkable. Some errands can be accomplished on foot, with a mix of nearby amenities.

Are there photos of SouthWest Commons by New Perspective?

Yes — there are 4 photos of SouthWest Commons by New Perspective in the photo gallery on this page.

What is the phone number of SouthWest Commons by New Perspective?

(440) 238-3777 will put you in contact with the team at SouthWest Commons by New Perspective.

Is SouthWest Commons by New Perspective Medicare or Medicaid certified?

Yes — SouthWest Commons by New Perspective is a CMS-certified provider of Medicare and Medicaid.

Guides for Better Senior Living

Care Cost Calculator: See Prices in Your Area

Nursing Home Data Explorer

Don’t Wait Too Long: 7 Red Flag Signs Your Parent Needs Assisted Living Now

The True Cost of Assisted Living in 2025 – And How Families Are Paying For It

Understanding Senior Living Costs: Pricing Models, Discounts & Financial Assistance

Explore Open Rooms
1 Contact details
2 What type of senior care service are you looking for?
3 What budget do you have in mind for senior care?
4 How soon do you need to find care?
5 Additional details

Thank you for your interest!

Our team will be in touch shortly to help with next steps.