Explore Open Rooms

1 Contact details
2 What type of senior care service are you looking for?
3 What budget do you have in mind for senior care?
4 How soon do you need to find care?
5 Additional details

Thank you for your interest!

Our team will be in touch shortly to help with next steps.

Nursing Home

Spaulding Nursing and Therapy Center in Brighton

Nursing Home

Spaulding Nursing and Therapy Center in Brighton

100 N Beacon St, Allston, MA 02134 View map
Overview of Spaulding Nursing and Therapy Center in Brighton

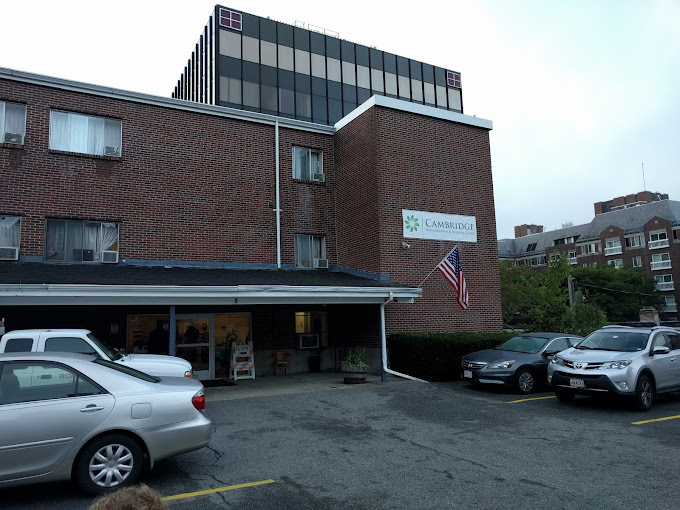
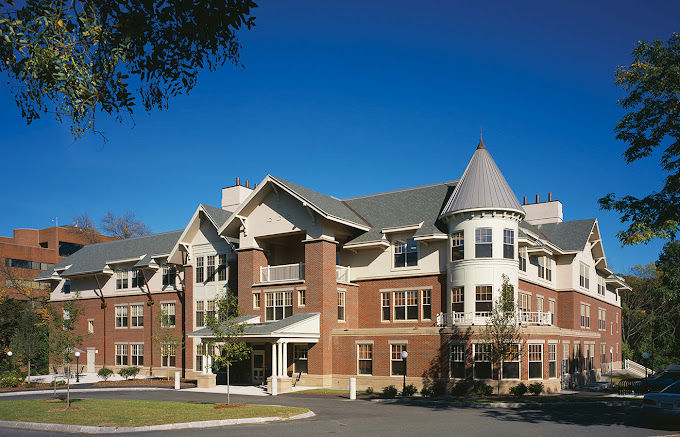
At Spaulding Nursing and Therapy Center in Brighton, the commitment to excellence is an ongoing journey, marked by their dedication to collaboration and the continuous refinement of their supportive team. Situated in the heart of Boston, Massachusetts, this establishment boasts a stellar reputation in the realm of senior care. Their unwavering focus lies in delivering an unparalleled experience, brought to life by their seasoned nursing, therapy, and clinical staff.

With a profound emphasis on personalization, they craft rehabilitation and recovery plans that harness the power of evidence-based approaches. This encompassing approach spans a wide spectrum, encompassing amputations, burns, heart conditions, spinal cord injuries, neurological disorders, and beyond. Recognized for their exceptional standards, this award-winning facility stands out in the realm of skilled nursing, setting a remarkable benchmark for comprehensive care. Moreover, their expertise extends to specialized programs and services catering to individuals facing challenges such as Parkinson’s disease, stroke, and more, affirming their dedication to addressing diverse needs with utmost proficiency.

Quality ratings

Measured by Centers for Medicare & Medicaid Services (CMS)

Overall rating Info The Overall CMS Rating combines results from health inspections, staffing levels and quality measures. Health inspections carry the most weight. Staffing and quality scores can increase or decrease the final rating based on performance compared to state and national standards.
5/5
Massachusetts average: 2.9/5
Health Inspection Info Based on the results of the facility's three most recent standard inspections and any complaint investigations. CMS reviews the number, scope, and severity of deficiencies, with more recent findings weighted more heavily.
4/5
Massachusetts average: 2.8/5
Staffing Info Measures average nursing staff hours per resident per day, including Registered Nurses (RNs) and total nursing staff. Ratings are adjusted based on the level of care residents require and are compared to state and national benchmarks.
5/5
Massachusetts average: 3.0/5
Quality Measures Info Based on clinical and physical health indicators reported to CMS, such as hospital readmissions, falls, pressure ulcers, and improvements in mobility. These measures reflect how well residents' health needs are being managed.
4/5
Massachusetts average: 3.2/5

Nursing care per resident

Info This shows how many total hours of nursing staff time are available per resident each day. Higher numbers usually mean more staff support.
8h 52m per day

This home provides 125% more nursing time per resident than the Massachusetts average.

Massachusetts average: 3h 56m per day

Staffing hours breakdown

Info Hours of care per resident per day, broken down by staff type. Data from CMS Medicare.
Staff type Facility State avg National avg
Registered Nurse (RN) Info Registered nurse hours per resident per day. 3h 27m per day 39m per day 41m per day
Nurse Aide Info Nurse aide hours per resident per day. 4h 23m per day 2h 16m per day 2h 21m per day
Total Nursing (Weekend) Info Total number of nurse staff hours per resident per day on weekends. 7h 1m per day 3h 27m per day 3h 26m per day
Physical Therapist Info Physical therapist staff hours per resident per day. 31m per day 4m per day 4m per day
RN (Weekend) Info Registered nurse hours per resident per day on weekends. 2h 27m per day 28m per day 29m per day

Capacity and availability

Medium-capacity home

Offers a balance of services and community atmosphere.

Total beds 123

This home usually has availability

Lower occupancy suggests more openings may be available.

Lower demand than the Massachusetts average
Occupancy rate 61.9%
Residents per day (avg) 90
Occupancy rate
61.9%
Residents per day (avg)
90

Who this home usually serves

TYPE OF STAY

Mostly short-term rehab stays

Most residents typically stay for a few weeks or months before returning home or moving on.

Might be optimal for
Short stays Recovery Medicare-covered care

Breakdown by payment type

Medicare

58% of new residents, usually for short-term rehab.

Typical stay 17 days

Private pay

22% of new residents, often for short stays.

Typical stay 1 - 2 months

Medicaid

21% of new residents, often for long-term daily care.

Typical stay 24 days

Finances and operations

Voluntary non-profit community
Home revenue
$52.0M
Operating deficit
-$9.7M
Voluntary non-profit community
Home revenue
$52,017,518.00
Operating deficit
$-9,748,848.00
Payroll costs Info The portion of the home's budget spent on staff, including nurses, caregivers, and other employees who support care and operations.
$18.8M
36.2% of revenue
Other operating costs Info All remaining costs needed to run the home, such as food, utilities, building maintenance, supplies and administrative expenses.
$43.0M
Total costs $61.8M

Types of Care at Spaulding Nursing and Therapy Center in Brighton

Skilled Nursing
Contact Spaulding Nursing and Therapy Center in Brighton

Health Inspection History

Inspections
Total health inspections 3

Massachusetts average 4.5


Last Health inspection on Mar 2025

Total health citations 7

Massachusetts average 32.7

Citations per inspection
2.33

Massachusetts average 7.24


Health citations are formal notices following inspections when they fail to comply with safety and care standards.

5 of 7 citations resulted from standard inspections; and 2 of 7 resulted from complaint investigations.

Breakdown of citation severity (last 3 years)
Critical Health citations More info 0
100% better than Massachusetts average

Massachusetts average: 0.3


Serious Health citations More info 1
33% better than Massachusetts average

Massachusetts average: 1.5

0 critical citations More info Massachusetts average: 0.3

1 serious citation More info Massachusetts average: 1.5

6 moderate citations More info Massachusetts average: 29.7

0 minor citations More info Massachusetts average: 1.3
Citations history (last 3 years)
Infection Control moderate citation Info Issues related to preventing and controlling infections, including hygiene practices and safety protocols. Mar 12, 2025
Corrected

Pharmacy moderate citation Info Issues related to medication management, including how drugs are stored, administered, and monitored. Mar 12, 2025
Corrected

Pharmacy moderate citation Info Issues related to medication management, including how drugs are stored, administered, and monitored. Mar 12, 2025
Corrected

Quality of Care moderate citation Info Issues related to how well residents receive appropriate treatment and support for their medical and daily care needs. Mar 12, 2025
Corrected

Compare Nursing Homes around Cambridge The information below is reported by the Massachusetts Executive Office of Elder Affairs and Department of Public Health.

5 facilities compared · CMS & MA Dept. of Health data · Updated Apr 2026

Spaulding Nursing and Therapy Center in Brighton
NH

Nursing Home Licensed facility providing 24/7 skilled nursing care for residents with complex, ongoing medical needs. Staffed by RNs, LPNs, and CNAs. Inspected and star-rated annually by CMS. Accepts Medicare (short-term rehab) and Medicaid (long-term care).

AL

Assisted Living A licensed, long-term care setting for seniors or individuals with disabilities who need help with daily activities — like bathing, dressing, and medication management — but not 24-hour skilled nursing. Offers housing, meals, and around-the-clock support while aiming to maximize resident independence.

N

Nursing

Allston (Brighton)
123
61.9%
-24%
8.86
+96%
+125%
1
7
1
90
91
Mass General Brigham Incorporated
$51,9M
$18,8M
36.2%
225014
Cambridge Rehabilitation & Nursing Center
NH

Nursing Home Licensed facility providing 24/7 skilled nursing care for residents with complex, ongoing medical needs. Staffed by RNs, LPNs, and CNAs. Inspected and star-rated annually by CMS. Accepts Medicare (short-term rehab) and Medicaid (long-term care).

AL

Assisted Living A licensed, long-term care setting for seniors or individuals with disabilities who need help with daily activities — like bathing, dressing, and medication management — but not 24-hour skilled nursing. Offers housing, meals, and around-the-clock support while aiming to maximize resident independence.

HC

Home Care Professional care delivered in the person's own home — from companionship and errands to skilled nursing and therapy. Allows seniors to age in place. Medicare covers skilled home health when medically necessary.

N

Nursing

Cambridge (Mid-Cambridge)
83
89.3%
+9%
4.07
+31%
+4%
0
22
0
76
95
Cambridge Center Holdings Llc
$18,6M
$5,1M
27.6%
225520
Neville Center at Fresh Pond
NH

Nursing Home Licensed facility providing 24/7 skilled nursing care for residents with complex, ongoing medical needs. Staffed by RNs, LPNs, and CNAs. Inspected and star-rated annually by CMS. Accepts Medicare (short-term rehab) and Medicaid (long-term care).

AL

Assisted Living A licensed, long-term care setting for seniors or individuals with disabilities who need help with daily activities — like bathing, dressing, and medication management — but not 24-hour skilled nursing. Offers housing, meals, and around-the-clock support while aiming to maximize resident independence.

MC

Memory Care Secured, specialized care for people living with Alzheimer's or dementia. Staff trained in cognitive impairment, with higher staff-to-resident ratios and an environment designed to reduce confusion and wandering risk.

N

Nursing

Cambridge (Cambridge Highlands)
112
92.1%
+12%
4.21
-8%
+7%
0
20
0
92
63
Neville Communities Home Inc
$23,5M
$10,3M
43.8%
225378
Sancta Maria
NH

Nursing Home Licensed facility providing 24/7 skilled nursing care for residents with complex, ongoing medical needs. Staffed by RNs, LPNs, and CNAs. Inspected and star-rated annually by CMS. Accepts Medicare (short-term rehab) and Medicaid (long-term care).

AL

Assisted Living A licensed, long-term care setting for seniors or individuals with disabilities who need help with daily activities — like bathing, dressing, and medication management — but not 24-hour skilled nursing. Offers housing, meals, and around-the-clock support while aiming to maximize resident independence.

N

Nursing

Cambridge (Cambridge Highlands)
136
93.8%
+14%
4.08
-2%
+4%
1
38
0
127
68
Dubois, Amber
$26,5M
$11,7M
44.2%
225573
Watertown Rehabilitation and Nursing Center
NH

Nursing Home Licensed facility providing 24/7 skilled nursing care for residents with complex, ongoing medical needs. Staffed by RNs, LPNs, and CNAs. Inspected and star-rated annually by CMS. Accepts Medicare (short-term rehab) and Medicaid (long-term care).

HC

Home Care Professional care delivered in the person's own home — from companionship and errands to skilled nursing and therapy. Allows seniors to age in place. Medicare covers skilled home health when medically necessary.

N

Nursing

Watertown
158
66.2%
-19%
2.81
+82%
-29%
2
60
1
124
78
Watertown Rehab Holdco Llc
$19,4M
$6,0M
31.1%
225425

Places of interest near Spaulding Nursing and Therapy Center in Brighton

Address 3 miles from city center — 0.37 miles to nearest hospital (Franciscan Children's)

Address 100 N Beacon St, Allston, MA 02134

Calculate Travel Distance to Spaulding Nursing and Therapy Center in Brighton

Add your location

Address

Staffing Data (Q2 2025)

This data corresponds to Q2 2025 and is based on CMS Payroll-Based Journal.

Total staff 260
Employees 243
Contractors 17
Staff to resident ratio 2.83:1
66% better than Massachusetts average

Massachusetts average ratio: 1.70:1

Avg staff/day 118
Average shift 8.5 hours
8% better than Massachusetts average

Massachusetts average: 7.9 hours

Total staff hours (quarter) 90,816
Nursing staff breakdown
Registered Nurse

Manages medical care and health needs.

Total count 66
Average shift length Info Average shift length. Calculated as total hours divided by days worked and average staff per day. 8.5 hours

This role is partially covered by contractors.

Licensed Practical Nurse

Assists with medical care and medications.

Total count 9
Average shift length Info Average shift length. Calculated as total hours divided by days worked and average staff per day. 9.6 hours

No contractors work on this role.

Certified Nursing Assistant

Helps with daily care and mobility.

Total count 89
Average shift length Info Average shift length. Calculated as total hours divided by days worked and average staff per day. 8.8 hours

This role is partially covered by contractors.

Contractor staffing

Total hours from contractors

7.9%

7,155 contractor hours this quarter

Registered Nurse: 8 Certified Nursing Assistant: 5 Mental Health Service Worker: 2 Medical Director: 1 Nurse Practitioner: 1
Staff by category
Certified Nursing Assistant8458938,80991100%8.8
Registered Nurse5886622,87891100%8.5
Physical Therapy Assistant260264,76391100%7.9
Clinical Nurse Specialist140144,66691100%8
Respiratory Therapy Technician180184,6598998%7.7
Licensed Practical Nurse9093,0189099%9.6
Dental Services Staff6062,2506774%7.9
Mental Health Service Worker5271,6207582%7.9
Other Dietary Services Staff6061,4009099%7.9
Therapeutic Recreation Specialist4041,3078088%8.2
Occupational Therapy Aide4049066673%7.1
Nurse Practitioner1129036268%8.6
Qualified Social Worker3038426571%7.8
Administrator1015126470%8
Occupational Therapy Assistant1015126470%8
Medical Director0114886167%8
Dietitian1014725965%8
RN Director of Nursing1014345662%7.8
Occupational Therapist1013764752%8
89 Certified Nursing Assistant
% of Days 100%
66 Registered Nurse
% of Days 100%
26 Physical Therapy Assistant
% of Days 100%
14 Clinical Nurse Specialist
% of Days 100%
18 Respiratory Therapy Technician
% of Days 98%
9 Licensed Practical Nurse
% of Days 99%
6 Dental Services Staff
% of Days 74%
7 Mental Health Service Worker
% of Days 82%
6 Other Dietary Services Staff
% of Days 99%
4 Therapeutic Recreation Specialist
% of Days 88%
4 Occupational Therapy Aide
% of Days 73%
2 Nurse Practitioner
% of Days 68%
3 Qualified Social Worker
% of Days 71%
1 Administrator
% of Days 70%
1 Occupational Therapy Assistant
% of Days 70%
1 Medical Director
% of Days 67%
1 Dietitian
% of Days 65%
1 RN Director of Nursing
% of Days 62%
1 Occupational Therapist
% of Days 52%

Facility Characteristics

Source: CMS Long-Term Care Facility Characteristics (Data as of Jan 2026)

Total census
92 residents
Residents by payment source
Medicare
38 residents (41.3%)
Medicaid
20 residents (21.7%)
Private pay or other
34 residents (37%)
Programs & Services
Residents' Group

Residents meet regularly to discuss policies, care quality, and activities

Active Resident Council

Organized group of residents that meets regularly to discuss facility policies, quality of life, and activities.

Quality of care over time

These measures show how residents usually do over time at this home, based on health outcomes and preventive care.

High-risk clinical events score Info A composite score based on pressure ulcers, falls with injury, weight loss, walking ability decline, and activities of daily living decline. 14.6
43% worse than Massachusetts average

Massachusetts average: 10.2

Functional decline score Info A composite score based on activities of daily living decline, walking ability decline, and incontinence. 24.3
21% worse than Massachusetts average

Massachusetts average: 20.0

Long-stay resident measures
Below average Massachusetts avg: 3.5 Info CMS star rating based on long-stay quality measure performance. 5 stars = significantly above average, 1 star = significantly below average.
Need for Help with Daily Activities Increased Info Percent of long-stay residents whose need for help with daily activities has increased 25.3%
36% worse than Massachusetts average

Massachusetts average: 18.7%

Walking Ability Worsened Info Percent of long-stay residents whose ability to move independently worsened 29.8%
54% worse than Massachusetts average

Massachusetts average: 19.3%

Low Risk Residents with Bowel/Bladder Incontinence Info Percent of low risk long-stay residents who lose control of their bowels or bladder 17.7%
20% better than Massachusetts average

Massachusetts average: 22.1%

Falls with Major Injury Info Percent of long-stay residents experiencing one or more falls with major injury 1.0%
72% better than Massachusetts average

Massachusetts average: 3.6%

High Risk Residents with Pressure Ulcers Info Percent of long-stay high risk residents with pressure ulcers 14.7%
216% worse than Massachusetts average

Massachusetts average: 4.7%

Urinary Tract Infection Info Percent of long-stay residents with a urinary tract infection 3.1%
48% worse than Massachusetts average

Massachusetts average: 2.1%

Lost Too Much Weight Info Percent of long-stay residents who lose too much weight 2.1%
60% better than Massachusetts average

Massachusetts average: 5.2%

Depressive Symptoms Info Percent of long-stay residents who have depressive symptoms 0.0%
100% better than Massachusetts average

Massachusetts average: 10.7%

Antipsychotic Use Info Percent of long-stay residents who received an antipsychotic medication 12.2%
40% better than Massachusetts average

Massachusetts average: 20.3%

Pneumococcal Vaccine Info Percent of long-stay residents assessed and appropriately given the pneumococcal vaccine 43.4%
53% worse than Massachusetts average

Massachusetts average: 91.9%

Influenza Vaccine Info Percent of long-stay residents assessed and appropriately given the seasonal influenza vaccine 93.3%
In line with Massachusetts average

Massachusetts average: 94.8%

Short-stay resident measures
Above average Massachusetts avg: 3.4 Info CMS star rating based on short-stay quality measure performance. 5 stars = much above average, 1 star = much below average.
Pneumococcal Vaccine Info Percent of short-stay residents assessed and appropriately given the pneumococcal vaccine 41.5%
46% worse than Massachusetts average

Massachusetts average: 76.7%

Antipsychotic medication increase Info Percent of short-stay residents who newly received an antipsychotic medication 0.8%
39% better than Massachusetts average

Massachusetts average: 1.3%

Influenza Vaccine Info Percent of short-stay residents assessed and appropriately given the seasonal influenza vaccine 88.9%
14% better than Massachusetts average

Massachusetts average: 77.7%

Re-hospitalized after SNF stay Info Percentage of short-stay residents who were re-hospitalized after their nursing home admission. 24.0%
7% better than Massachusetts average

Massachusetts average: 25.8%

Emergency department visits Info Percentage of short-stay residents who had an outpatient emergency department visit. 10.9%
8% better than Massachusetts average

Massachusetts average: 11.8%

Falls with major injury Info Percentage of SNF residents who experience falls with major injury during their stay. 0.1%
83% better than Massachusetts average

Massachusetts average: 0.8%

Ability to care for self at discharge Info Percentage of residents at or above expected ability to care for themselves at discharge. 52.5%
In line with Massachusetts average

Massachusetts average: 53.7%

Successful return to home or community Info Rate of successful return to home or community from a skilled nursing facility. 74.5%
47% better than Massachusetts average

Massachusetts average: 50.6%

Guides for Better Senior Living

Care Cost Calculator: See Prices in Your Area

Nursing Home Data Explorer

Don’t Wait Too Long: 7 Red Flag Signs Your Parent Needs Assisted Living Now

The True Cost of Assisted Living in 2025 – And How Families Are Paying For It

Understanding Senior Living Costs: Pricing Models, Discounts & Financial Assistance

Financial Aid for Massachusetts Seniors

Get financial aid guidance

Home Care Program

MassHealth Home Care

Age 60+, Massachusetts resident, at risk of nursing home placement.

~$1,500/month (individual, varies by region).

$2,000 (individual, excludes home, car).

Coordinated through Aging Services Access Points (ASAPs); high demand in urban areas.

Frail Elder Waiver

Massachusetts Medicaid FE Waiver

Age 65+, Massachusetts resident, Medicaid-eligible, nursing home-level care need.

~$2,829/month (300% FBR, individual).

$2,000 (individual), $3,000 (couple).

Requires clinical eligibility determination.

Senior Care Options (SCO)

Massachusetts Senior Care Options

Age 65+, Massachusetts resident, eligible for MassHealth (Medicare optional), nursing home-level care need.

~$2,829/month (300% FBR, individual); QIT allowed.

$2,000 (individual), $3,000 (couple) (excludes home up to $713,000, car).

Not available in Dukes/Nantucket Counties; multiple SCO providers (e.g., CCA, Tufts).

Medicare Savings Program (MSP)

Massachusetts Medicare Savings Program (MassHealth Buy-In)

Age 65+ or disabled, Massachusetts resident, Medicare Part A/B.

~$2,510/month (QMB), ~$3,380/month (SLMB), ~$3,598/month (QI)—individual.

$9,430 (individual), $14,130 (couple).

Three tiers; no waitlist; includes Extra Help for Part D.

National Family Caregiver Support Program (NFCSP) Respite

Massachusetts NFCSP Respite Care

Caregivers of 60+ needing care or 55+ caregivers of others; Massachusetts resident; functional needs (2+ ADLs).

Prioritizes ~$24,980/year (individual); no strict cap.

Not assessed; need-based.

27 ASAPs; prioritizes low-income, rural caregivers.

Prescription Advantage

Massachusetts Prescription Advantage

Age 65+ or disabled, Massachusetts resident, enrolled in Medicare Part D (or ineligible for Medicare).

No strict limit; copays vary by income (~$24,980-$75,000/year individual).

Not assessed.

Supplements Medicare Part D; no enrollment fee for low-income.

Senior Community Service Employment Program (SCSEP)

Massachusetts SCSEP

Age 55+, unemployed, low-income, Massachusetts resident.

~$1,983/month (125% FPL).

Not specified; income-focused.

Priority for veterans, rural residents; AARP partnership.

VA Aid and Attendance (A&A) and Housebound Benefits

Massachusetts VA Aid and Attendance/Housebound

Age 65+ or disabled veteran/spouse, Massachusetts resident, wartime service, need for ADL help (A&A) or homebound.

Net income < ~$1,984/month (veteran with dependent, A&A); pension offsets income.

~$155,356 (net worth limit).

High veteran demand statewide.