


Total staff
142
Employees
85
Contractors
57
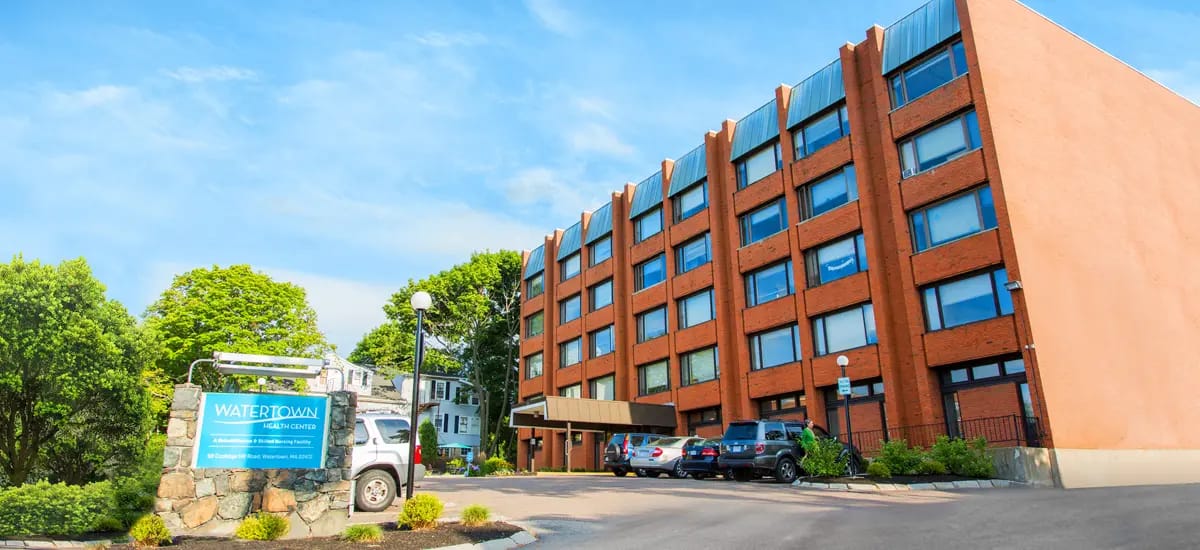
The Watertown Rehabilitation and Nursing Center stands as a 163-bed haven of skilled nursing excellence. Its strategic location places it near both Cambridge and downtown Boston, granting residents easy access to a plethora of local conveniences and recreational offerings. The establishment offers private and semi-private rooms adorned with sweeping views that enhance the living experience.
Beyond the captivating vistas, the center boasts inviting meeting spaces, splendid outdoor patios, and generously proportioned dining areas. This carefully curated environment serves as an idyllic backdrop for recovery, fostering a sense of comfort and wellness. A registered dietitian is at the helm, ensuring comprehensive and tailored nutritional support. Among the services, palliative and hospice care, pain management, short-term rehab, and long-term care are seamlessly integrated, catering to a diverse spectrum of needs. Welcoming various insurance options, including Medicare, Medicaid, private pay, UHC One Care, and more, this establishment is committed to providing top-notch care that transcends expectations.
| Staff type | Hours / Day / Resident | vs state avg |
|---|---|---|
|
Registered Nurse (RN)
| 27m per day | ▼ 31% State avg: 39m per day · National avg: 41m per day |
|
LPN / LVN
| 59m per day | ■ Avg State avg: 58m per day · National avg: 52m per day |
|
Nurse Aide
| 1h 48m per day | ▼ 21% State avg: 2h 16m per day · National avg: 2h 21m per day |
|
Weekend Total Nursing
| 3h 15m per day | ▼ 6% State avg: 3h 27m per day · National avg: 3h 26m per day |
|
Physical Therapist
| 0m per day | ▼ 100% State avg: 4m per day · National avg: 4m per day |
|
Weekend RN
| 28m per day | ■ Avg State avg: 28m per day · National avg: 29m per day |
Reporting period: October 1 – December 31, 2025 (Q4 2025). Source: CMS Payroll-Based Journal report.
Manages medical care and health needs.
Assists with medical care and medications.
Helps with daily care and mobility.
Total hours from contractors
2,555 contractor hours this quarter
| Certified Nursing Assistant | 43 | 10 | 53 | 20,941 | 89 | 97% | 8.7 |
| Licensed Practical Nurse | 19 | 16 | 35 | 11,034 | 90 | 98% | 9.9 |
| Registered Nurse | 7 | 23 | 30 | 4,694 | 92 | 100% | 10.1 |
| Dietitian | 7 | 0 | 7 | 2,794 | 88 | 96% | 7.9 |
| Nurse Practitioner | 1 | 2 | 3 | 479 | 61 | 66% | 7.1 |
| Administrator | 2 | 0 | 2 | 458 | 59 | 64% | 7.5 |
| RN Director of Nursing | 2 | 0 | 2 | 411 | 62 | 67% | 5.5 |
| Mental Health Service Worker | 2 | 0 | 2 | 255 | 34 | 37% | 7.5 |
| Occupational Therapy Aide | 0 | 3 | 3 | 196 | 27 | 29% | 6.3 |
| Occupational Therapy Assistant | 0 | 2 | 2 | 62 | 16 | 17% | 3.7 |
| Feeding Assistant | 0 | 1 | 1 | 48 | 8 | 9% | 6 |
| Medical Director | 1 | 0 | 1 | 12 | 12 | 13% | 1 |
| Clinical Nurse Specialist | 1 | 0 | 1 | 12 | 15 | 16% | 0.8 |
Includes penalties issued in 2024
Federal penalties imposed by CMS for regulatory violations, including civil money penalties (fines) and denials of payment for new Medicare/Medicaid admissions.
Source: CMS Penalties Database (Data as of Jan 2026)
Massachusetts average: $72K
Massachusetts average: 1.7
Massachusetts average: 0.1
Penalties are imposed by CMS for violations of federal nursing home regulations.
1 penalty in the past 3 years
Aug 28, 2024 · $56K
Last updated: Jan 2026
These measures show how residents usually do over time at this home, based on health outcomes and preventive care.
Massachusetts average: 10.2
Massachusetts average: 20.0
Massachusetts average: 18.7%
Massachusetts average: 19.3%
Massachusetts average: 22.1%
Massachusetts average: 3.6%
Massachusetts average: 4.7%
Massachusetts average: 2.1%
Massachusetts average: 5.2%
Massachusetts average: 10.7%
Massachusetts average: 20.3%
Massachusetts average: 91.9%
Massachusetts average: 94.8%
Massachusetts average: 1.86
Massachusetts average: 1.54
Massachusetts average: 76.7%
Massachusetts average: 1.3%
Massachusetts average: 77.7%
Massachusetts average: 25.8%
Massachusetts average: 11.8%
Massachusetts average: 0.8%
Massachusetts average: 53.7%
Massachusetts average: 50.6%
Quality measures are calculated from Minimum Data Set (MDS) assessments. For most measures, lower percentages indicate better care quality.
41% of new residents, usually for short-term rehab.
5% of new residents, often for short stays.
53% of new residents, often for long-term daily care.
Source: CMS Long-Term Care Facility Characteristics (Data as of Jan 2026)
Residents meet regularly to discuss policies, care quality, and activities
Organized group of residents that meets regularly to discuss facility policies, quality of life, and activities.
Data sourced from CMS Long-Term Care Facility Characteristics quarterly report. Payer mix reflects the current resident census by primary payment source.
Historical financial and operational data for Watertown Rehabilitation and Nursing Center from 2011–2023, based on CMS SNF Cost Reports.
Based on CMS SNF Cost Report for fiscal year ending in 12/2023.
Most residents stay for extended periods and receive ongoing daily care.
Most new residents arrive under Medicaid (53% of admissions), and a typical Medicaid stay runs around 1 - 2 years.
Coverage residents most often arrive under.
Coverage residents most often leave under.
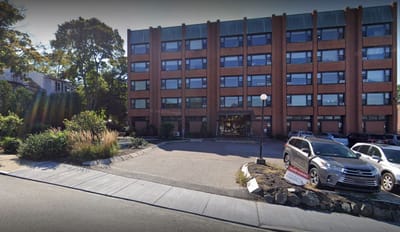
![]() 1.5 miles from city center
1.5 miles from city center
![]() Estimated distance in miles from Watertown's city center to Watertown Rehabilitation and Nursing Center's address, calculated via Google Maps.
Estimated distance in miles from Watertown's city center to Watertown Rehabilitation and Nursing Center's address, calculated via Google Maps.
Add your location
The information below is reported by the Massachusetts Executive Office of Elder Affairs and Department of Public Health.
| Spaulding Nursing and Therapy Center in Brighton | NH | Allston (Brighton) | 123
Facility
123
MA AVG
94
Rank
#55 / 280 |
61.9%
Facility
61.9%
MA AVG
82%
Rank
#83 / 96 | -24% | 8.86
Facility
8.86
MA AVG
3.93
Rank
#1 / 93 | +105% | +125% | $0
Facility
$0
MA AVG
$76.6k
Rank
#1 / 94 | 7
Facility
7
MA AVG
32.7
Rank
#5 / 93 | 2.3
Facility
2.3
MA AVG
7.2
Rank
#5 / 93 | 1 | 93 | - |
91
Facility
91
MA AVG
53
Rank
#39 / 499 | Mass General Brigham Incorporated | $32.4M
Facility
$32.4M
MA AVG
$17.4M
Rank
#4 / 96 | $22.5M
Facility
$22.5M
MA AVG
$6.5M
Rank
#4 / 96 | 69.3%
Facility
69.3%
MA AVG
43.6%
Rank
#75 / 96 | 225014 | ||||
| Neville Center at Fresh Pond | NH AL HC MC | Cambridge (Cambridge Highlands) | 112
Facility
112
MA AVG
94
Rank
#76 / 280 |
92.1%
Facility
92.1%
MA AVG
82%
Rank
#23 / 96 | +12% | 4.21
Facility
4.21
MA AVG
3.93
Rank
#24 / 93 | -12% | +7% | $0
Facility
$0
MA AVG
$76.6k
Rank
#1 / 94 | 20
Facility
20
MA AVG
32.7
Rank
#30 / 93 | 5.0
Facility
5.0
MA AVG
7.2
Rank
#31 / 93 | - | 97 | - |
63
Facility
63
MA AVG
53
Rank
#205 / 499 | Neville Communities Home Inc | $16.9M
Facility
$16.9M
MA AVG
$17.4M
Rank
#33 / 96 | $11.8M
Facility
$11.8M
MA AVG
$6.5M
Rank
#28 / 96 | 69.8%
Facility
69.8%
MA AVG
43.6%
Rank
#44 / 96 | 225378 | ||||
| Cambridge Rehabilitation & Nursing Center | NH HC PC | Cambridge (Mid-Cambridge) | 83
Facility
83
MA AVG
94
Rank
#152 / 280 |
89.3%
Facility
89.3%
MA AVG
82%
Rank
#35 / 96 | +9% | 4.07
Facility
4.07
MA AVG
3.93
Rank
#31 / 93 | +62% | +4% | $0
Facility
$0
MA AVG
$76.6k
Rank
#1 / 94 | 22
Facility
22
MA AVG
32.7
Rank
#36 / 93 | 7.3
Facility
7.3
MA AVG
7.2
Rank
#59 / 93 | - | 77 | - |
95
Facility
95
MA AVG
53
Rank
#13 / 499 | Cambridge Center Holdings LLC | $8.5M
Facility
$8.5M
MA AVG
$17.4M
Rank
#56 / 96 | $5.6M
Facility
$5.6M
MA AVG
$6.5M
Rank
#83 / 96 | 65.7%
Facility
65.7%
MA AVG
43.6%
Rank
#95 / 96 | 225520 | ||||
| Watertown Rehabilitation and Nursing Center | NH HC PC | Watertown (East Watertown) | 163
Facility
163
MA AVG
94
Rank
#20 / 280 |
66.2%
Facility
66.2%
MA AVG
82%
Rank
#78 / 96 | -19% | 2.81
Facility
2.81
MA AVG
3.93
Rank
#93 / 93 | +66% | -29% | $56.4k
Facility
$56.4k
MA AVG
$76.6k
Rank
#82 / 94 | 60
Facility
60
MA AVG
32.7
Rank
#87 / 93 | 6.7
Facility
6.7
MA AVG
7.2
Rank
#54 / 93 | 1 | 126 | - |
78
Facility
78
MA AVG
53
Rank
#133 / 499 | Watertown Rehab Holdco LLC | $11.9M
Facility
$11.9M
MA AVG
$17.4M
Rank
#52 / 96 | $6.7M
Facility
$6.7M
MA AVG
$6.5M
Rank
#67 / 96 | 56.4%
Facility
56.4%
MA AVG
43.6%
Rank
#91 / 96 | 225425 | ||||
| Sancta Maria | NH HC RC | Cambridge (Cambridge Highlands) | 141
Facility
141
MA AVG
94
Rank
#37 / 280 |
93.8%
Facility
93.8%
MA AVG
82%
Rank
#15 / 96 | +14% | 4.08
Facility
4.08
MA AVG
3.93
Rank
#31 / 93 | +14% | +4% | $0
Facility
$0
MA AVG
$76.6k
Rank
#1 / 94 | 38
Facility
38
MA AVG
32.7
Rank
#69 / 93 | 12.7
Facility
12.7
MA AVG
7.2
Rank
#88 / 93 | - | 125 | - |
68
Facility
68
MA AVG
53
Rank
#181 / 499 | Amber Dubois | $19.8M
Facility
$19.8M
MA AVG
$17.4M
Rank
#20 / 96 | $13.6M
Facility
$13.6M
MA AVG
$6.5M
Rank
#13 / 96 | 68.7%
Facility
68.7%
MA AVG
43.6%
Rank
#41 / 96 | 225573 |
Watertown Rehabilitation and Nursing Center is located in Watertown, Massachusetts.
Here are the financial assistance programs available to residents in Massachusetts.
Watertown Rehabilitation and Nursing Center is in the East Watertown neighborhood.
Watertown Rehabilitation and Nursing Center has a walk score of 78. Very walkable. Most errands can be accomplished on foot, and many essentials are within a short walk.
Watertown Rehabilitation and Nursing Center's occupancy is 66.2%.
Watertown Rehabilitation and Nursing Center is registered as a for-profit.
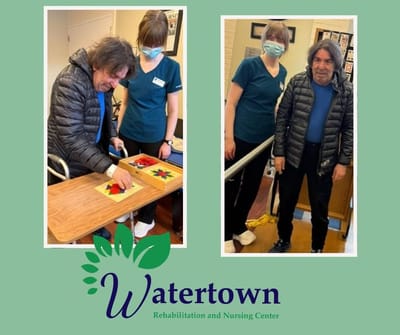
Yes — there are 3 photos of Watertown Rehabilitation and Nursing Center in the photo gallery on this page.
Watertown Rehabilitation and Nursing Center is located at 59 Coolidge Hill Rd, Watertown, MA 02472.
(617) 924-1130 will put you in contact with the team at Watertown Rehabilitation and Nursing Center.
Care Cost Calculator: See Prices in Your Area
Nursing Home Data Explorer
Don’t Wait Too Long: 7 Red Flag Signs Your Parent Needs Assisted Living Now
The True Cost of Assisted Living in 2025 – And How Families Are Paying For It
Understanding Senior Living Costs: Pricing Models, Discounts & Financial Assistance


