Occupancy rate
80%

We arrange tours, appointments, and even moving support so you don’t have to
Thank you for your interest!
Our team will be in touch shortly to help with next steps.

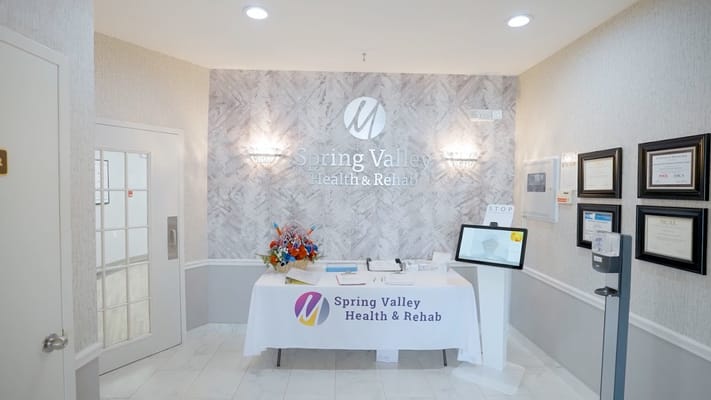
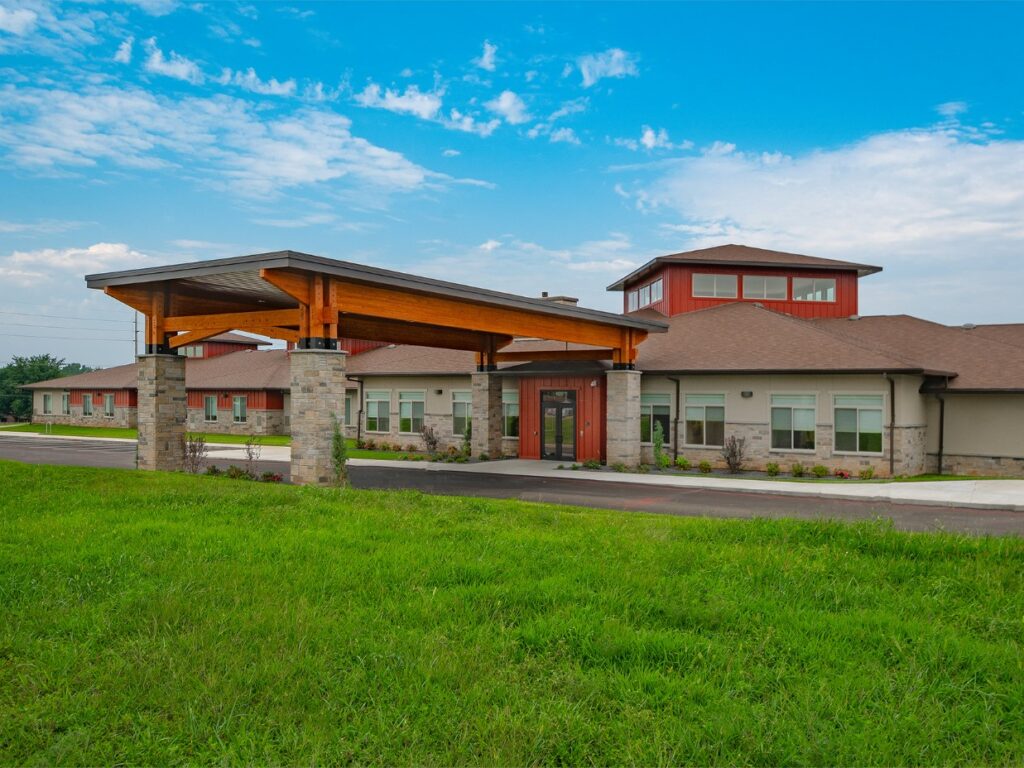
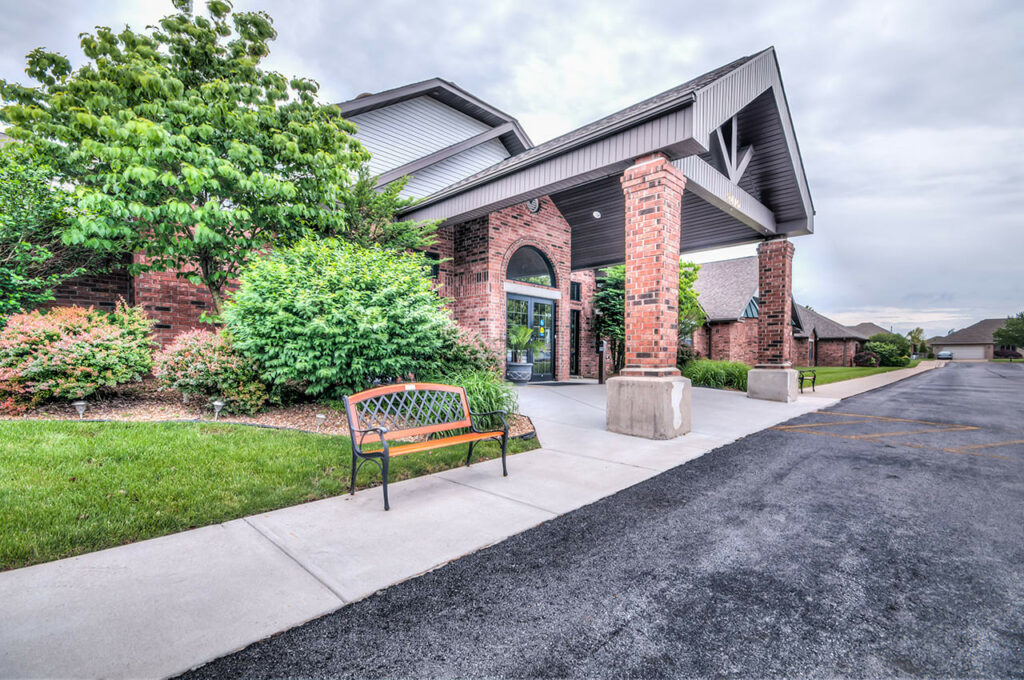
Spring Valley Health and Rehabilitation Center stands as one of the premier nursing homes with the highest ratings in Springfield. They have been awarded the ‘Best Nursing Homes’ for short-term rehabilitation and long-term care by the U.S. News and World Report. Such recognition is found in the comprehensive environment of the community that balances itself with a resort-like lifestyle offering world-class hospitality provided to each unique individual with personal needs. Spring Valley is the home where seniors thrive and are enriched by the quality skilled nursing care offered.
The health and rehabilitation center’s nursing approach is focused on comprehensive therapies that contribute to a speedy recovery. The community features include a memory care unit in the nursing home, respite care, hospice, 24-hour nursing services, an in-house emergency call, and post-hospital strengthening programs.
Offers a balance of services and community atmosphere.
Lower occupancy suggests more openings may be available.
This home supports both short-term rehab and long-term care, with residents staying for a wide range of durations.
9% of new residents, usually for short-term rehab.
53% of new residents, often for short stays.
38% of new residents, often for long-term daily care.
Spring Valley Health and Rehabilitation Center is legally operated by Mc Fremont Healthcare, Llc, and administrated by Anderson.
Ways to qualify for care at this community, including accepted programs and payment options.
This facility is certified for eligible Medicare services.
In Missouri, the Department of Health and Senior Services, Division of Regulation and Licensure performs the inspections and unannounced surveys required for all long-term care providers.
9 visits/inspections triggered by complaints
4 routine inspections
13 with issues
0 without issues
Deficiencies indicate regulatory issues. A higher number implies the facility had several areas requiring improvement.
Missouri average: 35 deficiencies
Missouri average 6.6
Last Health inspection on Aug 2025
Missouri average 36.5
Missouri average 5.67
Health citations are formal notices following inspections when they fail to comply with safety and care standards.
53 of 84 citations resulted from standard inspections; and 31 of 84 resulted from complaint investigations.
Missouri average: 0.7
Missouri average: 1
Data sourced from CMS Health Deficiencies reports. Citation severity codes range from A (least serious) to L (most serious). Immediate Jeopardy (J-L) citations indicate situations where the facility's noncompliance has placed residents at risk of death or serious harm.
Nursing Home Licensed facility providing 24/7 skilled nursing care for residents with complex, ongoing medical needs. Staffed by RNs, LPNs, and CNAs. Inspected and star-rated annually by CMS. Accepts Medicare (short-term rehab) and Medicaid (long-term care).
Nursing Home Licensed facility providing 24/7 skilled nursing care for residents with complex, ongoing medical needs. Staffed by RNs, LPNs, and CNAs. Inspected and star-rated annually by CMS. Accepts Medicare (short-term rehab) and Medicaid (long-term care).
Memory Care Secured, specialized care for people living with Alzheimer's or dementia. Staff trained in cognitive impairment, with higher staff-to-resident ratios and an environment designed to reduce confusion and wandering risk.
Nursing Home Licensed facility providing 24/7 skilled nursing care for residents with complex, ongoing medical needs. Staffed by RNs, LPNs, and CNAs. Inspected and star-rated annually by CMS. Accepts Medicare (short-term rehab) and Medicaid (long-term care).
Nursing Home Licensed facility providing 24/7 skilled nursing care for residents with complex, ongoing medical needs. Staffed by RNs, LPNs, and CNAs. Inspected and star-rated annually by CMS. Accepts Medicare (short-term rehab) and Medicaid (long-term care).
Assisted Living A licensed, long-term care setting for seniors or individuals with disabilities who need help with daily activities — like bathing, dressing, and medication management — but not 24-hour skilled nursing. Offers housing, meals, and around-the-clock support while aiming to maximize resident independence.
Independent Living Lifestyle-focused communities for older adults offering dining, activities, and transportation with minimal personal care. Best for active, independent seniors who want community without medical support.
Memory Care Secured, specialized care for people living with Alzheimer's or dementia. Staff trained in cognitive impairment, with higher staff-to-resident ratios and an environment designed to reduce confusion and wandering risk.
Nursing Home Licensed facility providing 24/7 skilled nursing care for residents with complex, ongoing medical needs. Staffed by RNs, LPNs, and CNAs. Inspected and star-rated annually by CMS. Accepts Medicare (short-term rehab) and Medicaid (long-term care).
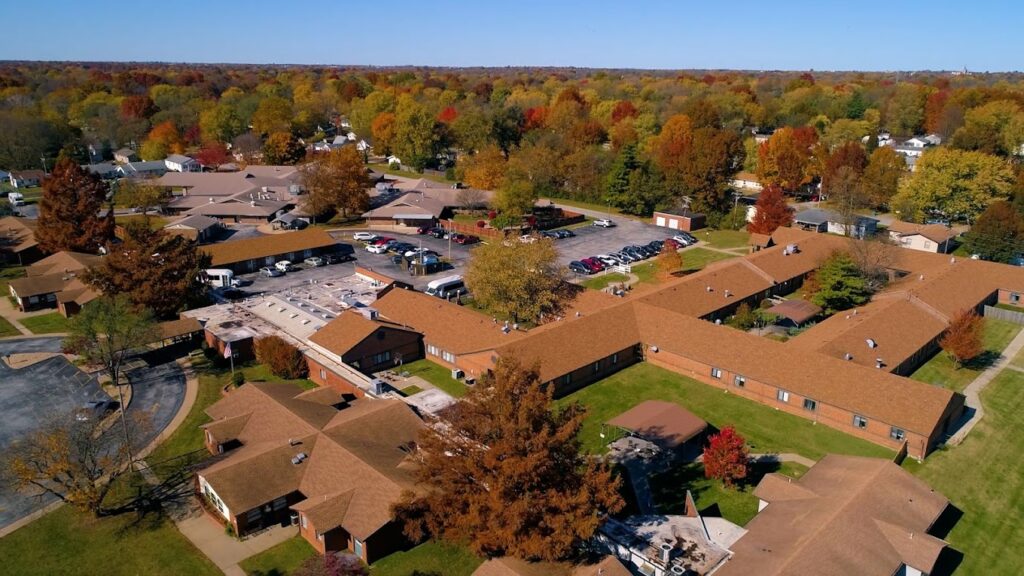
![]() 4.4 miles from city center — 1.07 miles to nearest hospital (CoxHealth Wheeler Heart and Vascular Center)
4.4 miles from city center — 1.07 miles to nearest hospital (CoxHealth Wheeler Heart and Vascular Center)
Add your location
This data corresponds to Q2 2025 and is based on CMS Payroll-Based Journal.
Missouri average ratio: 1.71:1
Missouri average: 8.1 hours
Manages medical care and health needs.
No contractors work on this role.
Assists with medical care and medications.
No contractors work on this role.
Helps with daily care and mobility.
No contractors work on this role.
Total hours from contractors
5,380 contractor hours this quarter
| Certified Nursing Assistant | 48 | 0 | 48 | 18,362 | 91 | 100% | 9.3 |
| Licensed Practical Nurse | 15 | 0 | 15 | 6,537 | 91 | 100% | 9.7 |
| Medication Aide/Technician | 14 | 0 | 14 | 5,191 | 91 | 100% | 10.9 |
| Registered Nurse | 7 | 0 | 7 | 2,751 | 91 | 100% | 9.9 |
| RN Director of Nursing | 6 | 0 | 6 | 2,569 | 79 | 87% | 8.3 |
| Physical Therapy Aide | 0 | 7 | 7 | 1,583 | 67 | 74% | 7.2 |
| Qualified Social Worker | 0 | 6 | 6 | 1,524 | 69 | 76% | 6.9 |
| Speech Language Pathologist | 0 | 7 | 7 | 1,325 | 74 | 81% | 6.8 |
| Dental Services Staff | 2 | 0 | 2 | 912 | 66 | 73% | 7.4 |
| Other Dietary Services Staff | 3 | 0 | 3 | 798 | 82 | 90% | 7.4 |
| Respiratory Therapy Technician | 0 | 3 | 3 | 594 | 69 | 76% | 6.5 |
| Administrator | 1 | 0 | 1 | 512 | 64 | 70% | 8 |
| Nurse Practitioner | 1 | 0 | 1 | 496 | 62 | 68% | 8 |
| Dietitian | 1 | 0 | 1 | 462 | 63 | 69% | 7.3 |
| Clinical Nurse Specialist | 3 | 0 | 3 | 332 | 38 | 42% | 7.4 |
| Physical Therapy Assistant | 0 | 3 | 3 | 304 | 67 | 74% | 4.5 |
| Occupational Therapy Aide | 1 | 0 | 1 | 120 | 15 | 16% | 8 |
| Medical Director | 0 | 1 | 1 | 26 | 13 | 14% | 2 |
| Occupational Therapy Assistant | 0 | 1 | 1 | 24 | 3 | 3% | 8 |
Source: CMS Long-Term Care Facility Characteristics (Data as of Jan 2026)
Residents meet regularly to discuss policies, care quality, and activities
Organized group of residents that meets regularly to discuss facility policies, quality of life, and activities.
Data sourced from CMS Long-Term Care Facility Characteristics quarterly report. Payer mix reflects the current resident census by primary payment source.
These measures show how residents usually do over time at this home, based on health outcomes and preventive care.
Missouri average: 10.9
Missouri average: 19.5
Missouri average: 19.8%
Missouri average: 20.6%
Missouri average: 18.1%
Missouri average: 4.0%
Missouri average: 5.0%
Missouri average: 2.7%
Missouri average: 5.6%
Missouri average: 12.8%
Missouri average: 22.0%
Missouri average: 85.2%
Missouri average: 90.9%
Missouri average: 2.08
Missouri average: 2.35
Missouri average: 66.6%
Missouri average: 2.2%
Missouri average: 63.5%
Missouri average: 25.3%
Missouri average: 13.4%
Missouri average: 0.8%
Missouri average: 53.7%
Missouri average: 50.6%
Quality measures are calculated from Minimum Data Set (MDS) assessments. For most measures, lower percentages indicate better care quality.
Federal penalties imposed by CMS for regulatory violations, including civil money penalties (fines) and denials of payment for new Medicare/Medicaid admissions.
Source: CMS Penalties Database (Data as of Jan 2026)
Missouri average: $73K
Missouri average: 2.4
Missouri average: 0.7
Penalties are imposed by CMS for violations of federal nursing home regulations.
Last updated: Jan 2026
Historical financial and operational data for Spring Valley Health and Rehabilitation Center based on CMS SNF Cost Reports.
Loading trend charts...
Care Cost Calculator: See Prices in Your Area
Nursing Home Data Explorer
Don’t Wait Too Long: 7 Red Flag Signs Your Parent Needs Assisted Living Now
The True Cost of Assisted Living in 2025 – And How Families Are Paying For It
Understanding Senior Living Costs: Pricing Models, Discounts & Financial Assistance

Touring a community? Use this expert-backed checklist to stay organized, ask the right questions, and find the perfect fit.
We'll send you a PDF version of the touring checklist.