St. Anthony Healthcare Center
Nursing Home · Warren, MI
CMS overall rating Info The Overall CMS Rating is scored from 1 to 5 stars and combines results from health inspections, staffing levels, and quality measures. Health inspections carry the most weight. Staffing and quality scores can increase or decrease the final rating based on performance compared to state and national standards.

St. Anthony Healthcare Center

Nursing Home · Warren, MI
CMS overall rating Info The Overall CMS Rating is scored from 1 to 5 stars and combines results from health inspections, staffing levels, and quality measures. Health inspections carry the most weight. Staffing and quality scores can increase or decrease the final rating based on performance compared to state and national standards.
Calculator: See prices in your area
St. Anthony Healthcare Center accepts Medicare and private pay.

Overview of St. Anthony Healthcare Center

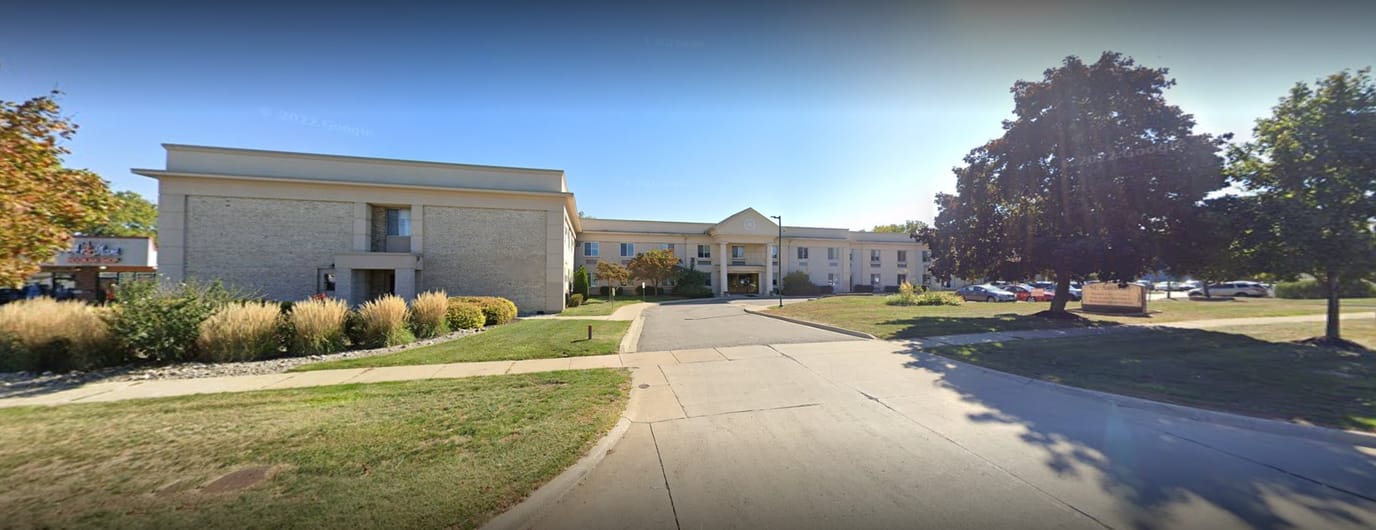
Located in the heart of Warren, MI, St. Anthony Healthcare Center is a dependable senior living community, designed to serve individuals in need of long-term care and short-term sub-acute rehabilitative services. This state of the art community features 142 well-built units designed to offer utmost comfort and convenience, while accommodating residents’ unique needs. A highly qualified, professional and compassionate care team is available to provide the most innovative care practices and focused attention to every resident.

In addition to excellent care services, the community also offers a pristine living environment and a vibrant array of activities, and programs for a more fulfilling living or recovery experience. Residents also savor healthy and delicious meals tailored to their dietary needs and preferences to ensure they truly enjoy their mealtimes. With a full range of supportive and specialized care services, convenient amenities, and a welcoming environment, residents are guaranteed to enjoy a healthy and fulfilling living experience.

(586) 977-6700

Quality ratings

Measured by Centers for Medicare & Medicaid Services (CMS)

Overall rating Info The Overall CMS Rating combines results from health inspections, staffing levels and quality measures. Health inspections carry the most weight. Staffing and quality scores can increase or decrease the final rating based on performance compared to state and national standards.
▲ 27.5% Above MI avg. ▲ 27.5% Above MI avg.Click the badge to see the full State ranking.Click here to see the full State ranking.
Health Inspection Info Based on the results of the facility's three most recent standard inspections and any complaint investigations. CMS reviews the number, scope, and severity of deficiencies, with more recent findings weighted more heavily.
▲ 6.1% Above MI avg. ▲ 6.1% Above MI avg.Click the badge to see the full State ranking.Click here to see the full State ranking.
Staffing Info Measures average nursing staff hours per resident per day, including Registered Nurses (RNs) and total nursing staff. Ratings are adjusted based on the level of care residents require and are compared to state and national benchmarks.
▼ 14.2% Below MI avg. ▼ 14.2% Below MI avg.Click the badge to see the full State ranking.Click here to see the full State ranking.
Quality Measures Info Based on clinical and physical health indicators reported to CMS, such as hospital readmissions, falls, pressure ulcers, and improvements in mobility. These measures reflect how well residents' health needs are being managed.
▲ 33.0% Above MI avg. ▲ 33.0% Above MI avg.Click the badge to see the full State ranking.Click here to see the full State ranking.

Staffing hours breakdown

Info Daily nursing hours per resident by staff type, reported to CMS. Higher is generally better — compare this facility to state and national averages to see where staffing stands.

Hours per resident per day — compared to Michigan state averages

Total nursing care / resident Info This home is ranked 75th out of 133 homes in Michigan. Total adjusted nursing hours per resident per day, combining RN, LPN, and aide time. CMS adjusts this for case-mix so facilities can be fairly compared.
3h 56m per day
Rank #75 / 133Nurse hours — State benchmarkedThis home is ranked 75th out of 133 homes in Michigan. Shows adjusted nurse hours per resident per day benchmarked to the Michigan average, with a ranking across 133 Michigan SNFs. More hours mean more direct care. The national average is about 3.5 hrs; below 3.0 is a red flag.Click the rank badge to see the full State ranking.Click here to see the full State ranking.
This facility Michigan avg (4h 18m per day)
vs Michigan avg
-8%

4 of 6 metrics below state avg

Standout metric Physical Therapist is +150% above state avg
Staff typeHours / Day / Residentvs state avg
Registered Nurse (RN) Info RNs hold the highest nursing license and can assess residents, interpret test results, and direct care plans. More RN hours per day often signals stronger clinical oversight and faster response to health changes. 28m per day ▼ 39% State avg: 46m per day · National avg: 41m per day
LPN / LVN Info Licensed Practical Nurses (LPNs) or Licensed Vocational Nurses (LVNs) deliver routine hands-on care — medication administration, wound dressing, and monitoring vital signs. They work under RN supervision and make up a large share of daily bedside care. 1h 11m per day ▲ 34% State avg: 53m per day · National avg: 52m per day
Nurse Aide Info Certified Nurse Aides (CNAs) provide the most direct day-to-day assistance: bathing, dressing, feeding, and mobility. Nurse aide hours are typically the largest staffing category and directly affect residents' quality of life. 2h 2m per day ▼ 15% State avg: 2h 23m per day · National avg: 2h 21m per day
Weekend Total Nursing Info Combined nursing hours (RN + LPN + Nurse Aide) per resident per day on weekends. Staffing often drops on weekends — this figure reveals whether the facility maintains adequate coverage outside of weekday hours. 3h 21m per day ▼ 5% State avg: 3h 31m per day · National avg: 3h 26m per day
Physical Therapist Info Hours per resident per day provided by licensed Physical Therapists (PTs) or PT Assistants. PT services help residents recover mobility after injury or illness and are especially important for post-acute (short-stay) rehabilitation. 10m per day ▲ 150% State avg: 4m per day · National avg: 4m per day
Weekend RN Info Registered nurse hours specifically on weekends. Facilities sometimes reduce RN presence on Saturdays and Sundays — a low weekend RN figure compared to weekday hours can indicate reduced clinical oversight when most administrative staff are absent. 15m per day ▼ 48% State avg: 29m per day · National avg: 29m per day

Capacity and availability

This home usually has limited availability

Occupancy between 85% and 95% suggests balanced demand.

Higher occupancy than the Michigan average: 75.8%
Occupancy rate 91.8% Rank #21 / 386Occupancy rate — State benchmarkedThis home is ranked 21st out of 386 homes in Michigan. Shows this facility's occupancy rate versus the Michigan average, with its Statewide rank out of 386. Higher occupancy signals strong local demand and financial stability.Click the rank badge to see the full State ranking.Click here to see the full State ranking.
Avg. Length of Stay 93 days
Occupancy rate
91.8% Rank #21 / 386Occupancy rate — State benchmarkedThis home is ranked 21st out of 386 homes in Michigan. Shows this facility's occupancy rate versus the Michigan average, with its Statewide rank out of 386. Higher occupancy signals strong local demand and financial stability.Click the rank badge to see the full State ranking.Click here to see the full State ranking.
Avg. Length of Stay
93 days
Walk Score
Walk Score: 61 / 100 Rank #125 / 702Walk Score — State benchmarkedThis home is ranked 125th out of 702 homes in Michigan. Shows how walkable this facility's neighborhood is compared to the average Walk Score across Michigan SNFs. Higher scores benefit residents, families, and staff.Click the rank badge to see the full State ranking.Click here to see the full State ranking.
Moderately walkable. Some errands can be accomplished on foot, with a mix of nearby amenities.

Contact St. Anthony Healthcare Center

Staffing Data

Reporting period: October 1 – December 31, 2025 (Q4 2025). Source: CMS Payroll-Based Journal report.

Total staff 173
Employees 147
Contractors 26
Staff to resident ratio 1.38:1
19% worse than Michigan average
Michigan average ratio: 1.70:1 Michigan average ratio: 1.70:1See full Michigan ranking
Avg staff/day 82
Average shift 7.6 hours
0% compared with Michigan average
Michigan average: 7.9 hours Michigan average shift: 7.9 hoursSee full Michigan ranking
Total staff hours (quarter) 57,115

Nursing staff breakdown

Q4 2025 · Oct 1 – Dec 31 More info This data comes from the CMS Payroll-Based Journal report covering October 1 – December 31, 2025.
Registered Nurse

Manages medical care and health needs.

RN Staff 8
Average shift length Info Average shift length. Calculated as total hours divided by days worked and average staff per day. 8.2 hours

No contractors work on this role.

Licensed Practical Nurse

Assists with medical care and medications.

LPN Staff 37
Average shift length Info Average shift length. Calculated as total hours divided by days worked and average staff per day. 7.9 hours

No contractors work on this role.

Certified Nursing Assistant

Helps with daily care and mobility.

CNA Staff 74
Average shift length Info Average shift length. Calculated as total hours divided by days worked and average staff per day. 7.4 hours

No contractors work on this role.

Contractor staffing

Q4 2025 · Oct 1 – Dec 31 More info This data comes from the CMS Payroll-Based Journal report covering October 1 – December 31, 2025.

Total hours from contractors

12.4%

7,060 contractor hours this quarter

Respiratory Therapy Technician: 7 Speech Language Pathologist: 6 Physical Therapy Assistant: 4 Physical Therapy Aide: 4 Qualified Social Worker: 2 Clinical Nurse Specialist: 1 Occupational Therapy Assistant: 1 Medical Director: 1

Staff by category

Q4 2025 · Oct 1 – Dec 31 More info This data comes from the CMS Payroll-Based Journal report covering October 1 – December 31, 2025.
Certified Nursing Assistant7407425,08592100%7.4
Licensed Practical Nurse3703712,58492100%7.9
Registered Nurse8082,92992100%8.2
Respiratory Therapy Technician0772,3179199%7.9
Clinical Nurse Specialist5162,2418693%8.5
Other Dietary Services Staff8082,12392100%7.2
Speech Language Pathologist0661,8828491%7.8
RN Director of Nursing5051,5897986%7.8
Physical Therapy Aide0441,4758289%7.2
Physical Therapy Assistant0449478390%6.6
Dental Services Staff2028786672%7.8
Occupational Therapy Aide3038166368%7.8
Mental Health Service Worker1015126470%8
Nurse Practitioner2024946166%8.1
Administrator1014886166%8
Dietitian1013284145%8
Qualified Social Worker0223175358%6
Occupational Therapy Assistant011785762%1.4
Medical Director0113389%4.1
74 Certified Nursing Assistant
% of Days 100%
37 Licensed Practical Nurse
% of Days 100%
8 Registered Nurse
% of Days 100%
7 Respiratory Therapy Technician
% of Days 99%
6 Clinical Nurse Specialist
% of Days 93%
8 Other Dietary Services Staff
% of Days 100%
6 Speech Language Pathologist
% of Days 91%
5 RN Director of Nursing
% of Days 86%
4 Physical Therapy Aide
% of Days 89%
4 Physical Therapy Assistant
% of Days 90%
2 Dental Services Staff
% of Days 72%
3 Occupational Therapy Aide
% of Days 68%
1 Mental Health Service Worker
% of Days 70%
2 Nurse Practitioner
% of Days 66%
1 Administrator
% of Days 66%
1 Dietitian
% of Days 45%
2 Qualified Social Worker
% of Days 58%
1 Occupational Therapy Assistant
% of Days 62%
1 Medical Director
% of Days 9%

Penalties and fines

Federal penalties imposed by CMS for regulatory violations, including civil money penalties (fines) and denials of payment for new Medicare/Medicaid admissions.

Source: CMS Penalties Database (Data as of Jan 2026)

Total fines amount $8K Rank #73 / 136Federal fines — State benchmarkedThis home is ranked 73rd out of 136 homes in Michigan. Shows this facility's cumulative CMS federal fine dollars versus the Michigan average among facilities with fines, and where it ranks among 136 skilled nursing facilities in the pool. Lower total dollars mean a better rank.Click the rank badge to see the full State ranking.Click here to see the full State ranking.
89% lower than Michigan average

Michigan average: $76K

Number of fines 1
51% fewer fines than Michigan average

Michigan average: 2.0

Payment Denials Info Serious action where Medicare and/or Medicaid temporarily stops payments for new residents until issues are fixed. 0
100% fewer payment denials than Michigan average

Michigan average: 0.8

Fines amount comparison
This facility $8K
Michigan average $76K

No penalties in the past 3 years

No civil money penalties or payment denials were reported in the last 3 years.

Quality of care over time

These measures show how residents usually do over time at this home, based on health outcomes and preventive care.

High-risk clinical events score Info A composite score based on pressure ulcers, falls with injury, weight loss, walking ability decline, and activities of daily living decline. 3.4
59% better than Michigan average

Michigan average: 8.4

Functional decline score Info A composite score based on activities of daily living decline, walking ability decline, and incontinence. 3.3
80% better than Michigan average

Michigan average: 16.3

Long-stay resident measures
Significantly above average Michigan avg: 4.1 Info CMS star rating based on long-stay quality measure performance. 5 stars = significantly above average, 1 star = significantly below average.
Need for Help with Daily Activities Increased Info Percent of long-stay residents whose need for help with daily activities has increased 3.0%
76% better than Michigan average

Michigan average: 12.5%

Walking Ability Worsened Info Percent of long-stay residents whose ability to move independently worsened 3.0%
80% better than Michigan average

Michigan average: 15.3%

Low Risk Residents with Bowel/Bladder Incontinence Info Percent of low risk long-stay residents who lose control of their bowels or bladder 3.8%
82% better than Michigan average

Michigan average: 21.0%

Falls with Major Injury Info Percent of long-stay residents experiencing one or more falls with major injury 0.0%
100% better than Michigan average

Michigan average: 3.2%

High Risk Residents with Pressure Ulcers Info Percent of long-stay high risk residents with pressure ulcers 7.4%
29% worse than Michigan average

Michigan average: 5.7%

Urinary Tract Infection Info Percent of long-stay residents with a urinary tract infection 0.0%
100% better than Michigan average

Michigan average: 1.7%

Lost Too Much Weight Info Percent of long-stay residents who lose too much weight 3.7%
36% better than Michigan average

Michigan average: 5.7%

Depressive Symptoms Info Percent of long-stay residents who have depressive symptoms 5.8%
50% worse than Michigan average

Michigan average: 3.9%

Antipsychotic Use Info Percent of long-stay residents who received an antipsychotic medication 9.3%
38% better than Michigan average

Michigan average: 15.0%

Pneumococcal Vaccine Info Percent of long-stay residents assessed and appropriately given the pneumococcal vaccine 100.0%
5% better than Michigan average

Michigan average: 94.9%

Influenza Vaccine Info Percent of long-stay residents assessed and appropriately given the seasonal influenza vaccine 92.6%
In line with Michigan average

Michigan average: 95.0%

Hospitalizations per 1,000 days Info Number of hospitalizations per 1,000 long-stay resident days. 1.43
18% better than Michigan average

Michigan average: 1.74

ED visits per 1,000 days Info Number of outpatient emergency department visits per 1,000 long-stay resident days. 0.88
43% better than Michigan average

Michigan average: 1.54

Short-stay resident measures
Significantly above average Michigan avg: 3.3 Info CMS star rating based on short-stay quality measure performance. 5 stars = much above average, 1 star = much below average.
Pneumococcal Vaccine Info Percent of short-stay residents assessed and appropriately given the pneumococcal vaccine 95.3%
15% better than Michigan average

Michigan average: 82.5%

Antipsychotic medication increase Info Percent of short-stay residents who newly received an antipsychotic medication 1.3%
8% better than Michigan average

Michigan average: 1.4%

Influenza Vaccine Info Percent of short-stay residents assessed and appropriately given the seasonal influenza vaccine 81.6%
In line with Michigan average

Michigan average: 79.5%

Re-hospitalized after SNF stay Info Percentage of short-stay residents who were re-hospitalized after their nursing home admission. 31.0%
28% worse than Michigan average

Michigan average: 24.2%

Emergency department visits Info Percentage of short-stay residents who had an outpatient emergency department visit. 5.5%
52% better than Michigan average

Michigan average: 11.5%

Falls with major injury Info Percentage of SNF residents who experience falls with major injury during their stay. 0.0%
100% better than Michigan average

Michigan average: 0.8%

Ability to care for self at discharge Info Percentage of residents at or above expected ability to care for themselves at discharge. 80.0%
49% better than Michigan average

Michigan average: 53.7%

Successful return to home or community Info Rate of successful return to home or community from a skilled nursing facility. 53.8%
6% better than Michigan average

Michigan average: 50.6%

Breakdown by payment type

Medicare

20% of new residents, usually for short-term rehab.

Typical stay 1 - 2 months

Private pay

80% of new residents, often for short stays.

Typical stay 3 - 4 months

Facility Characteristics

Source: CMS Long-Term Care Facility Characteristics (Data as of Jan 2026)

Total residents 125
Medicare
8
6.4% of residents
Medicaid
87
69.6% of residents
Private pay or other
30
24% of residents
Programs & Services
Residents Group

Residents meet regularly to discuss policies, care quality, and activities

Active Resident Council

Organized group of residents that meets regularly to discuss facility policies, quality of life, and activities.

Finances and operations

Privately-owned community
Operated by a business corporation.
Home revenue
$34.6M
Profit
$190.1K
Privately-owned community Operated by a business corporation.
Home revenue
$34.6M Rank #9 / 134Revenue — State benchmarkedThis home is ranked 9th out of 134 homes in Michigan. Shows this facility's annual revenue compared to the Michigan SNF average. Higher revenue generally means more resources for staffing and capital — read alongside Payroll %.Click the rank badge to see the full State ranking.Click here to see the full State ranking.
Profit
$190.1K
Payroll costs Info The portion of the home's budget spent on staff, including nurses, caregivers, and other employees who support care and operations. Rank #23 / 134Payroll — State benchmarkedThis home is ranked 23rd out of 134 homes in Michigan. Shows total annual staff payroll benchmarked to the Michigan average. Higher payroll investment relative to peers often signals better staffing and less reliance on cheaper contract labor.Click the rank badge to see the full State ranking.Click here to see the full State ranking.
$11.4M
32.8% of revenue Rank #116 / 134Payroll % — State benchmarkedThis home is ranked 116th out of 134 homes in Michigan. Shows payroll as a percentage of revenue versus the Michigan average. Well-run Michigan SNFs typically land around 49–59% — the top third Statewide. Below 25% may signal understaffing or heavy agency use — read with Staffing ratings.Click the rank badge to see the full State ranking.Click here to see the full State ranking.
Other operating costs Info All remaining costs needed to run the home, such as food, utilities, building maintenance, supplies and administrative expenses.
$23.1M
Total costs $34.4M

What does this home offer?

Total residents icon

Total Residents: 142

Building type icon
Building type icon

Building Type: Two-story

Who this home usually serves

TYPE OF STAY

Primarily short stays

Residents typically stay for brief periods, with frequent admissions and discharges throughout the year.

Places of interest near St. Anthony Healthcare Center

Address 3.4 miles from city center Info Estimated distance in miles from Warren's city center to St. Anthony Healthcare Center's address, calculated via Google Maps. — 6.44 miles to nearest hospital (Corewell Health Beaumont Troy Hospital)

Calculate Travel Distance to St. Anthony Healthcare Center

Add your location

Address

Financial Assistance for
Nursing Home in Michigan

St. Anthony Healthcare Center is located in Warren, Michigan.
Here are the financial assistance programs available to residents in Michigan.

Get Financial aid guidance

MI Choice Waiver

Michigan Medicaid MI Choice Waiver

Age 65+ or disabled
General Michigan resident, Medicaid- eligible, nursing home-level care need.
Income Limits (2025) ~$2,829/month 300% FBR, individual
Asset Limits $2,000 (individual), $3,000 (couple).
MI

Delivered through regional waiver agents; waitlists possible.

Benefits
Personal care (5-7 hours/day) Respite care (240 hours/year) Home modifications ($1,500 avg.) Adult day care ($65/day)

Home Help Program

Michigan Home Help

Age 65+ or disabled
General Michigan resident, Medicaid- eligible or low-income.
Income Limits ~$1,732/month individual, Medicaid threshold
Asset Limits $2,000 individual
MI

Can hire family caregivers; less intensive than waiver.

Benefits
Personal care (up to 60 hours/month) Homemaker services Respite (varies)

Program of All-Inclusive Care for the Elderly (PACE)

Michigan PACE

Age 55+
General Michigan resident, nursing home-level care need, safe with PACE support.
Income Limits (2025) ~$2,829/month (Medicaid-eligible); private pay option available.
Asset Limits $2,000 (individual), $3,000 (couple).
MI

16 PACE centers (e.g., Ingham, Wayne counties); expanding slowly.

Benefits
Personal care (5-7 hours/day) Medical care Meals Transportation Therapy Respite

Medicare Savings Program (MSP)

Michigan Medicare Savings Program

Age 65+ or disabled
General Michigan resident, Medicare Part A/B.
Income Limits (2025) ~$2,510/month (QMB), ~$3,380/month (SLMB), ~$3,598/month (QI)—individual.
Asset Limits $9,430 (individual), $14,130 (couple).
MI

Three tiers; no waitlist; includes Extra Help for Part D.

Benefits
Covers Part B premiums ($174.70/month) Deductibles ($240/year) Copays (~20%)

National Family Caregiver Support Program (NFCSP) Respite

Michigan NFCSP Respite Care

Age
General Caregivers of 60+ needing care or 55+ caregivers of others; Michigan resident; functional needs (2+ ADLs).
Income Limits (2025) Prioritizes ~$24,980/year (individual); no strict cap.
Asset Limits Not assessed; need-based.
MI

16 AAAs; prioritizes low-income, rural caregivers.

Benefits
Respite (4-6 hours/week or 5 days/year) Adult day care ($60/day) Caregiver training

VA Aid and Attendance (A&A) and Housebound Benefits

Michigan VA Aid and Attendance/Housebound

Age 65+ or disabled veteran/spouse
General Michigan resident, wartime service, need for ADL help (A&A) or homebound.
Income Limits (2025) Net income < ~$1,984/month (veteran with dependent, A&A); pension offsets income.
Asset Limits ~$155,356 net worth limit
MI

High veteran demand in urban/rural areas.

Benefits
Cash (~$1,433-$2,642/month veteran, ~$951-$1,318 spouse) for care costs

Compare Nursing Home around Warren

The information below is reported by the Michigan Department of Licensing and Regulatory Affairs (LARA).

4 facilities compared · CMS & MI Dept. of Health data

Filter by care type
Windemere Park of Warren
NH

Nursing Home Licensed facility providing 24/7 skilled nursing care for residents with complex, ongoing medical needs. Staffed by RNs, LPNs, and CNAs. Inspected and star-rated annually by CMS. Accepts Medicare (short-term rehab) and Medicaid (long-term care).

AL

Assisted Living A licensed, long-term care setting for seniors or individuals with disabilities who need help with daily activities — like bathing, dressing, and medication management — but not 24-hour skilled nursing. Offers housing, meals, and around-the-clock support while aiming to maximize resident independence.

Warren278 48.9% -35%4.30 -40%0%$0224.4-51A+ 48 Windemere Group LLC$12.6M$4.7M37.2%235714
St. Anthony Healthcare Center
NH

Nursing Home Licensed facility providing 24/7 skilled nursing care for residents with complex, ongoing medical needs. Staffed by RNs, LPNs, and CNAs. Inspected and star-rated annually by CMS. Accepts Medicare (short-term rehab) and Medicaid (long-term care).

AL

Assisted Living A licensed, long-term care setting for seniors or individuals with disabilities who need help with daily activities — like bathing, dressing, and medication management — but not 24-hour skilled nursing. Offers housing, meals, and around-the-clock support while aiming to maximize resident independence.

MC

Memory Care Secured, specialized care for people living with Alzheimer's or dementia. Staff trained in cognitive impairment, with higher staff-to-resident ratios and an environment designed to reduce confusion and wandering risk.

Warren142 91.8% +21%3.94 -55%-8%$8.2k183.02131- 61 Erin Ledington$34.6M$11.4M32.8%235408
Villa at City Center
NH

Nursing Home Licensed facility providing 24/7 skilled nursing care for residents with complex, ongoing medical needs. Staffed by RNs, LPNs, and CNAs. Inspected and star-rated annually by CMS. Accepts Medicare (short-term rehab) and Medicaid (long-term care).

AL

Assisted Living A licensed, long-term care setting for seniors or individuals with disabilities who need help with daily activities — like bathing, dressing, and medication management — but not 24-hour skilled nursing. Offers housing, meals, and around-the-clock support while aiming to maximize resident independence.

Warren152 90.6% +20%3.77 -53%-12%$59.2k455.64139- 59 -$23.5M$7.6M32.5%235325
The Orchards Michigan – Warren
NH

Nursing Home Licensed facility providing 24/7 skilled nursing care for residents with complex, ongoing medical needs. Staffed by RNs, LPNs, and CNAs. Inspected and star-rated annually by CMS. Accepts Medicare (short-term rehab) and Medicaid (long-term care).

AL

Assisted Living A licensed, long-term care setting for seniors or individuals with disabilities who need help with daily activities — like bathing, dressing, and medication management — but not 24-hour skilled nursing. Offers housing, meals, and around-the-clock support while aiming to maximize resident independence.

Warren134 89.5% +18%3.78 -48%-12%$21.3k365.13120- 49 Warren Snf Holdco LLC$15.0M$6.6M44%235509

Frequently Asked Questions about St. Anthony Healthcare Center

Is St. Anthony Healthcare Center in a walkable area?

St. Anthony Healthcare Center has a walk score of 61. Moderately walkable. Some errands can be accomplished on foot, with a mix of nearby amenities.

What is the address of St. Anthony Healthcare Center?

St. Anthony Healthcare Center is located at 31830 Ryan Rd, Warren, MI 48092, United States.

What is the phone number of St. Anthony Healthcare Center?

(586) 977-6700 will put you in contact with the team at St. Anthony Healthcare Center.

Is St. Anthony Healthcare Center Medicare or Medicaid certified?

Yes — St. Anthony Healthcare Center is a CMS-certified provider of Medicare and Medicaid.

Guides for Better Senior Living

Care Cost Calculator: See Prices in Your Area

Nursing Home Data Explorer

Don’t Wait Too Long: 7 Red Flag Signs Your Parent Needs Assisted Living Now

The True Cost of Assisted Living in 2025 – And How Families Are Paying For It

Understanding Senior Living Costs: Pricing Models, Discounts & Financial Assistance

Explore Open Rooms
1 Contact details
2 What type of senior care service are you looking for?
3 What budget do you have in mind for senior care?
4 How soon do you need to find care?
5 Additional details

Thank you for your interest!

Our team will be in touch shortly to help with next steps.