Windemere Park of Warren
Nursing Home · Warren, MI
CMS overall rating Info The Overall CMS Rating is scored from 1 to 5 stars and combines results from health inspections, staffing levels, and quality measures. Health inspections carry the most weight. Staffing and quality scores can increase or decrease the final rating based on performance compared to state and national standards.

Windemere Park of Warren

Nursing Home · Warren, MI
CMS overall rating Info The Overall CMS Rating is scored from 1 to 5 stars and combines results from health inspections, staffing levels, and quality measures. Health inspections carry the most weight. Staffing and quality scores can increase or decrease the final rating based on performance compared to state and national standards.
Calculator: See prices in your area
Windemere Park of Warren accepts Medicare, Medicaid, and private pay.

Overview of Windemere Park of Warren

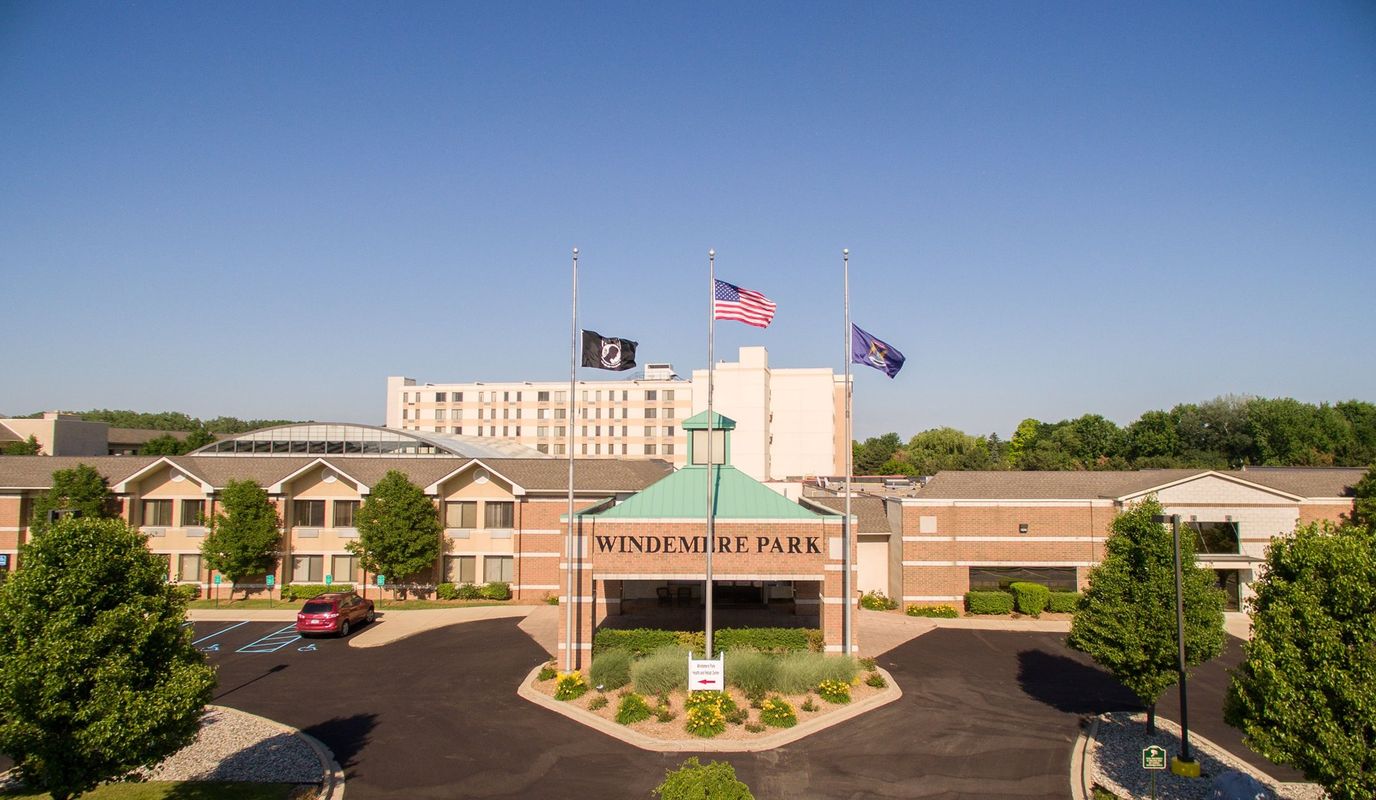
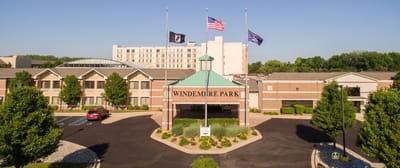
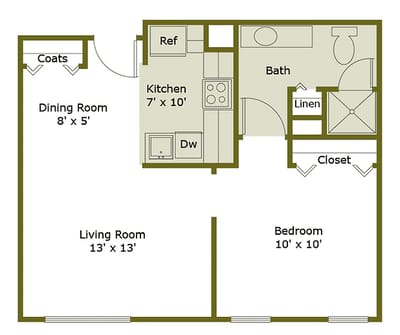
Windemere Park of Warren is a haven that goes above and beyond to provide security, tranquility, and an exceptional senior living experience. This lush and serene community sets the bar high when it comes to meeting and exceeding expectations. The home offers a comprehensive range of services, including independent living, assisted living, memory care, skilled nursing rehabilitation, respite care, and hospice care. Regardless of the unique needs of residents, the community is professionally equipped to provide tailored and personalized care.
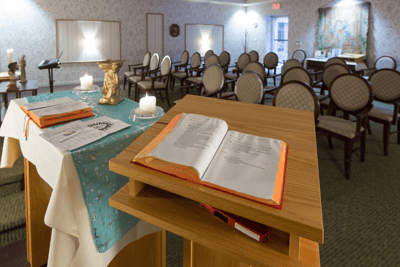
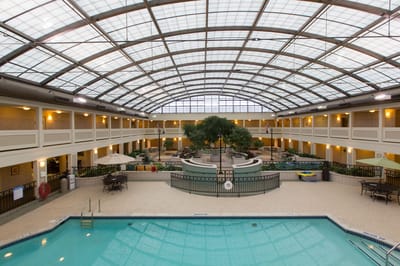
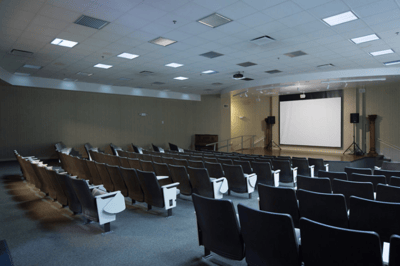
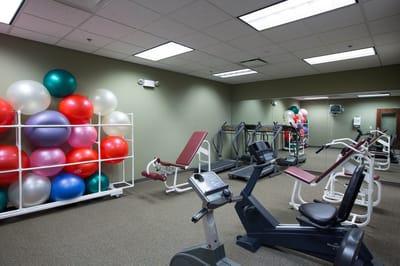
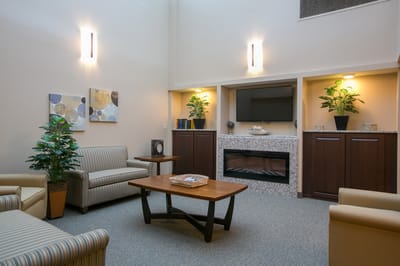
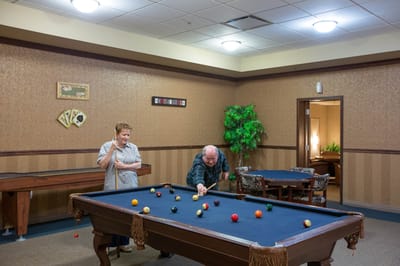
The beautifully landscaped courtyard serves as a picturesque oasis, inviting residents to unwind and enjoy the natural surroundings. In addition to the exceptional care, Windemere Park of Warren boasts a variety of amenities that cater to residents’ diverse interests. From the chapel for spiritual solace to the game room for entertainment, and the library for intellectual stimulation, every aspect of residents’ well-being is considered. Convenient transportation services ensure easy access to nearby attractions and events. Furthermore, the on-site medical center is a testament to the community’s commitment to providing comprehensive care and peace of mind for residents.

Quality ratings

Measured by Centers for Medicare & Medicaid Services (CMS)

Overall rating Info The Overall CMS Rating combines results from health inspections, staffing levels and quality measures. Health inspections carry the most weight. Staffing and quality scores can increase or decrease the final rating based on performance compared to state and national standards.
▲ 12.7% Above MI avg. ▲ 12.7% Above MI avg.Click the badge to see the full State ranking.Click here to see the full State ranking.
Health Inspection Info Based on the results of the facility's three most recent standard inspections and any complaint investigations. CMS reviews the number, scope, and severity of deficiencies, with more recent findings weighted more heavily.
▲ 20.1% Above MI avg. ▲ 20.1% Above MI avg.Click the badge to see the full State ranking.Click here to see the full State ranking.
Staffing Info Measures average nursing staff hours per resident per day, including Registered Nurses (RNs) and total nursing staff. Ratings are adjusted based on the level of care residents require and are compared to state and national benchmarks.
▼ 40.5% Below MI avg. ▼ 40.5% Below MI avg.Click the badge to see the full State ranking.Click here to see the full State ranking.
Quality Measures Info Based on clinical and physical health indicators reported to CMS, such as hospital readmissions, falls, pressure ulcers, and improvements in mobility. These measures reflect how well residents' health needs are being managed.
▲ 5.0% Above MI avg. ▲ 5.0% Above MI avg.Click the badge to see the full State ranking.Click here to see the full State ranking.

Staffing hours breakdown

Info Daily nursing hours per resident by staff type, reported to CMS. Higher is generally better — compare this facility to state and national averages to see where staffing stands.

Hours per resident per day — compared to Michigan state averages

Total nursing care / resident Info This home is ranked 44th out of 133 homes in Michigan. Total adjusted nursing hours per resident per day, combining RN, LPN, and aide time. CMS adjusts this for case-mix so facilities can be fairly compared.
4h 18m per day
Rank #44 / 133Nurse hours — State benchmarkedThis home is ranked 44th out of 133 homes in Michigan. Shows adjusted nurse hours per resident per day benchmarked to the Michigan average, with a ranking across 133 Michigan SNFs. More hours mean more direct care. The national average is about 3.5 hrs; below 3.0 is a red flag.Click the rank badge to see the full State ranking.Click here to see the full State ranking.
This facility Michigan avg (4h 15m per day)
vs Michigan avg
+1%

4 of 6 metrics below state avg

Standout metric LPN / LVN is +58% above state avg
Staff type Hours / Day / Resident vs state avg
Registered Nurse (RN) Info RNs hold the highest nursing license and can assess residents, interpret test results, and direct care plans. More RN hours per day often signals stronger clinical oversight and faster response to health changes. 32m per day ▼ 30% State avg: 46m per day · National avg: 41m per day
LPN / LVN Info Licensed Practical Nurses (LPNs) or Licensed Vocational Nurses (LVNs) deliver routine hands-on care — medication administration, wound dressing, and monitoring vital signs. They work under RN supervision and make up a large share of daily bedside care. 1h 24m per day ▲ 58% State avg: 53m per day · National avg: 52m per day
Nurse Aide Info Certified Nurse Aides (CNAs) provide the most direct day-to-day assistance: bathing, dressing, feeding, and mobility. Nurse aide hours are typically the largest staffing category and directly affect residents' quality of life. 2h 3m per day ▼ 14% State avg: 2h 23m per day · National avg: 2h 21m per day
Weekend Total Nursing Info Combined nursing hours (RN + LPN + Nurse Aide) per resident per day on weekends. Staffing often drops on weekends — this figure reveals whether the facility maintains adequate coverage outside of weekday hours. 3h 52m per day ▲ 10% State avg: 3h 31m per day · National avg: 3h 26m per day
Physical Therapist Info Hours per resident per day provided by licensed Physical Therapists (PTs) or PT Assistants. PT services help residents recover mobility after injury or illness and are especially important for post-acute (short-stay) rehabilitation. 1m per day ▼ 75% State avg: 4m per day · National avg: 4m per day
Weekend RN Info Registered nurse hours specifically on weekends. Facilities sometimes reduce RN presence on Saturdays and Sundays — a low weekend RN figure compared to weekday hours can indicate reduced clinical oversight when most administrative staff are absent. 18m per day ▼ 38% State avg: 29m per day · National avg: 29m per day

Capacity and availability

This home usually has availability

Occupancy lower than 85% suggests more openings may be available.

Lower occupancy than the Michigan average: 75.8%
Occupancy rate 17.6% Rank #359 / 386Occupancy rate — State benchmarkedThis home is ranked 359th out of 386 homes in Michigan. Shows this facility's occupancy rate versus the Michigan average, with its Statewide rank out of 386. Higher occupancy signals strong local demand and financial stability.Click the rank badge to see the full State ranking.Click here to see the full State ranking.
Avg. Length of Stay 83 days
Occupancy rate
17.6% Rank #359 / 386Occupancy rate — State benchmarkedThis home is ranked 359th out of 386 homes in Michigan. Shows this facility's occupancy rate versus the Michigan average, with its Statewide rank out of 386. Higher occupancy signals strong local demand and financial stability.Click the rank badge to see the full State ranking.Click here to see the full State ranking.
Avg. Length of Stay
83 days
Years in operation
22 years in operation Rank #91 / 302Years in operation — State benchmarkedThis home is ranked 91st out of 302 homes in Michigan. Shows how long this facility has been in operation compared to other Michigan SNFs. Longer operating histories may benefit residents, families, and staff.Click the rank badge to see the full State ranking.Click here to see the full State ranking.
A longer operating history, which may indicate experience navigating regulations and delivering ongoing care.
Walk Score
Walk Score: 48 / 100 Rank #232 / 702Walk Score — State benchmarkedThis home is ranked 232nd out of 702 homes in Michigan. Shows how walkable this facility's neighborhood is compared to the average Walk Score across Michigan SNFs. Higher scores benefit residents, families, and staff.Click the rank badge to see the full State ranking.Click here to see the full State ranking.
Somewhat walkable. A few nearby services may be reachable on foot, but most trips require transportation.
BBB Rating
BBB Rating: A+ (Not Accredited)
An independent rating from the Better Business Bureau based on factors such as complaint history, transparency, and business practices.
How BBB ratings work

About this community

Safety & Compliance

Wheelchair Accessible
Emergency SystemsEmergency Call Pendant

Therapy & Rehabilitation

2 services
Rehabilitation Services
Respite Care

Staffing & Medical

1 service
24-Hour Staffing

Amenities & Lifestyle

Indoor Heated Pool
Atrium Area With Tropical Plants
Koi Pond In Atrium
Library/Computer Room
Full-Size Theatre
Convenience Store
Java Joe's Café
Puzzle Room
Game Room
Beauty And Barber Shop
Physical Fitness Gym
Exercise Room
Tuscany Restaurant
Chapel
Private Dining Rooms
Activity Room
Family/Tv Room
Outside Courtyard With Gazebo
On-Site Home Care
Daily Pharmacy Deliveries
Schedule Transportation
Specific ProgramsEnhanced Independent Living, Physical/Occupational Rehabilitation, Therapeutic Recreational Services, Outpatient Therapy, Respite Stay, Warren Urgent Care (on-site), Harmony Transport (on-site), Home Well Care Services Available

Dining & Nutrition

Food DescriptionMeals are served in a dining room; special diets accommodated; 24-hour snack service available.

Contact Windemere Park of Warren

Inspection History

In Michigan, the Department of Licensing and Regulatory Affairs (LARA) conducts unannounced inspections and investigations to ensure long-term care facilities comply with state health codes.

Since 2023 · 3 years of data 28 deficiencies

Inspection Scorecard Info This scorecard compares key inspection, citation, and complaint metrics at this facility against the Michigan state average. Metrics rated ≥15% worse than average are highlighted in red; those ≥15% better are highlighted in green.

Since 2023 vs. Michigan state average
Overall vs. MI average 2 Worse Metrics worse than Michigan average:
• Total deficiencies (250% above)
• Deficiencies per year (244% above)
0 Better No metrics in this bucket.
Latest Inspection April 30, 2025 Annual Inspection

Deficiencies Info Deficiencies are formal regulatory issues recorded during state inspections.

This Facility MI Average vs. MI Avg
Total deficiencies Info Formal regulatory issues recorded by inspectors across all inspection types. 28 8 This facility has 250% more total deficiencies than a typical Michigan nursing home (28 vs. MI avg 8).↑ 250% worse
Deficiencies per year Info Average deficiencies per year since 2023. 9.3 2.7 This facility has 244% more deficiencies per year than a typical Michigan nursing home (9.3 vs. MI avg 2.7).↑ 244% worse

Inspection Reports Summary Info An editor-reviewed summary of the themes and findings across this facility's recent inspection reports.

The most recent inspection on April 30, 2025, found deficiencies related to therapeutic diet compliance, food storage safety, and call light accessibility. Earlier inspections showed a pattern of issues including medication management, infection control, physical plant maintenance, and food service sanitation. Complaint investigations substantiated failures in scheduling required medical follow-up and controlling narcotic medication misuse, resulting in the suspension of the Director of Nursing. Enforcement actions such as fines or license suspensions were not listed in the available reports. The facility’s inspection history indicates ongoing challenges with regulatory compliance, with deficiencies persisting across multiple areas over time.

Read the full inspection reports for this facility, including detailed findings and corrective actions.

Show Inspection Reports

Health Inspection History

Inspections since 2023
Total health inspections 5

Michigan average 6.5


Last Health inspection on Apr 2025

Total health citations
22 Rank #50 / 135Health citations — State benchmarkedThis home is ranked 50th out of 135 homes in Michigan. Shows this facility's total health deficiency citations benchmarked to the Michigan State average, with a ranking across all 135 MI SNFs. Lower citation counts earn a better rank.Click the rank badge to see the full State ranking.Click here to see the full State ranking.

Michigan average 33.5

Citations per inspection
4.4 Rank #52 / 135Citations per inspection — State benchmarkedThis home is ranked 52nd out of 135 homes in Michigan. Shows average deficiency citations per CMS inspection for this facility versus the Michigan mean across 135 SNFs with citation data. Lower is better.Click the rank badge to see the full State ranking.Click here to see the full State ranking.

Michigan average 5.18


Health citations are formal notices following inspections when they fail to comply with safety and care standards.

14 of 22 citations resulted from standard inspections; 3 of 22 resulted from complaint investigations; and 5 of 22 came from combined inspections (standard and complaint).

Breakdown of citation severity (last 3 years)
Critical Health citations
0
100% better than Michigan average

Michigan average: 0.3


Serious Health citations
0
100% better than Michigan average

Michigan average: 1.9

0 critical citations Michigan average: 0.3

0 serious citations Michigan average: 1.9

22 moderate citations Michigan average: 30.8

0 minor citations Michigan average: 0.5
Citations history (last 3 years)
Environmental moderate citation Apr 30, 2025
Corrected

Nutrition moderate citation Apr 30, 2025
Corrected

Nutrition moderate citation Apr 30, 2025
Corrected

Abuse/Neglect moderate citation Oct 01, 2024
Corrected

Staffing Data

Reporting period: October 1 – December 31, 2025 (Q4 2025). Source: CMS Payroll-Based Journal report.

Total staff 98
Employees 82
Contractors 16
Staff to resident ratio 2.00:1
18% better than Michigan average
Michigan average ratio: 1.70:1 Michigan average ratio: 1.70:1See full Michigan ranking
Avg staff/day 33
Average shift 7.9 hours
0% compared with Michigan average
Michigan average: 7.9 hours Michigan average shift: 7.9 hoursSee full Michigan ranking
Total staff hours (quarter) 23,935

Nursing staff breakdown

Q4 2025 · Oct 1 – Dec 31 More info This data comes from the CMS Payroll-Based Journal report covering October 1 – December 31, 2025.
Registered Nurse

Manages medical care and health needs.

RN Staff 6
Average shift length Info Average shift length. Calculated as total hours divided by days worked and average staff per day. 9.4 hours

No contractors work on this role.

Licensed Practical Nurse

Assists with medical care and medications.

LPN Staff 23
Average shift length Info Average shift length. Calculated as total hours divided by days worked and average staff per day. 9.1 hours

No contractors work on this role.

Certified Nursing Assistant

Helps with daily care and mobility.

CNA Staff 42
Average shift length Info Average shift length. Calculated as total hours divided by days worked and average staff per day. 7.6 hours

No contractors work on this role.

Contractor staffing

Q4 2025 · Oct 1 – Dec 31 More info This data comes from the CMS Payroll-Based Journal report covering October 1 – December 31, 2025.

Total hours from contractors

5.4%

1,290 contractor hours this quarter

Respiratory Therapy Technician: 4 Speech Language Pathologist: 3 Physical Therapy Assistant: 3 Physical Therapy Aide: 2 Qualified Social Worker: 2 Feeding Assistant: 1 Medical Director: 1

Staff by category

Q4 2025 · Oct 1 – Dec 31 More info This data comes from the CMS Payroll-Based Journal report covering October 1 – December 31, 2025.
Certified Nursing Assistant 42 0 42 10,631 92 100% 7.6
Licensed Practical Nurse 23 0 23 7,335 92 100% 9.1
Registered Nurse 6 0 6 1,807 90 98% 9.4
Occupational Therapy Aide 5 0 5 603 78 85% 5.1
Administrator 1 0 1 531 66 72% 8
Speech Language Pathologist 0 3 3 520 66 72% 7.7
Mental Health Service Worker 1 0 1 520 66 72% 7.9
Nurse Practitioner 2 0 2 496 59 64% 8.4
Clinical Nurse Specialist 1 0 1 470 63 68% 7.5
Physical Therapy Aide 0 2 2 467 64 70% 7.3
Dietitian 1 0 1 251 45 49% 5.6
Respiratory Therapy Technician 0 4 4 124 41 45% 2.7
Physical Therapy Assistant 0 3 3 96 30 33% 3.1
Qualified Social Worker 0 2 2 49 15 16% 3.3
Feeding Assistant 0 1 1 19 9 10% 2.1
Medical Director 0 1 1 16 8 9% 2
42 Certified Nursing Assistant
% of Days 100%
23 Licensed Practical Nurse
% of Days 100%
6 Registered Nurse
% of Days 98%
5 Occupational Therapy Aide
% of Days 85%
1 Administrator
% of Days 72%
3 Speech Language Pathologist
% of Days 72%
1 Mental Health Service Worker
% of Days 72%
2 Nurse Practitioner
% of Days 64%
1 Clinical Nurse Specialist
% of Days 68%
2 Physical Therapy Aide
% of Days 70%
1 Dietitian
% of Days 49%
4 Respiratory Therapy Technician
% of Days 45%
3 Physical Therapy Assistant
% of Days 33%
2 Qualified Social Worker
% of Days 16%
1 Feeding Assistant
% of Days 10%
1 Medical Director
% of Days 9%

Penalties and fines

Federal penalties imposed by CMS for regulatory violations, including civil money penalties (fines) and denials of payment for new Medicare/Medicaid admissions.

Source: CMS Penalties Database

No penalties in the past 3 years

No civil money penalties or payment denials were reported in the last 3 years.

Quality of care over time

These measures show how residents usually do over time at this home, based on health outcomes and preventive care.

High-risk clinical events score Info A composite score based on pressure ulcers, falls with injury, weight loss, walking ability decline, and activities of daily living decline. 16.9
101% worse than Michigan average

Michigan average: 8.4

Functional decline score Info A composite score based on activities of daily living decline, walking ability decline, and incontinence. 33.2
104% worse than Michigan average

Michigan average: 16.3

Long-stay resident measures
Below average Michigan avg: 4.1 Info CMS star rating based on long-stay quality measure performance. 5 stars = significantly above average, 1 star = significantly below average.
Need for Help with Daily Activities Increased Info Percent of long-stay residents whose need for help with daily activities has increased 29.1%
133% worse than Michigan average

Michigan average: 12.5%

Walking Ability Worsened Info Percent of long-stay residents whose ability to move independently worsened 41.8%
173% worse than Michigan average

Michigan average: 15.3%

Low Risk Residents with Bowel/Bladder Incontinence Info Percent of low risk long-stay residents who lose control of their bowels or bladder 28.7%
37% worse than Michigan average

Michigan average: 21.0%

Falls with Major Injury Info Percent of long-stay residents experiencing one or more falls with major injury 7.0%
121% worse than Michigan average

Michigan average: 3.2%

High Risk Residents with Pressure Ulcers Info Percent of long-stay high risk residents with pressure ulcers 2.9%
50% better than Michigan average

Michigan average: 5.7%

Urinary Tract Infection Info Percent of long-stay residents with a urinary tract infection 0.0%
100% better than Michigan average

Michigan average: 1.7%

Lost Too Much Weight Info Percent of long-stay residents who lose too much weight 3.6%
36% better than Michigan average

Michigan average: 5.7%

Depressive Symptoms Info Percent of long-stay residents who have depressive symptoms 7.9%
104% worse than Michigan average

Michigan average: 3.9%

Antipsychotic Use Info Percent of long-stay residents who received an antipsychotic medication 20.0%
34% worse than Michigan average

Michigan average: 15.0%

Pneumococcal Vaccine Info Percent of long-stay residents assessed and appropriately given the pneumococcal vaccine 84.8%
11% worse than Michigan average

Michigan average: 94.9%

Influenza Vaccine Info Percent of long-stay residents assessed and appropriately given the seasonal influenza vaccine 76.7%
19% worse than Michigan average

Michigan average: 95.0%

Short-stay resident measures
Above average Michigan avg: 3.3 Info CMS star rating based on short-stay quality measure performance. 5 stars = much above average, 1 star = much below average.
Pneumococcal Vaccine Info Percent of short-stay residents assessed and appropriately given the pneumococcal vaccine 62.3%
25% worse than Michigan average

Michigan average: 82.5%

Antipsychotic medication increase Info Percent of short-stay residents who newly received an antipsychotic medication 2.6%
79% worse than Michigan average

Michigan average: 1.4%

Influenza Vaccine Info Percent of short-stay residents assessed and appropriately given the seasonal influenza vaccine 69.4%
13% worse than Michigan average

Michigan average: 79.5%

Re-hospitalized after SNF stay Info Percentage of short-stay residents who were re-hospitalized after their nursing home admission. 26.6%
10% worse than Michigan average

Michigan average: 24.2%

Emergency department visits Info Percentage of short-stay residents who had an outpatient emergency department visit. 2.6%
77% better than Michigan average

Michigan average: 11.5%

Falls with major injury Info Percentage of SNF residents who experience falls with major injury during their stay. 0.0%
100% better than Michigan average

Michigan average: 0.8%

Ability to care for self at discharge Info Percentage of residents at or above expected ability to care for themselves at discharge. 77.3%
44% better than Michigan average

Michigan average: 53.7%

Successful return to home or community Info Rate of successful return to home or community from a skilled nursing facility. 50.7%
In line with Michigan average

Michigan average: 50.6%

Breakdown by payment type

Medicare

28% of new residents, usually for short-term rehab.

Typical stay 28 days

Private pay

58% of new residents, often for short stays.

Typical stay 1 years

Medicaid

14% of new residents, often for long-term daily care.

Typical stay 1 - 2 years

Facility Characteristics

Source: CMS Long-Term Care Facility Characteristics (Data as of Jan 2026)

Total residents 49
Medicare
1
2% of residents
Medicaid
36
73.5% of residents
Private pay or other
12
24.5% of residents
Programs & Services
Residents Group

Residents meet regularly to discuss policies, care quality, and activities

CCRC

Part of a Continuing Care Retirement Community offering multiple care levels

Active Resident Council

Organized group of residents that meets regularly to discuss facility policies, quality of life, and activities.

Finances and operations

Privately-owned community
Operated by a partnership between two or more business owners.
Home revenue
$12.6M
Operating loss
-$1.5M
Privately-owned community Operated by a partnership between two or more business owners.
Home revenue
$12.6M Rank #97 / 134Revenue — State benchmarkedThis home is ranked 97th out of 134 homes in Michigan. Shows this facility's annual revenue compared to the Michigan SNF average. Higher revenue generally means more resources for staffing and capital — read alongside Payroll %.Click the rank badge to see the full State ranking.Click here to see the full State ranking.
Operating loss
-$1.5M
Payroll costs Info The portion of the home's budget spent on staff, including nurses, caregivers, and other employees who support care and operations. Rank #104 / 134Payroll — State benchmarkedThis home is ranked 104th out of 134 homes in Michigan. Shows total annual staff payroll benchmarked to the Michigan average. Higher payroll investment relative to peers often signals better staffing and less reliance on cheaper contract labor.Click the rank badge to see the full State ranking.Click here to see the full State ranking.
$4.7M
37.2% of revenue Rank #88 / 134Payroll % — State benchmarkedThis home is ranked 88th out of 134 homes in Michigan. Shows payroll as a percentage of revenue versus the Michigan average. Well-run Michigan SNFs typically land around 49–59% — the top third Statewide. Below 25% may signal understaffing or heavy agency use — read with Staffing ratings.Click the rank badge to see the full State ranking.Click here to see the full State ranking.
Other operating costs Info All remaining costs needed to run the home, such as food, utilities, building maintenance, supplies and administrative expenses.
$9.4M
Total costs $14.0M

Who this home usually serves

TYPE OF STAY

Mix of rehab and long-term care

This home supports both short-term rehab and long-term care, with residents staying for a wide range of durations.

Places of interest near Windemere Park of Warren

Address 1.1 miles from city center Info Estimated distance in miles from Warren's city center to Windemere Park of Warren's address, calculated via Google Maps. — 7.08 miles to nearest hospital (Corewell Health Beaumont Troy Hospital)

Calculate Travel Distance to Windemere Park of Warren

Add your location

Address

Financial Assistance for
Nursing Home in Michigan

Windemere Park of Warren is located in Warren, Michigan.
Here are the financial assistance programs available to residents in Michigan.

Get Financial aid guidance

MI Choice Waiver

Michigan Medicaid MI Choice Waiver

Age 65+ or disabled
General Michigan resident, Medicaid- eligible, nursing home-level care need.
Income Limits (2025) ~$2,829/month 300% FBR, individual
Asset Limits $2,000 (individual), $3,000 (couple).
MI

Delivered through regional waiver agents; waitlists possible.

Benefits
Personal care (5-7 hours/day) Respite care (240 hours/year) Home modifications ($1,500 avg.) Adult day care ($65/day)

Home Help Program

Michigan Home Help

Age 65+ or disabled
General Michigan resident, Medicaid- eligible or low-income.
Income Limits ~$1,732/month individual, Medicaid threshold
Asset Limits $2,000 individual
MI

Can hire family caregivers; less intensive than waiver.

Benefits
Personal care (up to 60 hours/month) Homemaker services Respite (varies)

Program of All-Inclusive Care for the Elderly (PACE)

Michigan PACE

Age 55+
General Michigan resident, nursing home-level care need, safe with PACE support.
Income Limits (2025) ~$2,829/month (Medicaid-eligible); private pay option available.
Asset Limits $2,000 (individual), $3,000 (couple).
MI

16 PACE centers (e.g., Ingham, Wayne counties); expanding slowly.

Benefits
Personal care (5-7 hours/day) Medical care Meals Transportation Therapy Respite

Medicare Savings Program (MSP)

Michigan Medicare Savings Program

Age 65+ or disabled
General Michigan resident, Medicare Part A/B.
Income Limits (2025) ~$2,510/month (QMB), ~$3,380/month (SLMB), ~$3,598/month (QI)—individual.
Asset Limits $9,430 (individual), $14,130 (couple).
MI

Three tiers; no waitlist; includes Extra Help for Part D.

Benefits
Covers Part B premiums ($174.70/month) Deductibles ($240/year) Copays (~20%)

National Family Caregiver Support Program (NFCSP) Respite

Michigan NFCSP Respite Care

Age
General Caregivers of 60+ needing care or 55+ caregivers of others; Michigan resident; functional needs (2+ ADLs).
Income Limits (2025) Prioritizes ~$24,980/year (individual); no strict cap.
Asset Limits Not assessed; need-based.
MI

16 AAAs; prioritizes low-income, rural caregivers.

Benefits
Respite (4-6 hours/week or 5 days/year) Adult day care ($60/day) Caregiver training

VA Aid and Attendance (A&A) and Housebound Benefits

Michigan VA Aid and Attendance/Housebound

Age 65+ or disabled veteran/spouse
General Michigan resident, wartime service, need for ADL help (A&A) or homebound.
Income Limits (2025) Net income < ~$1,984/month (veteran with dependent, A&A); pension offsets income.
Asset Limits ~$155,356 net worth limit
MI

High veteran demand in urban/rural areas.

Benefits
Cash (~$1,433-$2,642/month veteran, ~$951-$1,318 spouse) for care costs

Frequently Asked Questions about Windemere Park of Warren

Is Windemere Park of Warren in a walkable area?

Windemere Park of Warren has a walk score of 48. Somewhat walkable. A few nearby services may be reachable on foot, but most trips require transportation.

Are there photos of Windemere Park of Warren?

Yes — there are 16 photos of Windemere Park of Warren in the photo gallery on this page.

What is the phone number of Windemere Park of Warren?

(586) 751-5800 will put you in contact with the team at Windemere Park of Warren.

Is Windemere Park of Warren Medicare or Medicaid certified?

Yes — Windemere Park of Warren is a CMS-certified provider of Medicare and Medicaid.

Guides for Better Senior Living

Care Cost Calculator: See Prices in Your Area

Nursing Home Data Explorer

Don’t Wait Too Long: 7 Red Flag Signs Your Parent Needs Assisted Living Now

The True Cost of Assisted Living in 2025 – And How Families Are Paying For It

Understanding Senior Living Costs: Pricing Models, Discounts & Financial Assistance

Explore Open Rooms
1 Contact details
2 What type of senior care service are you looking for?
3 What budget do you have in mind for senior care?
4 How soon do you need to find care?
5 Additional details

Thank you for your interest!

Our team will be in touch shortly to help with next steps.