


Total health inspections
13
Pennsylvania average 6.7
Last Health inspection on May 2025
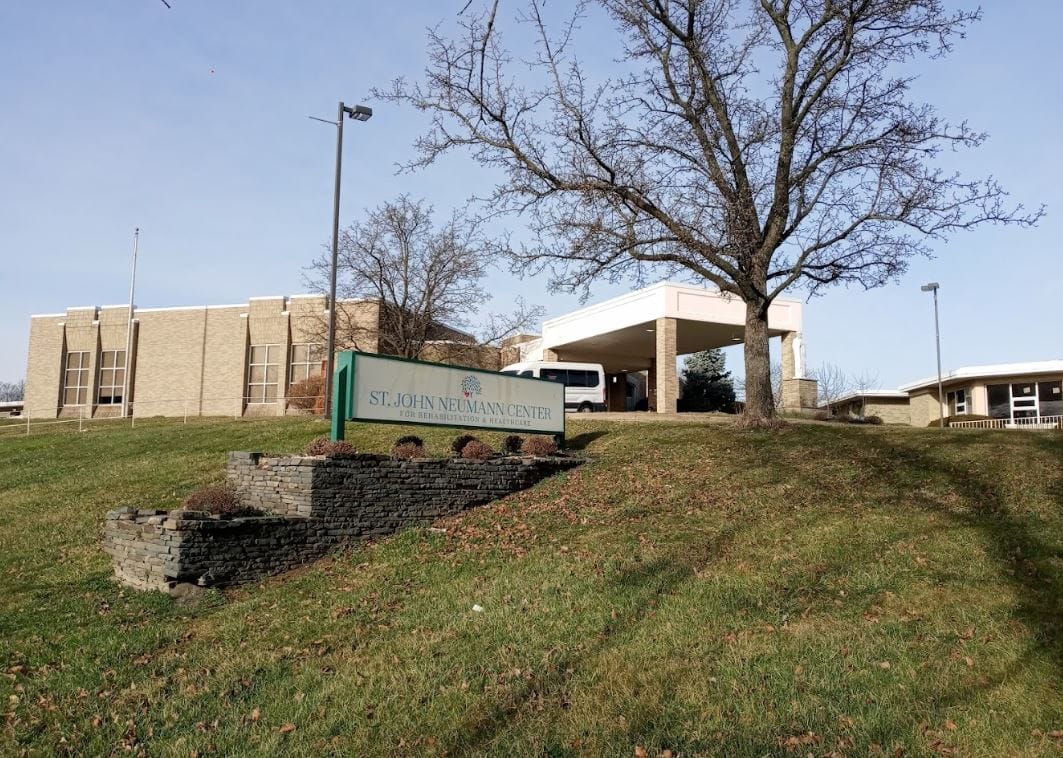

St. John Neumann Center is a nursing home that provides skilled nursing, short-term rehabilitation, and long-term care for older adults in a 226-bed setting on Roosevelt Boulevard in Philadelphia. With a relatively walkable neighborhood, it offers convenient access to nearby services for residents and visiting family members. Moreover, an average length of stay of 130 days also reflects a combination of individuals recovering after hospitalization and those requiring ongoing nursing support. Medicare, Medicaid, and private pay are also accepted, giving families multiple payment options.
The community’s staffing structure helps meet the medical and personal care needs of older adults with varying levels of support. In addition, approximately 4 hours and 11 minutes of nursing care are provided each day. Registered nurses provide an average of 38 minutes per resident, nurse aides contribute 2 hours and 6 minutes of hands-on assistance, and licensed nurses add another 46 minutes of specialized care.
Staffing hours
![]() Daily nursing hours per resident by staff type, reported to CMS. Higher is generally better — compare this facility to state and national averages to see where staffing stands.
Daily nursing hours per resident by staff type, reported to CMS. Higher is generally better — compare this facility to state and national averages to see where staffing stands.
Hours per resident per day vs Pennsylvania averages
Total nursing care
![]() This home is ranked 88th out of 180 homes in Pennsylvania for nurse hours. Total adjusted nursing hours per resident per day, combining RN, LPN, and aide time. CMS adjusts this for case-mix so facilities can be fairly compared.
This home is ranked 88th out of 180 homes in Pennsylvania for nurse hours. Total adjusted nursing hours per resident per day, combining RN, LPN, and aide time. CMS adjusts this for case-mix so facilities can be fairly compared.
4h 11m
At state avg5 of 6 metrics below state avg
In Pennsylvania, the Department of Human Services (for assisted living facilities) and the Department of Health (for nursing homes) conduct unannounced inspections to verify adherence to state regulations.
2 points below the Pennsylvania average for nursing homes (83/100)
Rank #275 / 468 in Pennsylvania Inspection Score — State benchmarked This home is ranked 275th out of 468 homes in Pennsylvania for inspection score. Shows this facility's inspection score compared to the Pennsylvania average among 468 comparable communities in the ranking pool. Facilities with the same value for a metric share the same rank. Rankings are based only on facilities in Pennsylvania that report data for that category. Facilities without available data are excluded from the ranking. This is a proprietary Assisted Living Magazine score. Inspection score: 81 out of 100. Letter grade B-. 2 points below the Pennsylvania average for nursing homes (83/100)
Citations
| This Facility | PA Average | vs. PA Avg |
|---|---|---|---|
|
Total citations
| 48 | 63 | This facility has 24% fewer total citations than a typical Pennsylvania nursing home (48 vs. PA avg 63).↓ 24% better Rank #280 / 478 Total citations — State benchmarked This home is ranked 280th out of 478 homes in Pennsylvania for total citations. Shows this facility's total citations compared to the Pennsylvania average among 478 comparable communities in the ranking pool. Facilities with the same value for a metric share the same rank. Rankings are based only on facilities in Pennsylvania that report data for that category. Facilities without available data are excluded from the ranking. |
|
Citations per inspection
| 3.7 | 5.7 | This facility has 35% fewer citations per inspection than a typical Pennsylvania nursing home (3.7 vs. PA avg 5.7).↓ 35% better Rank #219 / 478 Citations per inspection — State benchmarked This home is ranked 219th out of 478 homes in Pennsylvania for citations per inspection. Shows this facility's citations per inspection compared to the Pennsylvania average among 478 comparable communities in the ranking pool. Facilities with the same value for a metric share the same rank. Rankings are based only on facilities in Pennsylvania that report data for that category. Facilities without available data are excluded from the ranking. |
Inspections
| This Facility | PA Average | vs. PA Avg |
|---|---|---|---|
|
Total inspections
| 13 | 11 | This facility has had 18% more total inspections than the Pennsylvania average (13 vs. PA avg 11). More inspections can mean more regulatory scrutiny rather than worse care.↑ 18% more |
Pennsylvania average 6.7
Last Health inspection on May 2025
Pennsylvania average 31.3
Pennsylvania average 4.4
Health citations are formal notices following inspections when they fail to comply with safety and care standards.
18 of 41 citations resulted from standard inspections; 15 of 41 resulted from complaint investigations; and 8 of 41 came from combined inspections (standard and complaint).
Pennsylvania average: 0.3
Pennsylvania average: 0.6
Reporting period: October 1 – December 31, 2025 (Q4 2025). Source: CMS Payroll-Based Journal report.
Manages medical care and health needs.
Assists with medical care and medications.
Helps with daily care and mobility.
Total hours from contractors
4,274 contractor hours this quarter
| Certified Nursing Assistant | 93 | 44 | 137 | 42,454 | 92 | 100% | 8.1 |
| Licensed Practical Nurse | 34 | 32 | 66 | 15,031 | 92 | 100% | 9.5 |
| Registered Nurse | 37 | 0 | 37 | 11,270 | 92 | 100% | 9.4 |
| Respiratory Therapy Technician | 10 | 0 | 10 | 1,755 | 86 | 93% | 6.8 |
| Therapeutic Recreation Specialist | 9 | 0 | 9 | 1,599 | 80 | 87% | 6.4 |
| Clinical Nurse Specialist | 3 | 0 | 3 | 1,043 | 69 | 75% | 8 |
| Other Social Services Staff | 3 | 0 | 3 | 1,005 | 92 | 100% | 7.6 |
| Physical Therapy Assistant | 4 | 0 | 4 | 1,000 | 74 | 80% | 7.6 |
| Other Dietary Services Staff | 4 | 0 | 4 | 966 | 78 | 85% | 6.4 |
| Physical Therapy Aide | 2 | 0 | 2 | 585 | 76 | 83% | 5.8 |
| Mental Health Service Worker | 2 | 0 | 2 | 528 | 57 | 62% | 8 |
| Qualified Social Worker | 3 | 0 | 3 | 511 | 65 | 71% | 7.5 |
| Administrator | 1 | 0 | 1 | 472 | 59 | 64% | 8 |
| Nurse Practitioner | 1 | 0 | 1 | 464 | 58 | 63% | 8 |
| RN Director of Nursing | 1 | 0 | 1 | 464 | 58 | 63% | 8 |
| Dietitian | 1 | 0 | 1 | 432 | 54 | 59% | 8 |
| Occupational Therapy Aide | 0 | 2 | 2 | 278 | 38 | 41% | 7.3 |
| Medical Director | 0 | 1 | 1 | 70 | 14 | 15% | 5 |
| Occupational Therapy Assistant | 0 | 2 | 2 | 51 | 3 | 3% | 8.5 |
Includes penalties issued in 2025
Federal penalties imposed by CMS for regulatory violations, including civil money penalties (fines) and denials of payment for new Medicare/Medicaid admissions.
Source: CMS Penalties Database (Data as of Jan 2026)
Pennsylvania average: $59K
Pennsylvania average: 2.1
Pennsylvania average: 0.2
Penalties are imposed by CMS for violations of federal nursing home regulations.
1 penalty in the past 3 years
Jan 24, 2025 · $26K
Last updated: Jan 2026
These measures show how residents usually do over time at this home, based on health outcomes and preventive care.
Pennsylvania average: 11.0
Pennsylvania average: 22.2
Pennsylvania average: 19.0%
Pennsylvania average: 21.1%
Pennsylvania average: 26.7%
Pennsylvania average: 3.2%
Pennsylvania average: 5.5%
Pennsylvania average: 1.8%
Pennsylvania average: 6.6%
Pennsylvania average: 5.5%
Pennsylvania average: 17.1%
Pennsylvania average: 86.9%
Pennsylvania average: 93.5%
Pennsylvania average: 1.68
Pennsylvania average: 1.20
Pennsylvania average: 68.8%
Pennsylvania average: 1.5%
Pennsylvania average: 68.7%
Pennsylvania average: 23.1%
Pennsylvania average: 9.8%
Pennsylvania average: 0.8%
Pennsylvania average: 53.7%
Pennsylvania average: 50.6%
Quality measures are calculated from Minimum Data Set (MDS) assessments. For most measures, lower percentages indicate better care quality.
24% of new residents, usually for short-term rehab.
49% of new residents, often for short stays.
27% of new residents, often for long-term daily care.
Source: CMS Long-Term Care Facility Characteristics (Data as of Jan 2026)
Residents meet regularly to discuss policies, care quality, and activities
Organized group of residents that meets regularly to discuss facility policies, quality of life, and activities.
Data sourced from CMS Long-Term Care Facility Characteristics quarterly report. Payer mix reflects the current resident census by primary payment source.
Historical financial and operational data for St. John Neumann Center from 2012–2024, based on CMS SNF Cost Reports.
Key figures below are for fiscal year ending in 06/2024.
Based on CMS SNF Cost Report for fiscal year ending in 06/2024.
Most residents stay for extended periods and receive ongoing daily care.
New residents most often arrive under private pay (49% of admissions), and a typical private pay stay runs around 1 - 2 months.
Coverage residents most often arrive under.
Coverage residents most often leave under.
![]() 10400 Roosevelt Blvd, Philadelphia, PA 19116 — 2.44 miles to nearest hospital (Jefferson Torresdale Hospital)
10400 Roosevelt Blvd, Philadelphia, PA 19116 — 2.44 miles to nearest hospital (Jefferson Torresdale Hospital)
Add your location
Info below is compiled from CMS reports & the PA Depts. of Human Services & Health, senior community websites & trusted data sources such as Walk Score & BBB.
Communities are listed from highest to lowest based on our ranking methodology.
| The Philadelphia Protestant Home | NH IL MC SNF | Philadelphia (Northeast Philadelphia) | 188
Facility
188
PA AVG
94
Rank
#23 / 552 |
50.0%
Facility
50.0%
PA AVG
68.1
Rank
#419 / 506 | -27% | 4.18
Facility
4.18
PA AVG
4.15
Rank
#88 / 180 | +13% | +1% | $0
Facility
$0
PA AVG
$61.2k
Rank
#1 / 183 | 99
Facility
99
PA AVG
83
Rank
#17 / 468 | 16
Facility
16
PA AVG
31.3
Rank
#89 / 178 | 5.3
Facility
5.3
PA AVG
4.4
Rank
#134 / 178 | - | 94 | - |
76
Facility
76
PA AVG
47
Rank
#103 / 657 | Justin Stolte | $28.7MFiscal year ending 12/2023
Facility
$28.7MFiscal year ending 12/2023
PA AVG
$18.8M
Rank
#22 / 167 | $19.0MFiscal year ending 12/2023
Facility
$19.0MFiscal year ending 12/2023
PA AVG
$11.4M
Rank
#18 / 167 | 66.3%Fiscal year ending 12/2023
Facility
66.3%Fiscal year ending 12/2023
PA AVG
69.2%
Rank
#44 / 167 | 395961 | ||||
| Buckingham Valley Rehabilitation and Nursing Center | NH HOS PC RC SNF | Newtown (Durham Road) | 130
Facility
130
PA AVG
94
Rank
#89 / 552 |
95.6%
Facility
95.6%
PA AVG
68.1
Rank
#18 / 506 | +40% | 3.31
Facility
3.31
PA AVG
4.15
Rank
#170 / 180 | -29% | -20% | $0
Facility
$0
PA AVG
$61.2k
Rank
#1 / 183 | - | 10
Facility
10
PA AVG
31.3
Rank
#61 / 178 | 2.0
Facility
2.0
PA AVG
4.4
Rank
#26 / 178 | - | 124 | A+ |
15
Facility
15
PA AVG
47
Rank
#567 / 657 | Bpsh Holdings LLC | $17.1MFiscal year ending 12/2023
Facility
$17.1MFiscal year ending 12/2023
PA AVG
$18.8M
Rank
#79 / 167 | $6.8MFiscal year ending 12/2023
Facility
$6.8MFiscal year ending 12/2023
PA AVG
$11.4M
Rank
#126 / 167 | 39.6%Fiscal year ending 12/2023
Facility
39.6%Fiscal year ending 12/2023
PA AVG
69.2%
Rank
#152 / 167 | 395188 | ||||
| Paul’s Run Retirement Community | NH AL IL RC SNF | Philadelphia (Bustleton) | 170
Facility
170
PA AVG
94
Rank
#36 / 552 | - | - | 3.99
Facility
3.99
PA AVG
4.15
Rank
#109 / 180 | +6% | -4% | $0
Facility
$0
PA AVG
$61.2k
Rank
#1 / 183 | - | 15
Facility
15
PA AVG
31.3
Rank
#83 / 178 | 5.0
Facility
5.0
PA AVG
4.4
Rank
#125 / 178 | - | 111 | A |
66
Facility
66
PA AVG
47
Rank
#166 / 657 | Liberty Lutheran Services | $15.5MFiscal year ending 12/2023
Facility
$15.5MFiscal year ending 12/2023
PA AVG
$18.8M
Rank
#90 / 167 | $16.6MFiscal year ending 12/2023
Facility
$16.6MFiscal year ending 12/2023
PA AVG
$11.4M
Rank
#25 / 167 | 107.1%Fiscal year ending 12/2023
Facility
107.1%Fiscal year ending 12/2023
PA AVG
69.2%
Rank
#15 / 167 | 395738 | ||||
| Simpson House | NH AL IL MC SNF | Philadelphia (Wynnefield Heights) | 142
Facility
142
PA AVG
94
Rank
#67 / 552 |
30.8%
Facility
30.8%
PA AVG
68.1
Rank
#490 / 506 | -55% | 4.05
Facility
4.05
PA AVG
4.15
Rank
#109 / 180 | +45% | -2% | $0
Facility
$0
PA AVG
$61.2k
Rank
#1 / 183 | - | 7
Facility
7
PA AVG
31.3
Rank
#42 / 178 | 2.3
Facility
2.3
PA AVG
4.4
Rank
#43 / 178 | - | 44 | A- |
50
Facility
50
PA AVG
47
Rank
#282 / 657 | Simpson Senior Services | $12.6MFiscal year ending 12/2023
Facility
$12.6MFiscal year ending 12/2023
PA AVG
$18.8M
Rank
#110 / 167 | $9.4MFiscal year ending 12/2023
Facility
$9.4MFiscal year ending 12/2023
PA AVG
$11.4M
Rank
#87 / 167 | 74.5%Fiscal year ending 12/2023
Facility
74.5%Fiscal year ending 12/2023
PA AVG
69.2%
Rank
#29 / 167 | 395121 | ||||
| St. John Neumann Center | NH HOS MC PC RC SNF | Philadelphia (Northeast Philadelphia) | 226
Facility
226
PA AVG
94
Rank
#15 / 552 | - | - | 4.18
Facility
4.18
PA AVG
4.15
Rank
#88 / 180 | +7% | +1% | $26.0k
Facility
$26.0k
PA AVG
$61.2k
Rank
#157 / 183 | 81
Facility
81
PA AVG
83
Rank
#275 / 468 | 41
Facility
41
PA AVG
31.3
Rank
#138 / 178 | 3.2
Facility
3.2
PA AVG
4.4
Rank
#73 / 178 | 1 | 32 | A+ |
66
Facility
66
PA AVG
47
Rank
#166 / 657 | 10400 Roosevelt Ventures LLC | $22.3MFiscal year ending 06/2024
Facility
$22.3MFiscal year ending 06/2024
PA AVG
$18.8M
Rank
#44 / 167 | $10.4MFiscal year ending 06/2024
Facility
$10.4MFiscal year ending 06/2024
PA AVG
$11.4M
Rank
#73 / 167 | 46.7%Fiscal year ending 06/2024
Facility
46.7%Fiscal year ending 06/2024
PA AVG
69.2%
Rank
#123 / 167 | 395182 |
St. John Neumann Center is located in Philadelphia, Pennsylvania.
Here are the financial assistance programs available to residents in Pennsylvania.
St. John Neumann Center is in the Northeast Philadelphia neighborhood of Philadelphia.
St. John Neumann Center has a walk score of 66. Moderately walkable. Some errands can be accomplished on foot, with a mix of nearby amenities.
St. John Neumann Center's occupancy is 93.9%.
No, St. John Neumann Center has a no-pet policy.
St. John Neumann Center is registered as a for-profit in PA.
St. John Neumann Center has had 48 reported citations since 2023 according to records from Pennsylvania Department of Human Services (DHS).
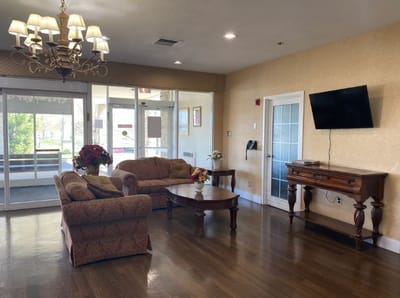
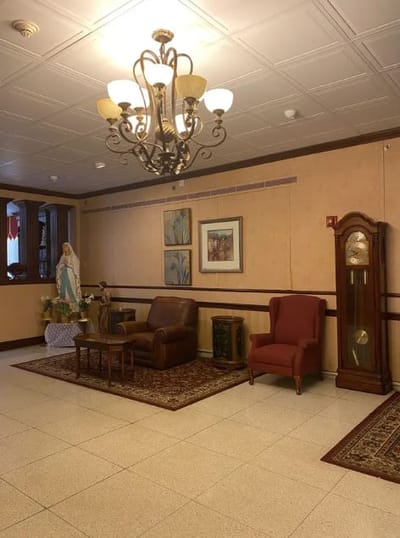
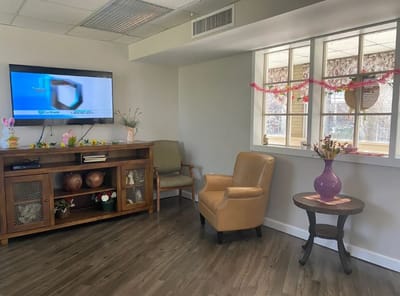
Yes — there are 5 photos of St. John Neumann Center in the photo gallery on this page.
Care Cost Calculator: See Prices in Your Area
Nursing Home Data Explorer
Don’t Wait Too Long: 7 Red Flag Signs Your Parent Needs Assisted Living Now
The True Cost of Assisted Living in 2025 – And How Families Are Paying For It
Understanding Senior Living Costs: Pricing Models, Discounts & Financial Assistance


