


Total staff
197
Employees
150
Contractors
47
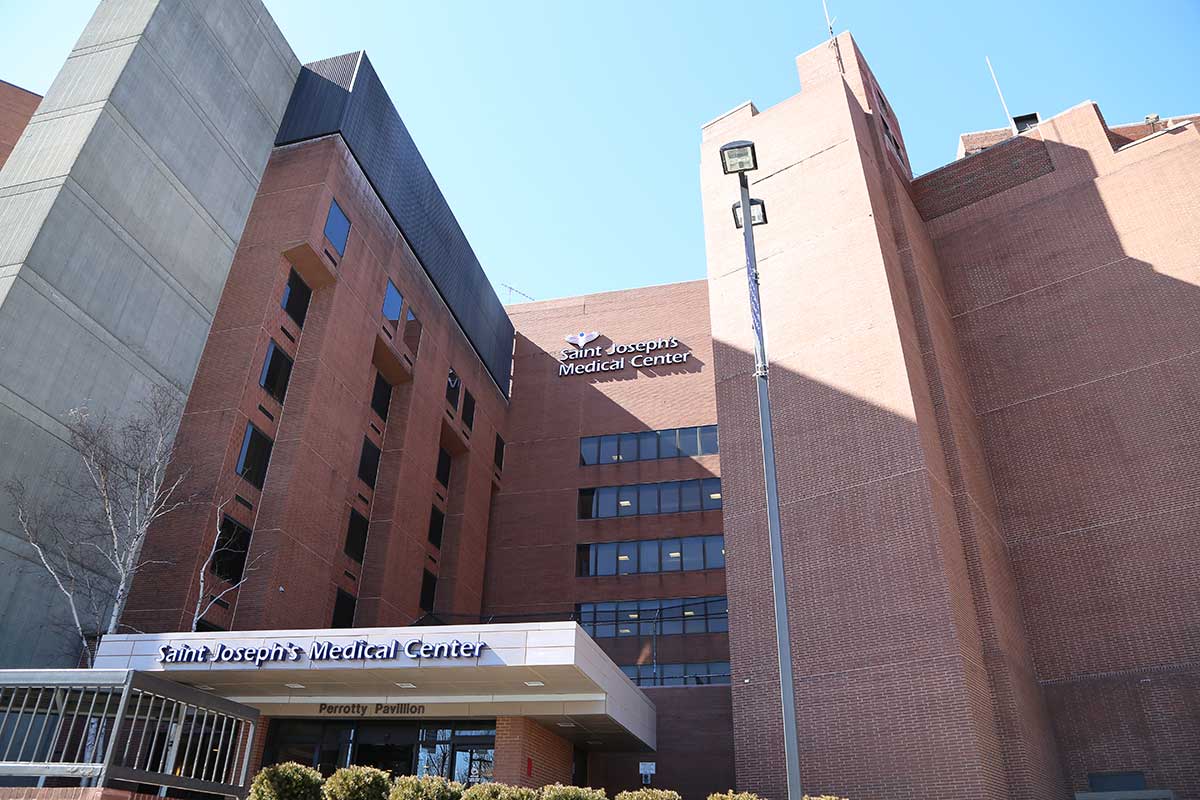
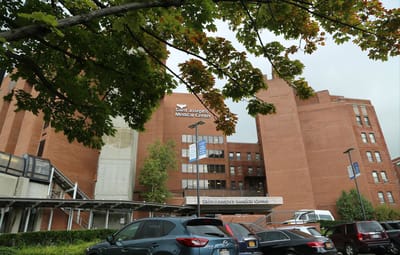
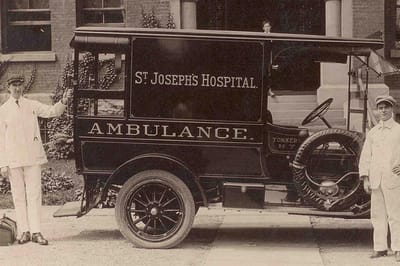
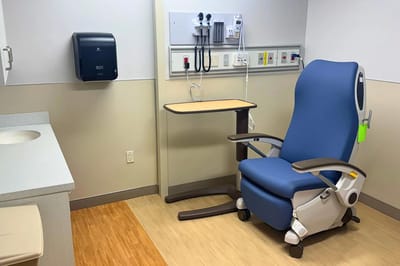


Located in Yonkers, New York, St. Joseph’s Medical Center is a renowned healthcare provider offering top-notch nursing home services to residents in the surrounding communities. With a history dating back to 1888, this facility has been dedicated to delivering patient-centered care of the highest quality. Committed to meeting the diverse needs of its patients, St. Joseph’s Medical
Center offers a wide range of specialized programs and services. From orthopedics and cardiology to family medicine and state-of-the-art diagnostic imaging, they have the expertise and technology to deliver exceptional care.
In addition, their comprehensive network of primary care services ensures that patients receive the ongoing support they need for their overall health and well-being. At St. Joseph’s Medical Center, patients can trust that their health and well-being are in capable hands.
| Staff type | Hours / Day / Resident | vs state avg |
|---|---|---|
|
Registered Nurse (RN)
| 39m per day | ▼ 7% State avg: 42m per day · National avg: 41m per day |
|
LPN / LVN
| 32m per day | ▼ 31% State avg: 47m per day · National avg: 52m per day |
|
Nurse Aide
| 1h 59m per day | ▼ 9% State avg: 2h 11m per day · National avg: 2h 20m per day |
|
Weekend Total Nursing
| 2h 47m per day | ▼ 14% State avg: 3h 14m per day · National avg: 3h 27m per day |
|
Physical Therapist
| 4m per day | ▼ 45% State avg: 7m per day · National avg: 4m per day |
|
Weekend RN
| 24m per day | ▼ 16% State avg: 29m per day · National avg: 29m per day |
Reporting period: October 1 – December 31, 2025 (Q4 2025). Source: CMS Payroll-Based Journal report.
Manages medical care and health needs.
Assists with medical care and medications.
Helps with daily care and mobility.
Total hours from contractors
7,524 contractor hours this quarter
| Certified Nursing Assistant | 79 | 0 | 79 | 34,759 | 92 | 100% | 8.8 |
| Registered Nurse | 29 | 7 | 36 | 9,544 | 92 | 100% | 8 |
| Licensed Practical Nurse | 29 | 0 | 29 | 9,059 | 92 | 100% | 8.6 |
| Other Dietary Services Staff | 5 | 0 | 5 | 2,044 | 90 | 98% | 7.2 |
| Physical Therapy Aide | 0 | 7 | 7 | 1,994 | 74 | 80% | 6.9 |
| Speech Language Pathologist | 0 | 8 | 8 | 1,593 | 74 | 80% | 6.9 |
| Clinical Nurse Specialist | 3 | 0 | 3 | 1,384 | 66 | 72% | 7.6 |
| Respiratory Therapy Technician | 0 | 5 | 5 | 1,068 | 78 | 85% | 6.3 |
| Dental Services Staff | 0 | 2 | 2 | 550 | 62 | 67% | 6.3 |
| Mental Health Service Worker | 1 | 0 | 1 | 488 | 61 | 66% | 8 |
| Dietitian | 1 | 0 | 1 | 480 | 60 | 65% | 8 |
| Administrator | 1 | 0 | 1 | 464 | 58 | 63% | 8 |
| Nurse Practitioner | 1 | 0 | 1 | 448 | 56 | 61% | 8 |
| Qualified Social Worker | 0 | 4 | 4 | 445 | 68 | 74% | 5.9 |
| Physical Therapy Assistant | 0 | 1 | 1 | 437 | 61 | 66% | 7.2 |
| RN Director of Nursing | 1 | 0 | 1 | 327 | 41 | 45% | 8 |
| Respiratory Therapist | 0 | 1 | 1 | 304 | 64 | 70% | 4.7 |
| Feeding Assistant | 0 | 3 | 3 | 270 | 66 | 72% | 2 |
| Other Physician | 0 | 7 | 7 | 233 | 66 | 72% | 2.1 |
| Diagnostic X-ray Services Staff | 0 | 1 | 1 | 70 | 14 | 15% | 5 |
| Medical Director | 0 | 1 | 1 | 26 | 13 | 14% | 2 |
Includes penalties issued in 2024
Federal penalties imposed by CMS for regulatory violations, including civil money penalties (fines) and denials of payment for new Medicare/Medicaid admissions.
Source: CMS Penalties Database (Data as of Jan 2026)
New York average: $66K
New York average: 2.0
New York average: 0.1
Penalties are imposed by CMS for violations of federal nursing home regulations.
1 penalty in the past 3 years
Feb 7, 2024 · $37K
Last updated: Jan 2026
These measures show how residents usually do over time at this home, based on health outcomes and preventive care.
New York average: 9.8
New York average: 18.1
New York average: 16.4%
New York average: 16.6%
New York average: 21.4%
New York average: 3.0%
New York average: 7.2%
New York average: 1.4%
New York average: 6.1%
New York average: 18.1%
New York average: 12.6%
New York average: 91.4%
New York average: 95.2%
New York average: 76.6%
New York average: 1.3%
New York average: 78.8%
Quality measures are calculated from Minimum Data Set (MDS) assessments. For most measures, lower percentages indicate better care quality.
30% of new residents, usually for short-term rehab.
56% of new residents, often for short stays.
14% of new residents, often for long-term daily care.
Source: CMS Long-Term Care Facility Characteristics (Data as of Jan 2026)
Residents meet regularly to discuss policies, care quality, and activities
State-approved Nurse Aide Training and Competency Evaluation Program on-site
Organized group of residents that meets regularly to discuss facility policies, quality of life, and activities.
Data sourced from CMS Long-Term Care Facility Characteristics quarterly report. Payer mix reflects the current resident census by primary payment source.
Historical financial and operational data for St Joseph‘s Hospital Nursing Home Of Yonkers from 2019–2023, based on CMS SNF Cost Reports.
Key figures below are for fiscal year ending in 12/2023.
Based on CMS SNF Cost Report for fiscal year ending in 12/2023.
This home supports both short-term rehab and long-term care, with residents staying for a wide range of durations.
Most new residents arrive under private pay (56% of admissions), and a typical private pay stay runs around 1 - 2 months.
Coverage residents most often arrive under.
Coverage residents most often leave under.
![]() 0.2 miles from city center
0.2 miles from city center
![]() Estimated distance in miles from Yonkers's city center to St Joseph‘s Hospital Nursing Home Of Yonkers's address, calculated via Google Maps.
Estimated distance in miles from Yonkers's city center to St Joseph‘s Hospital Nursing Home Of Yonkers's address, calculated via Google Maps.
Add your location
Info below is compiled from CMS reports & the NY State Dept. of Health (NYSDOH), senior community websites & trusted data sources such as Walk Score & BBB.
Communities are listed from highest to lowest based on our ranking methodology.
| The Grand Rehabilitation and Nursing at Queens | NH | Whitestone | 179
Facility
179
NY AVG
160
Rank
#270 / 739 |
96.4%
Facility
96.4%
NY AVG
87.1
Rank
#126 / 410 | +11% | 2.78
Facility
2.78
NY AVG
3.58
Rank
#312 / 394 | +16% | -22% | $0
Facility
$0
NY AVG
$67.6k
Rank
#1 / 402 | - | 8
Facility
8
NY AVG
18.5
Rank
#42 / 401 | 2.7
Facility
2.7
NY AVG
5.1
Rank
#42 / 401 | - | 173 | - |
83
Facility
83
NY AVG
63
Rank
#412 / 1169 | Jeremy Strauss | $30.9MFiscal year ending 12/2023
Facility
$30.9MFiscal year ending 12/2023
NY AVG
$32.0M
Rank
#184 / 388 | $15.0MFiscal year ending 12/2023
Facility
$15.0MFiscal year ending 12/2023
NY AVG
$10.7M
Rank
#166 / 388 | 48.7%Fiscal year ending 12/2023
Facility
48.7%Fiscal year ending 12/2023
NY AVG
37%
Rank
#150 / 388 | 335130 | ||||
| Dumont Center for Rehabilitation and Healthcare | NH MC SNF | New Rochelle (Rosedale) | 196
Facility
196
NY AVG
160
Rank
#233 / 739 |
92.9%
Facility
92.9%
NY AVG
87.1
Rank
#238 / 410 | +7% | 2.71
Facility
2.71
NY AVG
3.58
Rank
#340 / 394 | +74% | -24% | $0
Facility
$0
NY AVG
$67.6k
Rank
#1 / 402 | - | 9
Facility
9
NY AVG
18.5
Rank
#57 / 401 | 4.5
Facility
4.5
NY AVG
5.1
Rank
#177 / 401 | - | 182 | - |
48
Facility
48
NY AVG
63
Rank
#794 / 1169 | Chana Brauner | $40.8MFiscal year ending 12/2023
Facility
$40.8MFiscal year ending 12/2023
NY AVG
$32.0M
Rank
#158 / 388 | $16.9MFiscal year ending 12/2023
Facility
$16.9MFiscal year ending 12/2023
NY AVG
$10.7M
Rank
#105 / 388 | 41.3%Fiscal year ending 12/2023
Facility
41.3%Fiscal year ending 12/2023
NY AVG
37%
Rank
#52 / 388 | 335271 | ||||
| Sans Souci Rehabilitation and Nursing Center | NH HOS MC PC RC SNF | Yonkers (City Of Yonkers) | 120
Facility
120
NY AVG
160
Rank
#408 / 739 |
88.1%
Facility
88.1%
NY AVG
87.1
Rank
#314 / 410 | +1% | 2.75
Facility
2.75
NY AVG
3.58
Rank
#340 / 394 | +55% | -23% | $0
Facility
$0
NY AVG
$67.6k
Rank
#1 / 402 | - | 47
Facility
47
NY AVG
18.5
Rank
#393 / 401 | 6.7
Facility
6.7
NY AVG
5.1
Rank
#317 / 401 | - | 106 | - |
74
Facility
74
NY AVG
63
Rank
#540 / 1169 | Westchester Park Ventures LLC | $19.1MFiscal year ending 12/2023
Facility
$19.1MFiscal year ending 12/2023
NY AVG
$32.0M
Rank
#307 / 388 | $5.6MFiscal year ending 12/2023
Facility
$5.6MFiscal year ending 12/2023
NY AVG
$10.7M
Rank
#297 / 388 | 29.3%Fiscal year ending 12/2023
Facility
29.3%Fiscal year ending 12/2023
NY AVG
37%
Rank
#138 / 388 | 335398 | ||||
| Adira at Riverside Rehabilitation and Nursing | NH MC RC SNF | Yonkers | 120
Facility
120
NY AVG
160
Rank
#408 / 739 |
95.0%
Facility
95.0%
NY AVG
87.1
Rank
#174 / 410 | +9% | 2.81
Facility
2.81
NY AVG
3.58
Rank
#312 / 394 | +76% | -21% | $66.9k
Facility
$66.9k
NY AVG
$67.6k
Rank
#366 / 402 | 73
Facility
73
NY AVG
83
Rank
#477 / 608 | 18
Facility
18
NY AVG
18.5
Rank
#213 / 401 | 4.5
Facility
4.5
NY AVG
5.1
Rank
#177 / 401 | 2 | 114 | - |
44
Facility
44
NY AVG
63
Rank
#835 / 1169 | L&A Operations LLC (For Profit) | $29.9MFiscal year ending 12/2023
Facility
$29.9MFiscal year ending 12/2023
NY AVG
$32.0M
Rank
#199 / 388 | $6.3MFiscal year ending 12/2023
Facility
$6.3MFiscal year ending 12/2023
NY AVG
$10.7M
Rank
#343 / 388 | 21.1%Fiscal year ending 12/2023
Facility
21.1%Fiscal year ending 12/2023
NY AVG
37%
Rank
#386 / 388 | 335829 | ||||
| St Joseph‘s Hospital Nursing Home Of Yonkers | NH | Broadway Yonkers (South Broadway) | 200
Facility
200
NY AVG
160
Rank
#166 / 739 |
95.3%
Facility
95.3%
NY AVG
87.1
Rank
#166 / 410 | +9% | 2.88
Facility
2.88
NY AVG
3.58
Rank
#287 / 394 | +45% | -19% | $98.9k
Facility
$98.9k
NY AVG
$67.6k
Rank
#376 / 402 | - | 36
Facility
36
NY AVG
18.5
Rank
#366 / 401 | 6.0
Facility
6.0
NY AVG
5.1
Rank
#281 / 401 | 1 | 191 | - |
94
Facility
94
NY AVG
63
Rank
#158 / 1169 | - | $23.2MFiscal year ending 12/2023
Facility
$23.2MFiscal year ending 12/2023
NY AVG
$32.0M
Rank
#226 / 388 | $10.0MFiscal year ending 12/2023
Facility
$10.0MFiscal year ending 12/2023
NY AVG
$10.7M
Rank
#222 / 388 | 42.9%Fiscal year ending 12/2023
Facility
42.9%Fiscal year ending 12/2023
NY AVG
37%
Rank
#202 / 388 | 335515 |
St Joseph‘s Hospital Nursing Home Of Yonkers is located in Broadway Yonkers, New York State.
Here are the financial assistance programs available to residents in New York State.
St Joseph‘s Hospital Nursing Home Of Yonkers is in the South Broadway neighborhood.
St Joseph‘s Hospital Nursing Home Of Yonkers has a walk score of 94. Walker's paradise. Daily errands do not require a car, with many shops and services nearby.
St Joseph‘s Hospital Nursing Home Of Yonkers's occupancy is 57.0%.
No, St Joseph‘s Hospital Nursing Home Of Yonkers has a no-pet policy.
St Joseph‘s Hospital Nursing Home Of Yonkers is registered as a for-profit.
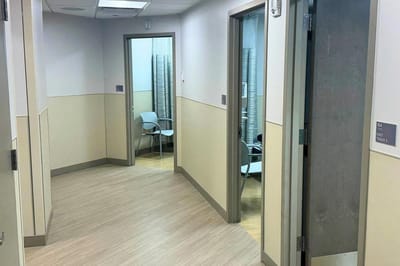
Yes — there are 11 photos of St Joseph‘s Hospital Nursing Home Of Yonkers in the photo gallery on this page.
St Joseph‘s Hospital Nursing Home Of Yonkers is located at 127 S Broadway, Yonkers, NY 10701.
Care Cost Calculator: See Prices in Your Area
Nursing Home Data Explorer
Don’t Wait Too Long: 7 Red Flag Signs Your Parent Needs Assisted Living Now
The True Cost of Assisted Living in 2025 – And How Families Are Paying For It
Understanding Senior Living Costs: Pricing Models, Discounts & Financial Assistance


