


Total staff
309
Employees
153
Contractors
156
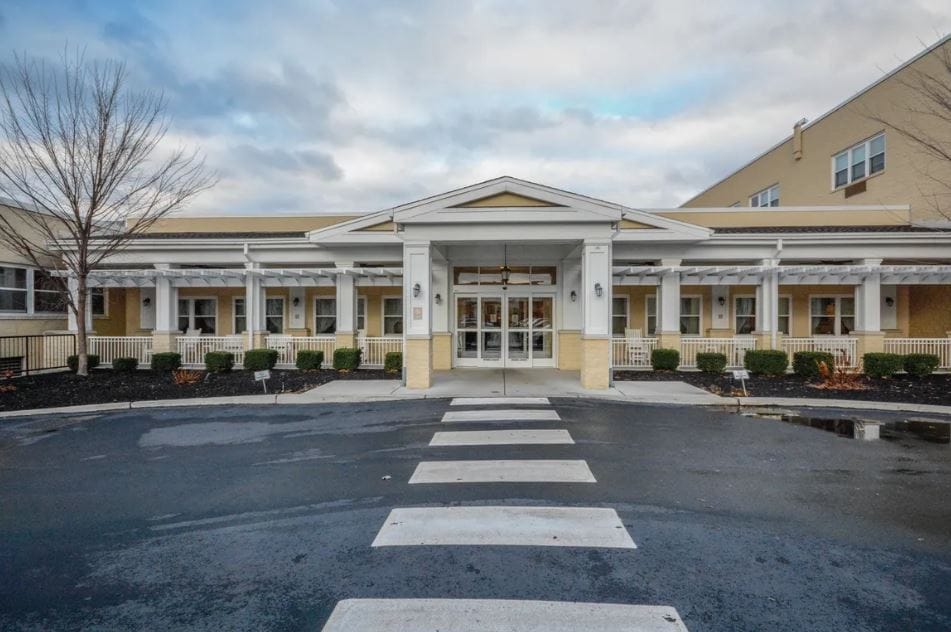

Located in Philadelphia, Pennsylvania, St. Monica Center is a nursing home that provides skilled nursing care for older adults requiring either short-term rehabilitation or long-term support. This 180-bed community currently operates at 95.2% occupancy, with an average length of stay of 97 days. This also reflects a balance between residents recovering from illness and those needing ongoing nursing care. Medicare, Medicaid, and private pay are also accepted, offering families flexible payment options.
Residents receive approximately 3 hours and 49 minutes of daily care, including 34 minutes from registered nurses, 2 hours and 6 minutes of hands-on assistance from nurse aides, and 52 minutes from licensed nurses. This staffing structure helps meet a wide range of medical and personal care needs.
The community’s convenient location allows older adults to stay connected to nearby services while making visits easier for family and friends, as it is set in a highly walkable neighborhood with a Walk Score of 86.
Staffing hours
![]() Daily nursing hours per resident by staff type, reported to CMS. Higher is generally better — compare this facility to state and national averages to see where staffing stands.
Daily nursing hours per resident by staff type, reported to CMS. Higher is generally better — compare this facility to state and national averages to see where staffing stands.
Hours per resident per day vs Pennsylvania averages
Total nursing care
![]() This home is ranked 131st out of 180 homes in Pennsylvania for nurse hours. Total adjusted nursing hours per resident per day, combining RN, LPN, and aide time. CMS adjusts this for case-mix so facilities can be fairly compared.
This home is ranked 131st out of 180 homes in Pennsylvania for nurse hours. Total adjusted nursing hours per resident per day, combining RN, LPN, and aide time. CMS adjusts this for case-mix so facilities can be fairly compared.
3h 49m
8% below state avg5 of 6 metrics below state avg
Reporting period: October 1 – December 31, 2025 (Q4 2025). Source: CMS Payroll-Based Journal report.
Manages medical care and health needs.
Assists with medical care and medications.
Helps with daily care and mobility.
Total hours from contractors
14,322 contractor hours this quarter
| Certified Nursing Assistant | 58 | 123 | 181 | 33,838 | 92 | 100% | 8.3 |
| Licensed Practical Nurse | 40 | 29 | 69 | 13,981 | 92 | 100% | 9.3 |
| Registered Nurse | 22 | 0 | 22 | 8,036 | 92 | 100% | 8.9 |
| Respiratory Therapy Technician | 5 | 0 | 5 | 1,863 | 82 | 89% | 8.3 |
| Physical Therapy Assistant | 4 | 0 | 4 | 1,740 | 73 | 79% | 7.7 |
| Other Dietary Services Staff | 7 | 0 | 7 | 1,510 | 92 | 100% | 5.4 |
| Mental Health Service Worker | 2 | 0 | 2 | 927 | 66 | 72% | 7.8 |
| Speech Language Pathologist | 3 | 0 | 3 | 917 | 65 | 71% | 8 |
| Clinical Nurse Specialist | 3 | 0 | 3 | 726 | 66 | 72% | 7.6 |
| Physical Therapy Aide | 2 | 0 | 2 | 531 | 66 | 72% | 6.6 |
| Dietitian | 1 | 0 | 1 | 500 | 63 | 68% | 7.9 |
| Nurse Practitioner | 2 | 0 | 2 | 480 | 60 | 65% | 8 |
| Administrator | 1 | 0 | 1 | 415 | 54 | 59% | 7.7 |
| Qualified Social Worker | 2 | 0 | 2 | 376 | 53 | 58% | 7.1 |
| Occupational Therapy Assistant | 0 | 3 | 3 | 85 | 9 | 10% | 5.6 |
| Medical Director | 0 | 1 | 1 | 65 | 26 | 28% | 2.5 |
| RN Director of Nursing | 1 | 0 | 1 | 21 | 5 | 5% | 4.2 |
Federal penalties imposed by CMS for regulatory violations, including civil money penalties (fines) and denials of payment for new Medicare/Medicaid admissions.
Source: CMS Penalties Database
No penalties in the past 3 years
No civil money penalties or payment denials were reported in the last 3 years.
These measures show how residents usually do over time at this home, based on health outcomes and preventive care.
Pennsylvania average: 11.0
Pennsylvania average: 22.2
Pennsylvania average: 19.0%
Pennsylvania average: 21.1%
Pennsylvania average: 26.7%
Pennsylvania average: 3.2%
Pennsylvania average: 5.5%
Pennsylvania average: 1.8%
Pennsylvania average: 6.6%
Pennsylvania average: 5.5%
Pennsylvania average: 17.1%
Pennsylvania average: 86.9%
Pennsylvania average: 93.5%
Pennsylvania average: 1.68
Pennsylvania average: 1.20
Pennsylvania average: 68.8%
Pennsylvania average: 1.5%
Pennsylvania average: 68.7%
Pennsylvania average: 23.1%
Pennsylvania average: 9.8%
Pennsylvania average: 0.8%
Pennsylvania average: 53.7%
Pennsylvania average: 50.6%
Quality measures are calculated from Minimum Data Set (MDS) assessments. For most measures, lower percentages indicate better care quality.
47% of new residents, usually for short-term rehab.
35% of new residents, often for short stays.
18% of new residents, often for long-term daily care.
Source: CMS Long-Term Care Facility Characteristics (Data as of Jan 2026)
Residents meet regularly to discuss policies, care quality, and activities
Organized group of residents that meets regularly to discuss facility policies, quality of life, and activities.
Data sourced from CMS Long-Term Care Facility Characteristics quarterly report. Payer mix reflects the current resident census by primary payment source.
Historical financial and operational data for St. Monica Center from 2012–2024, based on CMS SNF Cost Reports.
Key figures below are for fiscal year ending in 06/2024.
Based on CMS SNF Cost Report for fiscal year ending in 06/2024.
Most residents typically stay for a few weeks or months before returning home or moving on.
New residents most often arrive under Medicare (47% of admissions), and a typical Medicare stay runs around 27 days.
Coverage residents most often arrive under.
Coverage residents most often leave under.
![]() 3.4 miles from city center
3.4 miles from city center
![]() Estimated distance in miles from Philadelphia's city center to St. Monica Center's address, calculated via Google Maps.
Estimated distance in miles from Philadelphia's city center to St. Monica Center's address, calculated via Google Maps.
Add your location
Info below is compiled from CMS reports & the PA Depts. of Human Services & Health, senior community websites & trusted data sources such as Walk Score & BBB.
Communities are listed from highest to lowest based on our ranking methodology.
| The Philadelphia Protestant Home | NH IL MC SNF | Philadelphia (Northeast Philadelphia) | 188
Facility
188
PA AVG
94
Rank
#23 / 552 |
50.0%
Facility
50.0%
PA AVG
68.1
Rank
#419 / 506 | -27% | 4.18
Facility
4.18
PA AVG
4.15
Rank
#88 / 180 | +13% | +1% | $0
Facility
$0
PA AVG
$61.2k
Rank
#1 / 183 | 99
Facility
99
PA AVG
83
Rank
#17 / 468 | 16
Facility
16
PA AVG
31.3
Rank
#89 / 178 | 5.3
Facility
5.3
PA AVG
4.4
Rank
#134 / 178 | - | 94 | - |
76
Facility
76
PA AVG
47
Rank
#103 / 657 | Justin Stolte | $28.7MFiscal year ending 12/2023
Facility
$28.7MFiscal year ending 12/2023
PA AVG
$18.8M
Rank
#22 / 167 | $19.0MFiscal year ending 12/2023
Facility
$19.0MFiscal year ending 12/2023
PA AVG
$11.4M
Rank
#18 / 167 | 66.3%Fiscal year ending 12/2023
Facility
66.3%Fiscal year ending 12/2023
PA AVG
69.2%
Rank
#44 / 167 | 395961 | ||||
| Buckingham Valley Rehabilitation and Nursing Center | NH HOS PC RC SNF | Newtown (Durham Road) | 130
Facility
130
PA AVG
94
Rank
#89 / 552 |
95.6%
Facility
95.6%
PA AVG
68.1
Rank
#18 / 506 | +40% | 3.31
Facility
3.31
PA AVG
4.15
Rank
#170 / 180 | -29% | -20% | $0
Facility
$0
PA AVG
$61.2k
Rank
#1 / 183 | - | 10
Facility
10
PA AVG
31.3
Rank
#61 / 178 | 2.0
Facility
2.0
PA AVG
4.4
Rank
#26 / 178 | - | 124 | A+ |
15
Facility
15
PA AVG
47
Rank
#567 / 657 | Bpsh Holdings LLC | $17.1MFiscal year ending 12/2023
Facility
$17.1MFiscal year ending 12/2023
PA AVG
$18.8M
Rank
#79 / 167 | $6.8MFiscal year ending 12/2023
Facility
$6.8MFiscal year ending 12/2023
PA AVG
$11.4M
Rank
#126 / 167 | 39.6%Fiscal year ending 12/2023
Facility
39.6%Fiscal year ending 12/2023
PA AVG
69.2%
Rank
#152 / 167 | 395188 | ||||
| Paul’s Run Retirement Community | NH AL IL RC SNF | Philadelphia (Bustleton) | 170
Facility
170
PA AVG
94
Rank
#36 / 552 | - | - | 3.99
Facility
3.99
PA AVG
4.15
Rank
#109 / 180 | +6% | -4% | $0
Facility
$0
PA AVG
$61.2k
Rank
#1 / 183 | - | 15
Facility
15
PA AVG
31.3
Rank
#83 / 178 | 5.0
Facility
5.0
PA AVG
4.4
Rank
#125 / 178 | - | 111 | A |
66
Facility
66
PA AVG
47
Rank
#166 / 657 | Liberty Lutheran Services | $15.5MFiscal year ending 12/2023
Facility
$15.5MFiscal year ending 12/2023
PA AVG
$18.8M
Rank
#90 / 167 | $16.6MFiscal year ending 12/2023
Facility
$16.6MFiscal year ending 12/2023
PA AVG
$11.4M
Rank
#25 / 167 | 107.1%Fiscal year ending 12/2023
Facility
107.1%Fiscal year ending 12/2023
PA AVG
69.2%
Rank
#15 / 167 | 395738 | ||||
| Simpson House | NH AL IL MC SNF | Philadelphia (Wynnefield Heights) | 142
Facility
142
PA AVG
94
Rank
#67 / 552 |
30.8%
Facility
30.8%
PA AVG
68.1
Rank
#490 / 506 | -55% | 4.05
Facility
4.05
PA AVG
4.15
Rank
#109 / 180 | +45% | -2% | $0
Facility
$0
PA AVG
$61.2k
Rank
#1 / 183 | - | 7
Facility
7
PA AVG
31.3
Rank
#42 / 178 | 2.3
Facility
2.3
PA AVG
4.4
Rank
#43 / 178 | - | 44 | A- |
50
Facility
50
PA AVG
47
Rank
#282 / 657 | Simpson Senior Services | $12.6MFiscal year ending 12/2023
Facility
$12.6MFiscal year ending 12/2023
PA AVG
$18.8M
Rank
#110 / 167 | $9.4MFiscal year ending 12/2023
Facility
$9.4MFiscal year ending 12/2023
PA AVG
$11.4M
Rank
#87 / 167 | 74.5%Fiscal year ending 12/2023
Facility
74.5%Fiscal year ending 12/2023
PA AVG
69.2%
Rank
#29 / 167 | 395121 | ||||
| St. Monica Center | NH HOS MC PC RC SNF | Philadelphia (Whitman) | 180
Facility
180
PA AVG
94
Rank
#28 / 552 |
97.6%
Facility
97.6%
PA AVG
68.1
Rank
#6 / 506 | +43% | 3.82
Facility
3.82
PA AVG
4.15
Rank
#131 / 180 | -41% | -8% | $0
Facility
$0
PA AVG
$61.2k
Rank
#1 / 183 | - | 47
Facility
47
PA AVG
31.3
Rank
#150 / 178 | 5.9
Facility
5.9
PA AVG
4.4
Rank
#145 / 178 | - | 176 | - |
86
Facility
86
PA AVG
47
Rank
#42 / 657 | 2509 South Fourth Ventures, LLC | $21.4MFiscal year ending 06/2024
Facility
$21.4MFiscal year ending 06/2024
PA AVG
$18.8M
Rank
#50 / 167 | $8.8MFiscal year ending 06/2024
Facility
$8.8MFiscal year ending 06/2024
PA AVG
$11.4M
Rank
#96 / 167 | 41.1%Fiscal year ending 06/2024
Facility
41.1%Fiscal year ending 06/2024
PA AVG
69.2%
Rank
#147 / 167 | 395558 |
St. Monica Center is located in Philadelphia, Pennsylvania.
Here are the financial assistance programs available to residents in Pennsylvania.
St. Monica Center is in the Whitman neighborhood.
St. Monica Center has a walk score of 86. Very walkable. Most errands can be accomplished on foot, and many essentials are within a short walk.
St. Monica Center's occupancy is 95.2%.
No, St. Monica Center has a no-pet policy.
St. Monica Center is registered as a for-profit.
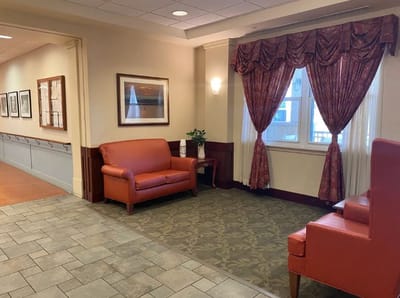
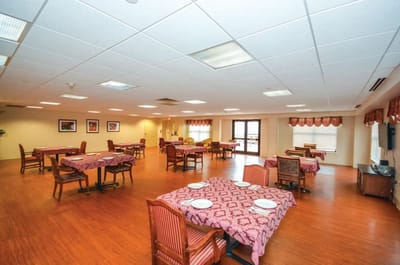
Yes — there are 4 photos of St. Monica Center in the photo gallery on this page.
St. Monica Center is located at 2509 S 4Th St #521, Philadelphia, PA 19148.
Care Cost Calculator: See Prices in Your Area
Nursing Home Data Explorer
Don’t Wait Too Long: 7 Red Flag Signs Your Parent Needs Assisted Living Now
The True Cost of Assisted Living in 2025 – And How Families Are Paying For It
Understanding Senior Living Costs: Pricing Models, Discounts & Financial Assistance


