Steelville Senior Living
Nursing Home, Assisted Living, Hospice Care, Memory Care & Respite Care · Steelville, MO
CMS overall rating Info CMS (the Centers for Medicare & Medicaid Services) is the federal agency that rates nursing home quality. Its Overall Rating runs from 1 to 5 stars, combining health inspections, staffing, and quality measures, with inspections weighted most heavily.

Steelville Senior Living

Nursing Home, Assisted Living, Hospice Care, Memory Care & Respite Care · Steelville, MO
CMS overall rating Info CMS (the Centers for Medicare & Medicaid Services) is the federal agency that rates nursing home quality. Its Overall Rating runs from 1 to 5 stars, combining health inspections, staffing, and quality measures, with inspections weighted most heavily.
Calculator: See prices in your area
Steelville Senior Living accepts Medicare, Medicaid, and private pay.

Overview of Steelville Senior Living

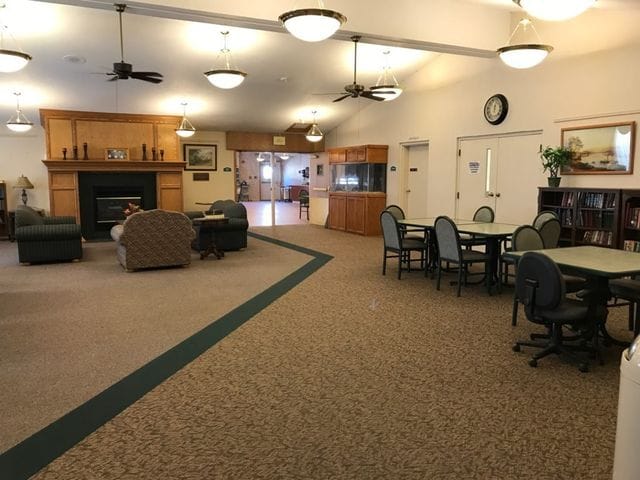
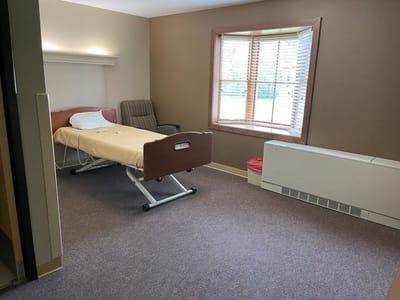
Administrator Ashley Drewel directs operations at Steelville Senior Living, a 93-bed nursing community located on North Spring Street in Steelville, Missouri. The facility keeps the setup simple for families by working with standard payment options such as private pay, Medicaid, and Medicare. Relatives dropping by for a visit will find a somewhat walkable neighborhood grid, so you can take care of a few small errands on foot, but a vehicle is still your best bet for general travel.

The building runs at a lower occupancy rate of 44 percent since it is a relatively new addition to the area, with residents staying an average of 142 days. This operational timeline shows that the staff splits their daily routine between short-term post-hospital therapy tracks and extended residential care. To keep up with regular clinical targets, the 24-hour shift schedule delivers an average of 3 hours and 49 minutes of direct nursing care per resident each day, utilizing a combined rotation of registered nurses, practical nurses, and aides.

State health department inspectors keep public records of how the building aligns with regular safety and licensing codes. Past evaluation summaries have noted a few procedural areas needing some adjustment, specifically focusing on kitchen food safety protocols, clinical infection control steps, daily staffing schedules, and medication management routines, keeping the total citation rate above zero.

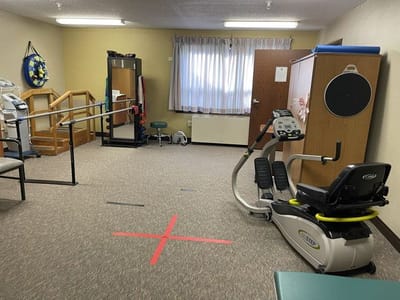
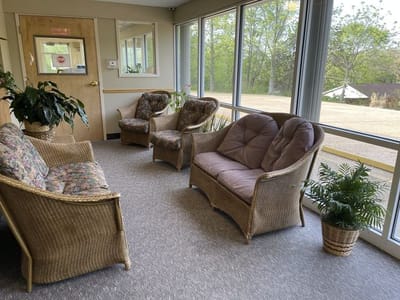
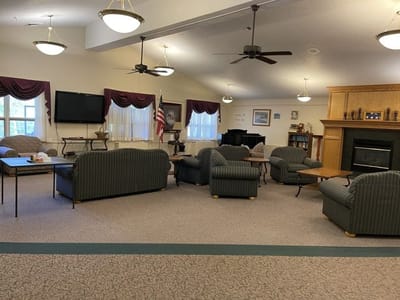
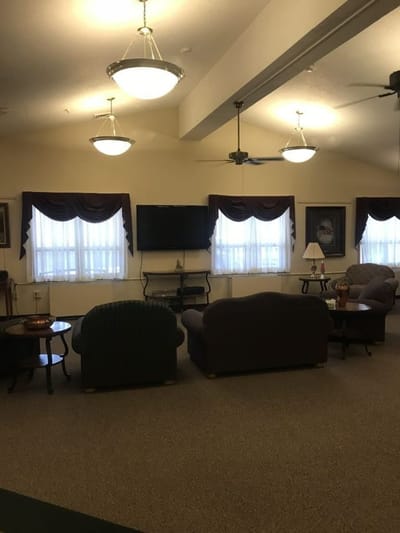
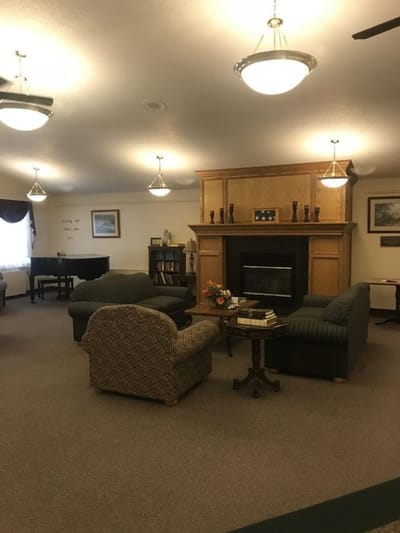
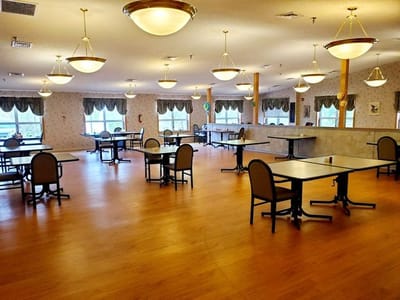
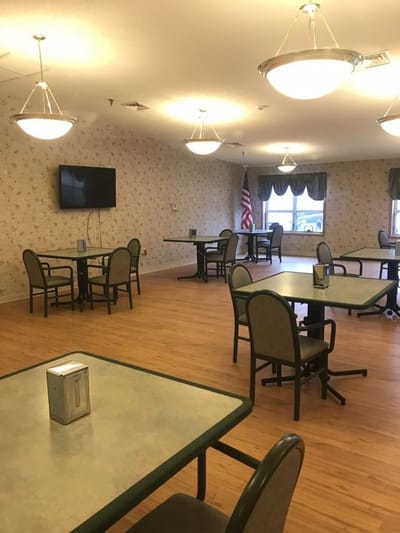
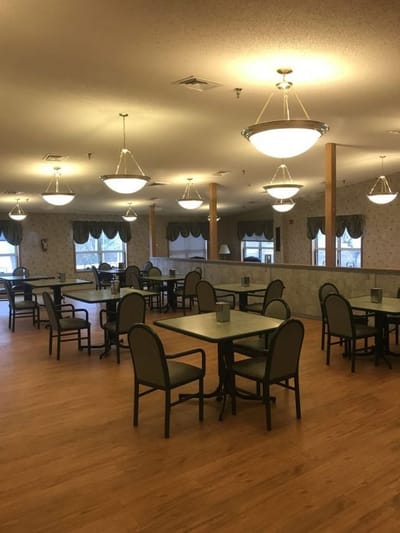
Prospective representatives can evaluate the on-site outpatient rehabilitation programs, therapy spaces, and independent activity rooms. The everyday routine features restaurant-style dining with menu choices planned by a dietitian, plus extras like building-wide Wi-Fi, local transportation, an internal beauty shop, and a private dining room for guests.

Quality ratings

Measured by Centers for Medicare & Medicaid Services (CMS)

Overall rating Info The Overall CMS Rating combines results from health inspections, staffing levels and quality measures. Health inspections carry the most weight. Staffing and quality scores can increase or decrease the final rating based on performance compared to state and national standards.
Health Inspection Info Based on the results of the facility's three most recent standard inspections and any complaint investigations. CMS reviews the number, scope, and severity of deficiencies, with more recent findings weighted more heavily.
Staffing Info Measures average nursing staff hours per resident per day, including Registered Nurses (RNs) and total nursing staff. Ratings are adjusted based on the level of care residents require and are compared to state and national benchmarks.
Quality Measures Info Based on clinical and physical health indicators reported to CMS, such as hospital readmissions, falls, pressure ulcers, and improvements in mobility. These measures reflect how well residents' health needs are being managed.

Staffing hours breakdown

Info Daily nursing hours per resident by staff type, reported to CMS. Higher is generally better — compare this facility to state and national averages to see where staffing stands.

Hours per resident per day — compared to state averages

Total nursing care / resident Info Total adjusted nursing hours per resident per day, combining RN, LPN, and aide time. CMS adjusts this for case-mix so facilities can be fairly compared.
3h 49m per day
Rank #127 / 282Nurse hours — State benchmarkedThis home is ranked 127th out of 282 homes in Missouri. Shows adjusted nurse hours per resident per day benchmarked to the Missouri average, with a ranking across 282 Missouri facilities. More hours mean more direct care. The national average is about 3.5 hrs; below 3.0 is a red flag.Rankings are based only on facilities in Missouri that report data for that category. Facilities without available data are excluded from the ranking.Click the rank badge to see the full State ranking.Click here to see the full State ranking.
vs avg

4 of 6 metrics below state avg

Standout metric Nurse Aide is +20% above state avg
Staff typeHours / Day / Residentvs state avg
Registered Nurse (RN) Info RNs hold the highest nursing license and can assess residents, interpret test results, and direct care plans. More RN hours per day often signals stronger clinical oversight and faster response to health changes. 15m per day ▼ 46% State avg: 28m per day · National avg: 41m per day
LPN / LVN Info Licensed Practical Nurses (LPNs) or Licensed Vocational Nurses (LVNs) deliver routine hands-on care — medication administration, wound dressing, and monitoring vital signs. They work under RN supervision and make up a large share of daily bedside care. 39m per day ▼ 4% State avg: 41m per day · National avg: 52m per day
Nurse Aide Info Certified Nurse Aides (CNAs) provide the most direct day-to-day assistance: bathing, dressing, feeding, and mobility. Nurse aide hours are typically the largest staffing category and directly affect residents' quality of life. 2h 47m per day ▲ 20% State avg: 2h 19m per day · National avg: 2h 20m per day
Weekend Total Nursing Info Combined nursing hours (RN + LPN + Nurse Aide) per resident per day on weekends. Staffing often drops on weekends — this figure reveals whether the facility maintains adequate coverage outside of weekday hours. 3h 26m per day ▲ 13% State avg: 3h 3m per day · National avg: 3h 26m per day
Physical Therapist Info Hours per resident per day provided by licensed Physical Therapists (PTs) or PT Assistants. PT services help residents recover mobility after injury or illness and are especially important for post-acute (short-stay) rehabilitation. 0m per day ▼ 100% State avg: 2m per day · National avg: 4m per day
Weekend RN Info Registered nurse hours specifically on weekends. Facilities sometimes reduce RN presence on Saturdays and Sundays — a low weekend RN figure compared to weekday hours can indicate reduced clinical oversight when most administrative staff are absent. 15m per day ▼ 24% State avg: 20m per day · National avg: 28m per day

Capacity and availability

Avg. Length of Stay
142 days
Bed community size
93-bed community Rank #215 / 454Bed count — State benchmarkedThis home is ranked 215th out of 454 homes in Missouri. Shows this facility's certified or reported bed count compared to other Missouri facilities. Larger communities may offer more amenities, programs, and on-site services for residents and families.Rankings are based only on facilities in Missouri that report data for that category. Facilities without available data are excluded from the ranking.Click the rank badge to see the full State ranking.Click here to see the full State ranking.
A larger shared setting that may offer more common spaces and organized community services.
Years in operation
1 year in operation Rank #98 / 209Years in operation — State benchmarkedThis home is ranked 98th out of 209 homes in Missouri. Shows how long this facility has been in operation compared to other Missouri facilities. Longer operating histories may benefit residents, families, and staff.Rankings are based only on facilities in Missouri that report data for that category. Facilities without available data are excluded from the ranking.Click the rank badge to see the full State ranking.Click here to see the full State ranking.
A newer community that may feature more recent facilities and programs.
Walk Score
Walk Score: 39 / 100 Rank #329 / 563Walk Score — State benchmarkedThis home is ranked 329th out of 563 homes in Missouri. Shows how walkable this facility's neighborhood is compared to the average Walk Score across Missouri facilities. Higher scores benefit residents, families, and staff.Rankings are based only on facilities in Missouri that report data for that category. Facilities without available data are excluded from the ranking.Click the rank badge to see the full State ranking.Click here to see the full State ranking.
Somewhat walkable. A few nearby services may be reachable on foot, but most trips require transportation.

About this community

License Details

Facility TypeSkilled Nursing Facility, Assisted Living Facility
StatusActive
IssuanceJanuary 17, 2025
ExpirationJanuary 16, 2027
CountyCrawford
License Number052439, 052440
CMS Certification Number265866
Certification TypeMedicare / Medicaid

Ownership & Operating Entity

Steelville Senior Living is legally operated by Steelville Senior Living Llc, and administered by Ashley Drewel.

Corporate EntitySTEELVILLE SENIOR LIVING, LLC
Owner NameSteelville Senior Living, LLC

Type Of Units

Skilled Nursing Facility
72 units
Assisted Living Facility
21 units
Total beds
93 units

Therapy & Rehabilitation

1 service
Rehabilitation Services

Memory & Specialized Care

1 service
Dedicated Alzheimer's Unit

Amenities & Lifestyle

Private Dining Room
Restaurant Style Dining
Wi-Fi & Tv
Transportation
Beauty Shop
Laundry & Housekeeping Service
Activities
Specific ProgramsOutpatient Rehabilitation, Engaging Social & Independent Activities

Contact Steelville Senior Living

Inspection History

In Missouri, the Department of Health and Senior Services, Division of Regulation and Licensure performs the inspections and unannounced surveys required for all long-term care providers.

Since 2018 · 8 years of data 88 deficiencies 16 inspections

Inspection Scorecard Info This scorecard compares key inspection, deficiency, and complaint metrics at this facility against the Missouri state average. Metrics rated ≥15% worse than average are highlighted in red; those ≥15% better are highlighted in green.

Since 2018 vs. Missouri state average
Overall vs. MO average 4 Worse Metrics worse than Missouri average:
• Total deficiencies (151% above)
• Deficiencies per year (150% above)
• Deficiencies per inspection (10% above)
• Total inspections (129% above)
0 Better No metrics in this bucket.
Latest Inspection October 17, 2025 Plan Of Correction

Deficiencies Info Deficiencies are formal regulatory issues recorded during state inspections.

This FacilityMO Averagevs. MO Avg
Total deficiencies Info Formal regulatory issues recorded by inspectors across all inspection types. 8835 This facility has 151% more total deficiencies than a typical Missouri assisted living residence (88 vs. MO avg 35).↑ 151% worse
Deficiencies per year Info Average deficiencies per year since 2018. 114.4 This facility has 150% more deficiencies per year than a typical Missouri assisted living residence (11 vs. MO avg 4.4).↑ 150% worse
Deficiencies per inspection Info Average deficiencies per inspection. 5.55 This facility has 10% more deficiencies per inspection than a typical Missouri assisted living residence (5.5 vs. MO avg 5).↑ 10% worse

Inspections Info State inspections evaluate whether the facility meets health and safety standards.

This FacilityMO Averagevs. MO Avg
Total inspections Info Combined count of all routine and focused inspections. Excludes complaint investigations. 167 This facility has 129% more total inspections than a typical Missouri assisted living residence (16 vs. MO avg 7).↑ 129% worse

Inspection Reports Summary Info An editor-reviewed summary of the themes and findings across this facility's recent inspection reports.

  • May 19, 2025 inspection found one deficiency for staff failing to perform proper hand hygiene to prevent cross-contamination in the kitchen during meal service.
  • August 16, 2024 inspection identified six deficiencies including inadequate RN coverage, expired medications, unsafe food storage temperatures, and multiple infection control failures during resident care.
  • August 17, 2023 annual inspection found no health deficiencies, indicating a temporary period of full compliance before later issues emerged.

Health Inspection History

Inspections since 2019
Total health inspections 6

State average N/A


Last Health inspection on May 2025

Total health citations
15 Rank #48 / 287Health citations — State benchmarkedThis home is ranked 48th out of 287 homes in Missouri. Shows this facility's total health deficiency citations benchmarked to the Missouri State average, with a ranking across all 287 MO facilities. Lower citation counts earn a better rank.Rankings are based only on facilities in Missouri that report data for that category. Facilities without available data are excluded from the ranking.Click the rank badge to see the full State ranking.Click here to see the full State ranking.

State average N/A

Citations per inspection
2.5 Rank #16 / 287Citations per inspection — State benchmarkedThis home is ranked 16th out of 287 homes in Missouri. Shows average deficiency citations per CMS inspection for this facility versus the Missouri mean across 287 facilities with citation data. Lower is better.Rankings are based only on facilities in Missouri that report data for that category. Facilities without available data are excluded from the ranking.Click the rank badge to see the full State ranking.Click here to see the full State ranking.

State average N/A


Health citations are formal notices following inspections when they fail to comply with safety and care standards.

12 of 15 citations resulted from standard inspections; and 3 of 15 resulted from complaint investigations.

Breakdown of citation severity (last 7 years)
Critical health citations
1
In line with State average

State average: N/A


Serious health citations
0
In line with State average

State average: N/A

1 critical citation State average: N/A

0 serious citations State average: N/A

13 moderate citations State average: N/A

1 minor citation State average: N/A
Citations history (last 7 years)
Nutrition moderate citation May 19, 2025
Corrected

Infection Control moderate citation Aug 16, 2024
Corrected

Nursing Services moderate citation Aug 16, 2024
Corrected

Nutrition moderate citation Aug 16, 2024
Corrected

Staffing Data

Reporting period: October 1 – December 31, 2025 (Q4 2025). Source: CMS Payroll-Based Journal report.

Total staff 85
Employees 76
Contractors 9
Staff to resident ratio 2.07 : 1
0% compared with State average

State average ratio: 0 : 0

Avg staff/day 22
Average shift 8.8 hours
0% compared with State average

State average: 0 hours

Total staff hours (quarter) 17,706

Nursing staff breakdown

Q4 2025 · Oct 1 – Dec 31 More info This data comes from the CMS Payroll-Based Journal report covering October 1 – December 31, 2025.
Registered Nurse

Manages medical care and health needs.

RN Staff Info All 6 RN Staff are full-time employees. No contractors work on this role. 6
Average shift length Info Average shift length. Calculated as total hours divided by days worked and average staff per day. 9.8 hours
Licensed Practical Nurse

Assists with medical care and medications.

LPN Staff Info 10 total: 9 full-time employees and 1 contractor. 10
Average shift length Info Average shift length. Calculated as total hours divided by days worked and average staff per day. 8.4 hours
Certified Nursing Assistant

Helps with daily care and mobility.

CNA Staff Info 21 total: 20 full-time employees and 1 contractor. 21
Average shift length Info Average shift length. Calculated as total hours divided by days worked and average staff per day. 9.9 hours

Contractor staffing

Q4 2025 · Oct 1 – Dec 31 More info This data comes from the CMS Payroll-Based Journal report covering October 1 – December 31, 2025.

Total hours from contractors

2.9%

516 contractor hours this quarter

Certified Nursing Assistant: 1 Licensed Practical Nurse: 1 Physical Therapy Aide: 1 Qualified Social Worker: 1 Speech Language Pathologist: 1 Medical Director: 1 Occupational Therapy Aide: 1 Physical Therapy Assistant: 1 Occupational Therapy Assistant: 1

Staff by category

Q4 2025 · Oct 1 – Dec 31 More info This data comes from the CMS Payroll-Based Journal report covering October 1 – December 31, 2025.
Nurse Aide in Training170174,50092100%9.5
Certified Nursing Assistant201214,48692100%9.9
Medication Aide/Technician9092,7449199%8.7
Licensed Practical Nurse91102,2219199%8.4
Registered Nurse6065895358%9.8
Other Dietary Services Staff3035656874%7.4
Mental Health Service Worker2025646773%7.9
RN Director of Nursing4045304751%8.2
Nurse Practitioner3034725964%8
Dietitian1014486065%7.5
Administrator2022162729%8
Physical Therapy Aide0111142325%4.9
Physical Therapy Assistant0111022325%4.4
Qualified Social Worker011451820%2.5
Occupational Therapy Aide0114189%5.1
Occupational Therapy Assistant0112989%3.6
Medical Director011221112%2
Speech Language Pathologist011191415%1.4
17 Nurse Aide in Training
% of Days 100%
21 Certified Nursing Assistant
% of Days 100%
9 Medication Aide/Technician
% of Days 99%
10 Licensed Practical Nurse
% of Days 99%
6 Registered Nurse
% of Days 58%
3 Other Dietary Services Staff
% of Days 74%
2 Mental Health Service Worker
% of Days 73%
4 RN Director of Nursing
% of Days 51%
3 Nurse Practitioner
% of Days 64%
1 Dietitian
% of Days 65%
2 Administrator
% of Days 29%
1 Physical Therapy Aide
% of Days 25%
1 Physical Therapy Assistant
% of Days 25%
1 Qualified Social Worker
% of Days 20%
1 Occupational Therapy Aide
% of Days 9%
1 Occupational Therapy Assistant
% of Days 9%
1 Medical Director
% of Days 12%
1 Speech Language Pathologist
% of Days 15%

Penalties and fines

Includes penalties issued in 2024

Federal penalties imposed by CMS for regulatory violations, including civil money penalties (fines) and denials of payment for new Medicare/Medicaid admissions.

Source: CMS Penalties Database (Data as of Jan 2026)

Total fines amount $88K Rank #260 / 289Federal fines — State benchmarkedThis home is ranked 260th out of 289 homes in Missouri. Shows this facility's cumulative CMS federal fine dollars versus the Missouri average among facilities with fines, and where it ranks among 289 facilities in the pool. Lower total dollars mean a better rank.Rankings are based only on facilities in Missouri that report data for that category. Facilities without available data are excluded from the ranking.Click the rank badge to see the full State ranking.Click here to see the full State ranking.
20% higher than State average

State average: $73K

Number of fines 1
59% fewer fines than State average

State average: 2.4

Payment Denials Info Serious action where Medicare and/or Medicaid temporarily stops payments for new residents until issues are fixed. 0
100% fewer payment denials than State average

State average: 0.7

Fines amount comparison
This facility $88K
State average $73K
Penalty History

Penalties are imposed by CMS for violations of federal nursing home regulations.

1 penalty in the past 3 years

Mar 14, 2024 · $88K

Civil Money Penalty Info Fines imposed for noncompliance, which can be assessed per day or per instance of violation. Mar 14, 2024
$88K

Last updated: Jan 2026

Quality of care over time

These measures show how residents usually do over time at this home, based on health outcomes and preventive care.

High-risk clinical events score Info A composite score based on pressure ulcers, falls with injury, weight loss, walking ability decline, and activities of daily living decline. 16.2
48% worse than State average

State average: 10.9

Functional decline score Info A composite score based on activities of daily living decline, walking ability decline, and incontinence. 30.6
57% worse than State average

State average: 19.5

Long-stay resident measures
Significantly below average State avg: 2.7 Info CMS star rating based on long-stay quality measure performance. 5 stars = significantly above average, 1 star = significantly below average.
Need for Help with Daily Activities Increased Info Percent of long-stay residents whose need for help with daily activities has increased 36.2%
83% worse than State average

State average: 19.8%

Walking Ability Worsened Info Percent of long-stay residents whose ability to move independently worsened 29.8%
45% worse than State average

State average: 20.6%

Low Risk Residents with Bowel/Bladder Incontinence Info Percent of low risk long-stay residents who lose control of their bowels or bladder 25.9%
43% worse than State average

State average: 18.1%

Falls with Major Injury Info Percent of long-stay residents experiencing one or more falls with major injury 9.4%
132% worse than State average

State average: 4.0%

High Risk Residents with Pressure Ulcers Info Percent of long-stay high risk residents with pressure ulcers 5.0%
In line with State average

State average: 5.0%

Urinary Tract Infection Info Percent of long-stay residents with a urinary tract infection 0.0%
100% better than State average

State average: 2.7%

Lost Too Much Weight Info Percent of long-stay residents who lose too much weight 0.8%
86% better than State average

State average: 5.6%

Depressive Symptoms Info Percent of long-stay residents who have depressive symptoms 1.3%
90% better than State average

State average: 12.8%

Antipsychotic Use Info Percent of long-stay residents who received an antipsychotic medication 39.3%
79% worse than State average

State average: 22.0%

Pneumococcal Vaccine Info Percent of long-stay residents assessed and appropriately given the pneumococcal vaccine 100.0%
17% better than State average

State average: 85.2%

Influenza Vaccine Info Percent of long-stay residents assessed and appropriately given the seasonal influenza vaccine 97.7%
7% better than State average

State average: 90.9%

Hospitalizations per 1,000 days Info Number of hospitalizations per 1,000 long-stay resident days. 1.47
29% better than State average

State average: 2.08

ED visits per 1,000 days Info Number of outpatient emergency department visits per 1,000 long-stay resident days. 4.15
77% worse than State average

State average: 2.35

Short-stay resident measures
Average State avg: 2.1 Info CMS star rating based on short-stay quality measure performance. 5 stars = much above average, 1 star = much below average.
Pneumococcal Vaccine Info Percent of short-stay residents assessed and appropriately given the pneumococcal vaccine 98.0%
47% better than State average

State average: 66.6%

Antipsychotic medication increase Info Percent of short-stay residents who newly received an antipsychotic medication 0.0%
100% better than State average

State average: 2.2%

Influenza Vaccine Info Percent of short-stay residents assessed and appropriately given the seasonal influenza vaccine 36.0%
43% worse than State average

State average: 63.5%

Re-hospitalized after SNF stay Info Percentage of short-stay residents who were re-hospitalized after their nursing home admission. 36.2%
43% worse than State average

State average: 25.3%

Emergency department visits Info Percentage of short-stay residents who had an outpatient emergency department visit. 8.6%
36% better than State average

State average: 13.4%

Falls with major injury Info Percentage of SNF residents who experience falls with major injury during their stay. 0.0%
100% better than State average

State average: 0.8%

Breakdown by payment type

Medicare

12% of new residents, usually for short-term rehab.

Typical stay 29 days

Private pay

35% of new residents, often for short stays.

Typical stay 2 - 3 months

Medicaid

53% of new residents, often for long-term daily care.

Typical stay 3 - 4 months

Facility Characteristics

Source: CMS Long-Term Care Facility Characteristics (Data as of Jan 2026)

Total residents 41
Medicare
3
7.3% of residents
Medicaid
30
73.2% of residents
Private pay or other
8
19.5% of residents

Finances and operations

Based on CMS SNF Cost Report for fiscal year ending in 12/2023.

For-profit
Operated by a single business entity.
Net patient revenue Info Net patient revenue — what the home actually collects for resident care, after contractual allowances, bad debt and discounts are subtracted from its gross charges (CMS cost report, Worksheet G-3). It covers resident care only; money the home earns from other sources is shown separately as "Other income."
$4.5M
Net patient income Info Net patient income: net patient revenue minus the home's total operating expenses. A positive figure means it earns more from resident care than it spends to deliver it; a negative figure means the opposite. It excludes non-operating "other income."
$61.2K
For-profit Operated by a single business entity.
Net patient revenue Info Net patient revenue — what the home actually collects for resident care, after contractual allowances, bad debt and discounts are subtracted from its gross charges (CMS cost report, Worksheet G-3). It covers resident care only; money the home earns from other sources is shown separately as "Other income."
$4.5M Rank #86 / 292Revenue — State benchmarkedThis home is ranked 86th out of 292 homes in Missouri. Shows this facility's annual revenue compared to the Missouri average. Higher revenue generally means more resources for staffing and capital — read alongside Payroll %.Rankings are based only on facilities in Missouri that report data for that category. Facilities without available data are excluded from the ranking.Click the rank badge to see the full State ranking.Click here to see the full State ranking.
Net patient income Info Net patient income: net patient revenue minus the home's total operating expenses. A positive figure means it earns more from resident care than it spends to deliver it; a negative figure means the opposite. It excludes non-operating "other income."
$61.2K
Other income Info Money the home earns outside of resident care — such as investments, grants, rentals and other non-operating sources (CMS cost report, Worksheet G-3). It is tracked separately from net patient revenue: it is not part of that figure, and it is not included in net patient income.
$190.0K
Payroll costs Info Staff salaries plus wage-related costs — benefits such as payroll taxes, health insurance and retirement — from the home's own accounting records (CMS cost report, Worksheet A). Contract or agency labor is counted separately, under other operating costs. Rank #216 / 292Payroll — State benchmarkedThis home is ranked 216th out of 292 homes in Missouri. Shows total annual staff payroll benchmarked to the Missouri average. Higher payroll investment relative to peers often signals better staffing and less reliance on cheaper contract labor.Rankings are based only on facilities in Missouri that report data for that category. Facilities without available data are excluded from the ranking.Click the rank badge to see the full State ranking.Click here to see the full State ranking.
$1.7M 38.3% of net patient revenue Info Payroll as a share of revenue: staff salaries and wage-related benefits divided by net patient revenue. A higher figure means more of each revenue dollar goes to staff pay. Rank #285 / 292Payroll % — State benchmarkedThis home is ranked 285th out of 292 homes in Missouri. Shows payroll as a percentage of revenue versus the Missouri average. Well-run Missouri facilities typically land around 60–71% — the top third Statewide. Below 25% may signal understaffing or heavy agency use — read with Staffing ratings.Rankings are based only on facilities in Missouri that report data for that category. Facilities without available data are excluded from the ranking.Click the rank badge to see the full State ranking.Click here to see the full State ranking.
Other operating costs Info Everything it costs to run the home apart from payroll — food, utilities, supplies, maintenance, contract labor and administration. Calculated as total operating expense minus payroll (staff salaries and wage-related benefits).
$2.7M
Total costs Info The home's total operating expense for the year — all the costs of running it, salaries included (CMS cost report, Worksheet G-3).
$4.4M

Who this home usually serves

TYPE OF STAY

Mostly long-term care residents

Most residents stay for extended periods and receive ongoing daily care.

Most new residents arrive under Medicaid (53% of admissions), and a typical Medicaid stay runs around 3 - 4 months.

Admissions
260 total

Coverage residents most often arrive under.

Medicare 12%
Private pay 35%
Medicaid 53%
Discharges
130 total

Coverage residents most often leave under.

Medicare 24%
Private pay 40%
Medicaid 36%

Places of interest near Steelville Senior Living

Address 0.0 miles from city center Info Estimated distance in miles from Steelville's city center to Steelville Senior Living's address, calculated via Google Maps.

Calculate Travel Distance to Steelville Senior Living

Add your location

Address

Compare Nursing Homes around the area

The information below is reported by the Missouri Department of Health and Senior Services, Division of Regulation and Licensure.

Steelville Senior Living
NH
AL
HC
MC
RC
Steelville -93 - 39 -
Breeze Park – Lutheran Senior Services
NH
AL
IL
MC
Weldon Spring -50 A+ 2 1 Bed / 2 Bed
John Knox Village
NH
AL
HC
IL
MC
RC
Lee's Summit -408 A+ 58 1 Bed / 2 Bed
Ignite Medical Resort Blue Springs
NH
PC
Blue Springs -90 - 68 -
Moore-Few Care Center
NH
HC
MC
PC
RC
- -108 - 39 Private Suites

Frequently Asked Questions about Steelville Senior Living

Is Steelville Senior Living in a walkable area?

Steelville Senior Living has a walk score of 39. Somewhat walkable. A few nearby services may be reachable on foot, but most trips require transportation.

What is the license number of Steelville Senior Living?

According to MO state health department records, Steelville Senior Living's license number is 052439, 052440.

When does Steelville Senior Living's license expire?

According to MO state health department records, Steelville Senior Living's license expires on January 16, 2027.

What is the occupancy rate at Steelville Senior Living?

Steelville Senior Living's occupancy is 58.0%.

Does Steelville Senior Living operate as a for-profit or non-profit?

Steelville Senior Living is registered as a for-profit in MO.

Who is the administrator of Steelville Senior Living?

Ashley Drewel is the administrator of Steelville Senior Living.

How many beds does Steelville Senior Living have?

Steelville Senior Living has 93 beds.

Guides for Better Senior Living

Care Cost Calculator: See Prices in Your Area

Nursing Home Data Explorer

Don’t Wait Too Long: 7 Red Flag Signs Your Parent Needs Assisted Living Now

The True Cost of Assisted Living in 2025 – And How Families Are Paying For It

Understanding Senior Living Costs: Pricing Models, Discounts & Financial Assistance