Stonemere Rehabilitation Center
Nursing Home · Frisco, TX
CMS overall rating Info The Overall CMS Rating is scored from 1 to 5 stars and combines results from health inspections, staffing levels, and quality measures. Health inspections carry the most weight. Staffing and quality scores can increase or decrease the final rating based on performance compared to state and national standards.

Stonemere Rehabilitation Center

Nursing Home · Frisco, TX
CMS overall rating Info The Overall CMS Rating is scored from 1 to 5 stars and combines results from health inspections, staffing levels, and quality measures. Health inspections carry the most weight. Staffing and quality scores can increase or decrease the final rating based on performance compared to state and national standards.
Calculator: See prices in your area
Stonemere Rehabilitation Center accepts Medicare, Medicaid, and private pay.

Overview of Stonemere Rehabilitation Center

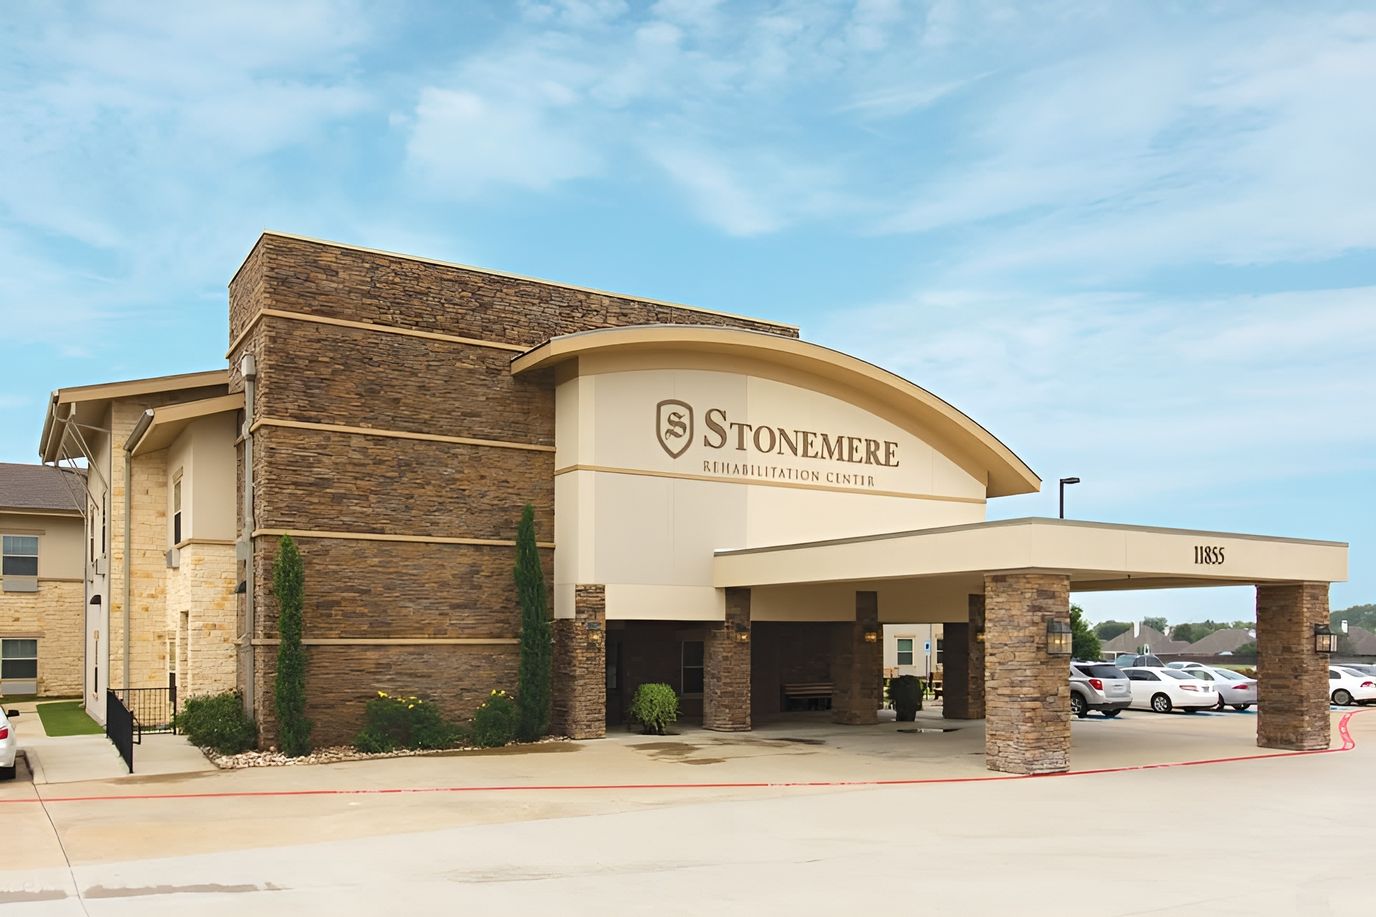
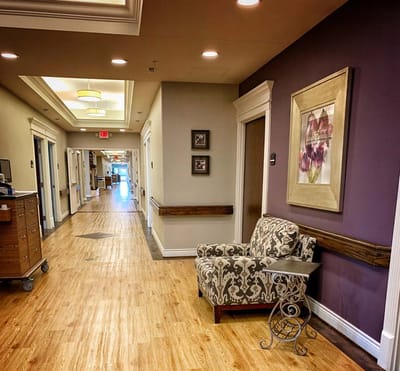
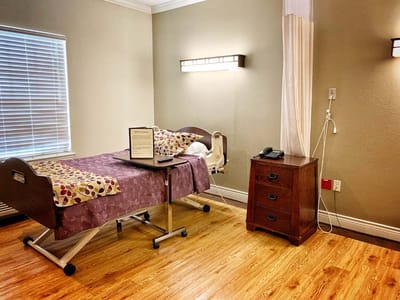
Stonemere Rehabilitation Center is a highly recognized nursing home in Frisco, TX, offering skilled nursing and rehabilitation. Here, older adults can feel at home, especially with its compassionate and welcoming environment. With 24-hour care, well-balanced meals, and therapy services, residents have a worry-free lifestyle. The community also works closely with residents to develop care plans based on their needs and habits.

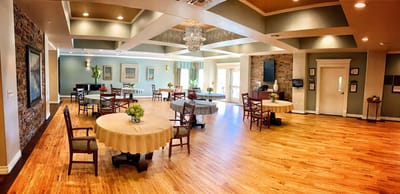
Fun events, light exercises, and recreational activities ensure residents can stay active and have fun. Spacious activity areas, a spa, and a beautiful courtyard are among the many amenities dedicated to residents’ leisure and wellness. Residents have a stress-free retirement, as it is conveniently located near a highway in Frisco’s neighborhood. Providing exceptional standards of care and a clean setting, this nursing home is one of the best options for senior living in Texas.

(469) 269-1000

Quality ratings

Measured by Centers for Medicare & Medicaid Services (CMS)

Overall rating Info The Overall CMS Rating combines results from health inspections, staffing levels and quality measures. Health inspections carry the most weight. Staffing and quality scores can increase or decrease the final rating based on performance compared to state and national standards.
▲ 78.9% Above TX avg. ▲ 78.9% Above TX avg.Click the badge to see the full State ranking.Click here to see the full State ranking.
Health Inspection Info Based on the results of the facility's three most recent standard inspections and any complaint investigations. CMS reviews the number, scope, and severity of deficiencies, with more recent findings weighted more heavily.
▲ 44.7% Above TX avg. ▲ 44.7% Above TX avg.Click the badge to see the full State ranking.Click here to see the full State ranking.
Staffing Info Measures average nursing staff hours per resident per day, including Registered Nurses (RNs) and total nursing staff. Ratings are adjusted based on the level of care residents require and are compared to state and national benchmarks.
▼ 5.7% Below TX avg. ▼ 5.7% Below TX avg.Click the badge to see the full State ranking.Click here to see the full State ranking.
Quality Measures Info Based on clinical and physical health indicators reported to CMS, such as hospital readmissions, falls, pressure ulcers, and improvements in mobility. These measures reflect how well residents' health needs are being managed.
▲ 33.2% Above TX avg. ▲ 33.2% Above TX avg.Click the badge to see the full State ranking.Click here to see the full State ranking.

Staffing hours breakdown

Info Daily nursing hours per resident by staff type, reported to CMS. Higher is generally better — compare this facility to state and national averages to see where staffing stands.

Hours per resident per day — compared to Texas state averages

Total nursing care / resident Info This home is ranked 167th out of 289 homes in Texas. Total adjusted nursing hours per resident per day, combining RN, LPN, and aide time. CMS adjusts this for case-mix so facilities can be fairly compared.
3h 24m per day
Rank #167 / 289Nurse hours — State benchmarkedThis home is ranked 167th out of 289 homes in Texas. Shows adjusted nurse hours per resident per day benchmarked to the Texas average, with a ranking across 289 Texas SNFs. More hours mean more direct care. The national average is about 3.5 hrs; below 3.0 is a red flag.Click the rank badge to see the full State ranking.Click here to see the full State ranking.
This facility Texas avg (3h 38m per day)
vs Texas avg
-6%

2 of 5 metrics below state avg

Standout metric LPN / LVN is +39% above state avg
Staff typeHours / Day / Residentvs state avg
Registered Nurse (RN) Info RNs hold the highest nursing license and can assess residents, interpret test results, and direct care plans. More RN hours per day often signals stronger clinical oversight and faster response to health changes. 24m per day ▼ 8% State avg: 26m per day · National avg: 41m per day
LPN / LVN Info Licensed Practical Nurses (LPNs) or Licensed Vocational Nurses (LVNs) deliver routine hands-on care — medication administration, wound dressing, and monitoring vital signs. They work under RN supervision and make up a large share of daily bedside care. 1h 19m per day ▲ 39% State avg: 57m per day · National avg: 52m per day
Nurse Aide Info Certified Nurse Aides (CNAs) provide the most direct day-to-day assistance: bathing, dressing, feeding, and mobility. Nurse aide hours are typically the largest staffing category and directly affect residents' quality of life. 1h 51m per day ▼ 8% State avg: 2h 1m per day · National avg: 2h 21m per day
Weekend Total Nursing Info Combined nursing hours (RN + LPN + Nurse Aide) per resident per day on weekends. Staffing often drops on weekends — this figure reveals whether the facility maintains adequate coverage outside of weekday hours. 3h 13m per day ▲ 8% State avg: 2h 59m per day · National avg: 3h 26m per day
Weekend RN Info Registered nurse hours specifically on weekends. Facilities sometimes reduce RN presence on Saturdays and Sundays — a low weekend RN figure compared to weekday hours can indicate reduced clinical oversight when most administrative staff are absent. 22m per day ▲ 5% State avg: 21m per day · National avg: 29m per day

Types of Care at Stonemere Rehabilitation Center

Nursing Home

Capacity and availability

This home usually has availability

Lower occupancy than the Texas average: 63.5%
Occupancy rate
62.3% Rank #175 / 297Occupancy rate — State benchmarkedThis home is ranked 175th out of 297 homes in Texas. Shows this facility's occupancy rate versus the Texas average, with its Statewide rank out of 297. Higher occupancy signals strong local demand and financial stability.Click the rank badge to see the full State ranking.Click here to see the full State ranking.
Avg. Length of Stay
59 days
Walk Score
Walk Score: 12 / 100
Car-dependent. Most errands require a car, with limited nearby walkable options.

Contact Stonemere Rehabilitation Center

Staffing Data

Reporting period: October 1 – December 31, 2025 (Q4 2025). Source: CMS Payroll-Based Journal report.

Total staff 93
Employees 92
Contractors 1
Staff to resident ratio 1.60:1
8% better than Texas average
Texas average ratio: 1.48:1 Texas average ratio: 1.48:1See full Texas ranking
Avg staff/day 45
Average shift 8.4 hours
0% compared with Texas average
Texas average: 8.1 hours Texas average shift: 8.1 hoursSee full Texas ranking
Total staff hours (quarter) 34,893

Nursing staff breakdown

Q4 2025 · Oct 1 – Dec 31 More info This data comes from the CMS Payroll-Based Journal report covering October 1 – December 31, 2025.
Registered Nurse

Manages medical care and health needs.

RN Staff 6
Average shift length Info Average shift length. Calculated as total hours divided by days worked and average staff per day. 10.2 hours

No contractors work on this role.

Licensed Practical Nurse

Assists with medical care and medications.

LPN Staff 21
Average shift length Info Average shift length. Calculated as total hours divided by days worked and average staff per day. 7.9 hours

No contractors work on this role.

Certified Nursing Assistant

Helps with daily care and mobility.

CNA Staff 39
Average shift length Info Average shift length. Calculated as total hours divided by days worked and average staff per day. 8.3 hours

No contractors work on this role.

Contractor staffing

Q4 2025 · Oct 1 – Dec 31 More info This data comes from the CMS Payroll-Based Journal report covering October 1 – December 31, 2025.

Total hours from contractors

0%

6 contractor hours this quarter

Clinical Nurse Specialist: 1

Staff by category

Q4 2025 · Oct 1 – Dec 31 More info This data comes from the CMS Payroll-Based Journal report covering October 1 – December 31, 2025.
Certified Nursing Assistant3903913,05392100%8.3
Licensed Practical Nurse210218,88792100%7.9
Physical Therapist8083,30492100%8.4
RN Director of Nursing5052,4458997%8.7
Registered Nurse6062,35692100%10.2
Medication Aide/Technician6061,84292100%9.4
Dietitian1015256874%7.7
Dental Services Staff1015206470%8.1
Nurse Practitioner1015126470%8
Administrator1014886166%8
Mental Health Service Worker1014725964%8
Other Dietary Services Staff1012804751%6
Occupational Therapy Aide1012042527%8.2
Clinical Nurse Specialist011667%1
39 Certified Nursing Assistant
% of Days 100%
21 Licensed Practical Nurse
% of Days 100%
8 Physical Therapist
% of Days 100%
5 RN Director of Nursing
% of Days 97%
6 Registered Nurse
% of Days 100%
6 Medication Aide/Technician
% of Days 100%
1 Dietitian
% of Days 74%
1 Dental Services Staff
% of Days 70%
1 Nurse Practitioner
% of Days 70%
1 Administrator
% of Days 66%
1 Mental Health Service Worker
% of Days 64%
1 Other Dietary Services Staff
% of Days 51%
1 Occupational Therapy Aide
% of Days 27%
1 Clinical Nurse Specialist
% of Days 7%

Penalties and fines

Federal penalties imposed by CMS for regulatory violations, including civil money penalties (fines) and denials of payment for new Medicare/Medicaid admissions.

Source: CMS Penalties Database

No penalties in the past 3 years

No civil money penalties or payment denials were reported in the last 3 years.

Quality of care over time

These measures show how residents usually do over time at this home, based on health outcomes and preventive care.

High-risk clinical events score Info A composite score based on pressure ulcers, falls with injury, weight loss, walking ability decline, and activities of daily living decline. 11.8
37% worse than Texas average

Texas average: 8.6

Functional decline score Info A composite score based on activities of daily living decline, walking ability decline, and incontinence. 25.5
59% worse than Texas average

Texas average: 16.0

Long-stay resident measures
Below average Info CMS star rating based on long-stay quality measure performance. 5 stars = significantly above average, 1 star = significantly below average.
Need for Help with Daily Activities Increased Info Percent of long-stay residents whose need for help with daily activities has increased 19.3%
20% worse than Texas average

Texas average: 16.2%

Walking Ability Worsened Info Percent of long-stay residents whose ability to move independently worsened 32.7%
101% worse than Texas average

Texas average: 16.2%

Low Risk Residents with Bowel/Bladder Incontinence Info Percent of low risk long-stay residents who lose control of their bowels or bladder 24.5%
57% worse than Texas average

Texas average: 15.7%

Falls with Major Injury Info Percent of long-stay residents experiencing one or more falls with major injury 1.4%
55% better than Texas average

Texas average: 3.2%

High Risk Residents with Pressure Ulcers Info Percent of long-stay high risk residents with pressure ulcers 5.4%
23% worse than Texas average

Texas average: 4.4%

Urinary Tract Infection Info Percent of long-stay residents with a urinary tract infection 2.0%
144% worse than Texas average

Texas average: 0.8%

Lost Too Much Weight Info Percent of long-stay residents who lose too much weight 0.0%
100% better than Texas average

Texas average: 3.5%

Depressive Symptoms Info Percent of long-stay residents who have depressive symptoms 0.0%
100% better than Texas average

Texas average: 2.9%

Antipsychotic Use Info Percent of long-stay residents who received an antipsychotic medication 6.9%
12% better than Texas average

Texas average: 7.9%

Pneumococcal Vaccine Info Percent of long-stay residents assessed and appropriately given the pneumococcal vaccine 100.0%
In line with Texas average

Texas average: 97.3%

Influenza Vaccine Info Percent of long-stay residents assessed and appropriately given the seasonal influenza vaccine 100.0%
In line with Texas average

Texas average: 97.9%

Hospitalizations per 1,000 days Info Number of hospitalizations per 1,000 long-stay resident days. 2.41
13% worse than Texas average

Texas average: 2.13

ED visits per 1,000 days Info Number of outpatient emergency department visits per 1,000 long-stay resident days. 1.05
49% better than Texas average

Texas average: 2.07

Short-stay resident measures
Significantly above average Info CMS star rating based on short-stay quality measure performance. 5 stars = much above average, 1 star = much below average.
Pneumococcal Vaccine Info Percent of short-stay residents assessed and appropriately given the pneumococcal vaccine 100.0%
11% better than Texas average

Texas average: 90.4%

Antipsychotic medication increase Info Percent of short-stay residents who newly received an antipsychotic medication 0.2%
83% better than Texas average

Texas average: 1.4%

Influenza Vaccine Info Percent of short-stay residents assessed and appropriately given the seasonal influenza vaccine 98.3%
12% better than Texas average

Texas average: 88.0%

Re-hospitalized after SNF stay Info Percentage of short-stay residents who were re-hospitalized after their nursing home admission. 22.5%
13% better than Texas average

Texas average: 25.9%

Emergency department visits Info Percentage of short-stay residents who had an outpatient emergency department visit. 6.0%
50% better than Texas average

Texas average: 12.0%

Falls with major injury Info Percentage of SNF residents who experience falls with major injury during their stay. 0.5%
40% better than Texas average

Texas average: 0.8%

Ability to care for self at discharge Info Percentage of residents at or above expected ability to care for themselves at discharge. 63.8%
19% better than Texas average

Texas average: 53.7%

Successful return to home or community Info Rate of successful return to home or community from a skilled nursing facility. 59.0%
17% better than Texas average

Texas average: 50.6%

Breakdown by payment type

Medicare

47% of new residents, usually for short-term rehab.

Typical stay 1 - 2 months

Private pay

29% of new residents, often for short stays.

Typical stay 1 - 2 months

Medicaid

23% of new residents, often for long-term daily care.

Typical stay 4 - 5 months

Facility Characteristics

Source: CMS Long-Term Care Facility Characteristics (Data as of Jan 2026)

Total residents 58
Medicare
25
43.1% of residents
Medicaid
33
56.9% of residents
Programs & Services
Residents Group

Residents meet regularly to discuss policies, care quality, and activities

Nurse Aide Training

State-approved Nurse Aide Training and Competency Evaluation Program on-site

Active Resident Council

Organized group of residents that meets regularly to discuss facility policies, quality of life, and activities.

Finances and operations

Privately-owned community
Operated by a partnership between two or more business owners.
Home revenue
$9.9M
Profit
$179.7K
Privately-owned community Operated by a partnership between two or more business owners.
Home revenue
$9.9M Rank #178 / 297Revenue — State benchmarkedThis home is ranked 178th out of 297 homes in Texas. Shows this facility's annual revenue compared to the Texas SNF average. Higher revenue generally means more resources for staffing and capital — read alongside Payroll %.Click the rank badge to see the full State ranking.Click here to see the full State ranking.
Profit
$179.7K
Payroll costs Info The portion of the home's budget spent on staff, including nurses, caregivers, and other employees who support care and operations. Rank #213 / 297Payroll — State benchmarkedThis home is ranked 213th out of 297 homes in Texas. Shows total annual staff payroll benchmarked to the Texas average. Higher payroll investment relative to peers often signals better staffing and less reliance on cheaper contract labor.Click the rank badge to see the full State ranking.Click here to see the full State ranking.
$4.1M
42.1% of revenue Rank #203 / 297Payroll % — State benchmarkedThis home is ranked 203rd out of 297 homes in Texas. Shows payroll as a percentage of revenue versus the Texas average. Well-run Texas SNFs typically land around 51–63% — the top third Statewide. Below 25% may signal understaffing or heavy agency use — read with Staffing ratings.Click the rank badge to see the full State ranking.Click here to see the full State ranking.
Other operating costs Info All remaining costs needed to run the home, such as food, utilities, building maintenance, supplies and administrative expenses.
$5.5M
Total costs $9.7M

What does this home offer?

Housing options icon

Housing Options: Private Rooms

Building type icon
Building type icon

Building Type: 2-story

Dining services icon

Dining Services

Housekeeping icon
Housekeeping icon

Housekeeping Services

Social and recreational activities icon

Social and Recreational Activities

On-site medical care and health services icon

On-site Medical Care and Health Services

Rehabilitative support icon

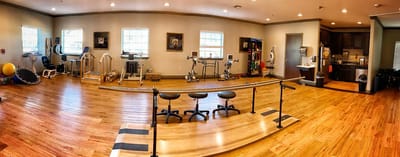
Rehabilitative Support

Beauty services icon

Beauty Services

Who this home usually serves

TYPE OF STAY

Mostly short-term rehab stays

Most residents typically stay for a few weeks or months before returning home or moving on.

Places of interest near Stonemere Rehabilitation Center

Address 5.9 miles from city center Info Estimated distance in miles from Frisco's city center to Stonemere Rehabilitation Center's address, calculated via Google Maps.

Calculate Travel Distance to Stonemere Rehabilitation Center

Add your location

Address

Financial Assistance for
Nursing Home in Texas

Stonemere Rehabilitation Center is located in Frisco, Texas.
Here are the financial assistance programs available to residents in Texas.

Get Financial aid guidance

Community Care for the Aged and Disabled (CCAD)

TX Medicaid CCAD

Age 65+ or disabled
General Texas resident, Medicaid-eligible, care need (not always nursing home level).
Income Limits (2025) ~$2,829/month 300% FBR, individual
Asset Limits $2,000 (individual), $3,000 (couple).
TX

Large state; rural access challenges.

Benefits
Personal care (5-7 hours/day) Respite (240 hours/year) Adult day care (~$60/day) Home aides

Texas Community Care Services

TX CCS

Age 60+
General Texas resident, at risk of decline.
Income Limits ~$2,000/month individual, varies
Asset Limits $5,000 individual
TX

Limited funding; high demand in urban areas.

Benefits
In-home care (3-5 hours/week) Respite (up to 10 days/year) Transportation (~5 trips/month)

Area Agency on Aging (AAA) Services

Texas AAA Services

Age 60+
General TX resident; no income/asset limits.
Income Limits (2025) None; donations encouraged.
Asset Limits Not assessed.
TX

28 AAAs; includes Meals on Wheels in some areas.

Benefits
Meals (~$5-$7/meal) Transportation Homemaker services (~4 hours/week) Respite (~5 days/year) Legal aid

Medicare Savings Program (MSP)

Texas Medicare Savings Program

Age 65+ or disabled
General TX resident, Medicare Part A/B.
Income Limits (2025) ~$2,510/month (QMB), ~$3,380/month (SLMB), ~$3,598/month (QI)—individual.
Asset Limits $9,430 (individual), $14,130 (couple).
TX

Includes Extra Help for Part D; no waitlist.

Benefits
Covers Part B premiums ($174.70/month) Deductibles ($240/year) Copays (~20%)

Family Caregiver Support Program (FCSP)

Texas Family Caregiver Support Program

Age
General Caregivers of 60+ needing care or 55+ caregivers of others; TX resident; 2+ ADLs.
Income Limits (2025) No strict cap; prioritizes low-income ~$24,980/year
Asset Limits Not assessed.
TX

High rural demand; includes grandparent caregivers.

Benefits
Respite (4-6 hours/week or 5 days/year) Adult day care ($60/day) Training Supplies (~$500/year)

VA Aid and Attendance (A&A) and Housebound Benefits

Texas VA Aid and Attendance/Housebound

Age 65+ or disabled veteran/spouse
General TX resident, wartime service, ADL help (A&A) or homebound.
Income Limits (2025) Net income < ~$1,984/month (veteran with dependent, A&A); pension offsets income.
Asset Limits ~$155,356 net worth
TX

High veteran population; supports rural/urban needs.

Benefits
Cash (~$1,433-$2,642/month veteran, ~$951-$1,318 spouse) for care costs

Property Tax Exemption for Seniors

Texas Senior Property Tax Exemption

Age 65+
General TX resident, homeowner (homestead).
Income Limits (2025) None; tax-based eligibility.
Asset Limits Not assessed.
TX

$25,000+ exemption; optional freeze in some counties; saves ~$500-$1,000/year.

Benefits
Tax exemption or freeze (~$500-$1,000/year savings)

Senior Farmers’ Market Nutrition Program (SFMNP)

Texas SFMNP

Age 60+
General TX resident, low-income.
Income Limits (2025) ~$2,322/month 185% FPL
Asset Limits Not assessed.
TX

Vouchers (~$50/season); serves ~20,000 via 28 AAAs.

Benefits
Vouchers (~$50/season) for produce at farmers’ markets

Compare Nursing Home around Frisco

The information below is reported by the Texas Health and Human Services Commission.

4 facilities compared · CMS & TX Dept. of Health data

Filter by care type
Victoria Gardens of Frisco
NH

Nursing Home Licensed facility providing 24/7 skilled nursing care for residents with complex, ongoing medical needs. Staffed by RNs, LPNs, and CNAs. Inspected and star-rated annually by CMS. Accepts Medicare (short-term rehab) and Medicaid (long-term care).

MC

Memory Care Secured, specialized care for people living with Alzheimer's or dementia. Staff trained in cognitive impairment, with higher staff-to-resident ratios and an environment designed to reduce confusion and wandering risk.

RC

Respite Care Short-term temporary care — days to weeks — to give family caregivers a break. Full care provided during the stay. Often used after hospitalization or to trial a facility before a permanent placement decision.

Frisco (Preston Vineyards)118 60.8% -4%3.43 -25%-6%$23.5k181.8276 44 Steven Boulware Family Investments LLC$11.0M$4.7M42.6%675811
Stonemere Rehabilitation Center
NH

Nursing Home Licensed facility providing 24/7 skilled nursing care for residents with complex, ongoing medical needs. Staffed by RNs, LPNs, and CNAs. Inspected and star-rated annually by CMS. Accepts Medicare (short-term rehab) and Medicaid (long-term care).

Frisco136 62.3% -2%3.40 -15%-6%$0183.6-89 12 Stonemere Rehabilitation Center LLC$9.9M$4.1M42.1%676352
Prairie Estates
NH

Nursing Home Licensed facility providing 24/7 skilled nursing care for residents with complex, ongoing medical needs. Staffed by RNs, LPNs, and CNAs. Inspected and star-rated annually by CMS. Accepts Medicare (short-term rehab) and Medicaid (long-term care).

Frisco (Meadow Creek)180 79.6% +25%- +113%-$24.6k202.92144 22 Sutton Health Care Center Ltd Co$16.9M$8.0M47.1%676145
Baybrooke Village Care & Rehab Center
NH

Nursing Home Licensed facility providing 24/7 skilled nursing care for residents with complex, ongoing medical needs. Staffed by RNs, LPNs, and CNAs. Inspected and star-rated annually by CMS. Accepts Medicare (short-term rehab) and Medicaid (long-term care).

RC

Respite Care Short-term temporary care — days to weeks — to give family caregivers a break. Full care provided during the stay. Often used after hospitalization or to trial a facility before a permanent placement decision.

Mckinney128 70.7% +11%3.50 +44%-4%$15.6k292.9394 33 Pf Baybrooke Snf Ops, LLC$14.4M$5.2M36.2%676096

Frequently Asked Questions about Stonemere Rehabilitation Center

Is Stonemere Rehabilitation Center in a walkable area?

Stonemere Rehabilitation Center has a walk score of 12. Car-dependent. Most errands require a car, with limited nearby walkable options.

What is the address of Stonemere Rehabilitation Center?

Stonemere Rehabilitation Center is located at 11855 Lebanon Rd, Frisco, TX 75035.

What is the phone number of Stonemere Rehabilitation Center?

(469) 269-1000 will put you in contact with the team at Stonemere Rehabilitation Center.

Is Stonemere Rehabilitation Center Medicare or Medicaid certified?

Yes — Stonemere Rehabilitation Center is a CMS-certified provider of Medicare and Medicaid.

Guides for Better Senior Living

Care Cost Calculator: See Prices in Your Area

Nursing Home Data Explorer

Don’t Wait Too Long: 7 Red Flag Signs Your Parent Needs Assisted Living Now

The True Cost of Assisted Living in 2025 – And How Families Are Paying For It

Understanding Senior Living Costs: Pricing Models, Discounts & Financial Assistance

Explore Open Rooms
1 Contact details
2 What type of senior care service are you looking for?
3 What budget do you have in mind for senior care?
4 How soon do you need to find care?
5 Additional details

Thank you for your interest!

Our team will be in touch shortly to help with next steps.