

Total health inspections
4
Massachusetts average 4.5
Last Health inspection on Jun 2025

We arrange tours, appointments, and even moving support so you don’t have to


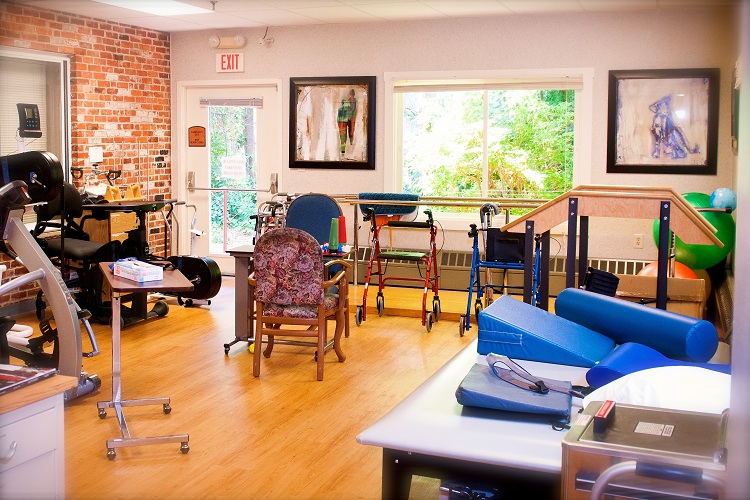

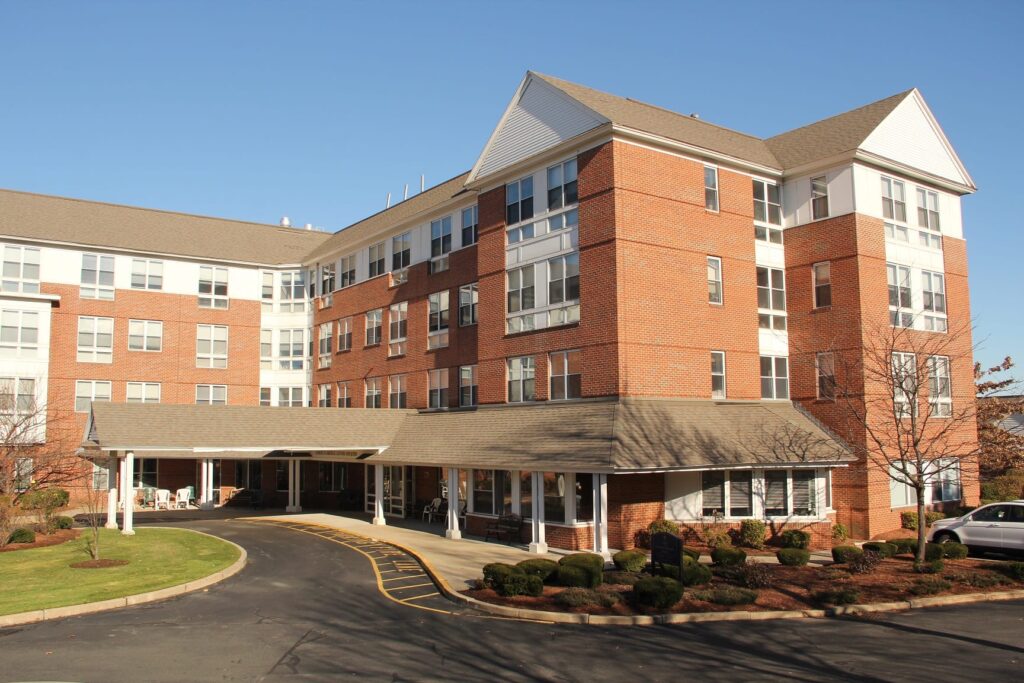
Sudbury Pines Extended Care is a family-owned and operated care home in Sudbury, MA, offering a relaxing environment for short-term rehabilitation and long-term care. They offer the services of a large skilled nursing community in a serene and intimate environment that caters to residents’ unique needs and preferences. They help residents maximize their abilities by providing them tailored physical, occupational, and speech therapies, alongside a well-equipped gym.
With the help of their dedicated activities and recreational personnel, residents have access to an array of enriching activities and programs that nurture their overall well-being. Three delicious and healthy meals are also served daily with flexible dining options to accommodate residents’ preferences. Here, residents enjoy a combination of comfort, quality care, and enriching experiences in a cozy and supportive environment.
 Official CMS rating based on health inspections, staffing and quality measures.
Official CMS rating based on deficiencies found during state health inspections.
Official CMS rating based on nurse staffing hours per resident per day.
Official CMS rating based on clinical outcomes for residents.
Average daily nursing hours per resident (adjusted for acuity). Higher values indicate more nursing time per resident.
Hours of care per resident per day, broken down by staff type. Data from CMS Medicare.
Registered nurse hours per resident per day.
Licensed Practical Nurse / Licensed Vocational Nurse hours per resident per day.
Nurse aide hours per resident per day.
Total number of nurse staff hours per resident per day on weekends.
Physical therapist staff hours per resident per day.
Registered nurse hours per resident per day on weekends.
Official CMS rating based on health inspections, staffing and quality measures.
Official CMS rating based on deficiencies found during state health inspections.
Official CMS rating based on nurse staffing hours per resident per day.
Official CMS rating based on clinical outcomes for residents.
Average daily nursing hours per resident (adjusted for acuity). Higher values indicate more nursing time per resident.
Hours of care per resident per day, broken down by staff type. Data from CMS Medicare.
Registered nurse hours per resident per day.
Licensed Practical Nurse / Licensed Vocational Nurse hours per resident per day.
Nurse aide hours per resident per day.
Total number of nurse staff hours per resident per day on weekends.
Physical therapist staff hours per resident per day.
Registered nurse hours per resident per day on weekends.
May offer a more intimate, personalized care environment.
Occupancy is moderate, suggesting balanced demand.
Most residents typically stay for a few weeks or months before returning home or moving on.
70% of new residents, usually for short-term rehab.
11% of new residents, often for short stays.
19% of new residents, often for long-term daily care.
The portion of the home's budget spent on staff, including nurses, caregivers, and other employees who support care and operations.
All remaining costs needed to run the home, such as food, utilities, building maintenance, supplies and administrative expenses.
Key information about the people who lead and staff this community.
Accept Medicaid: Yes
Housing Options: Private / Semi-Private Rooms
Building Type: Single-story
Dining Services
Beauty Services
Recreational Activities
Exercise Programs
Nursing Home 24/7 care needed
Care Homes
Memory Care Specialized care for those with Memory Loss, Alzheimer's, or dementia, ensuring safety and support.
Nursing Home 24/7 care needed
Care Homes
Nursing Home 24/7 care needed
Care Homes
Hospice Care
Assisted Living For seniors needing help with daily tasks but not full-time nursing.
Care Homes
Memory Care Specialized care for those with Memory Loss, Alzheimer's, or dementia, ensuring safety and support.
Respite Care
Care Homes
Independent Living For self-sufficient seniors seeking community and minimal assistance.
 CareOne at Concord
  The Leonard Florence Center
 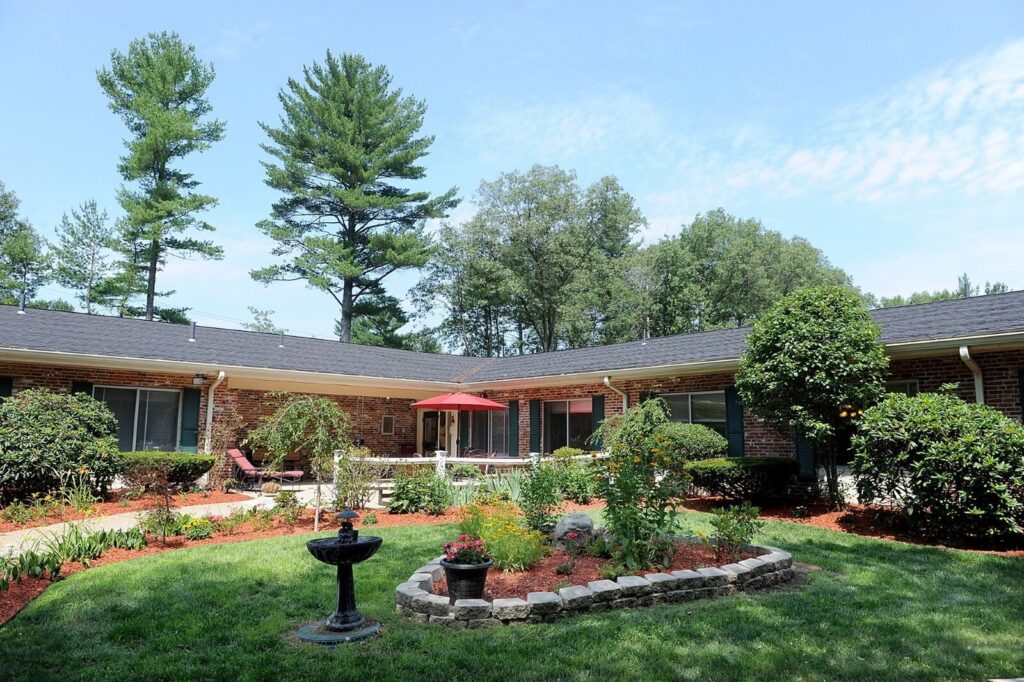 Sudbury Pines Extended Care
![]() 2.3 miles from city center
2.3 miles from city center
![]() 642 Boston Post Rd, Sudbury, MA 01776
642 Boston Post Rd, Sudbury, MA 01776
Add your location
Source: CMS Payroll-Based Journal (Q2 2025)
| Role ⓘ | Count ⓘ | Avg Shift (hrs) ⓘ | Uses Contractors? ⓘ |
|---|---|---|---|
| Registered Nurse | 7 | 6.6 | No |
| Licensed Practical Nurse | 12 | 8 | No |
| Certified Nursing Assistant | 63 | 7.6 | Yes |
| Role ⓘ | Employees ⓘ | Contractors ⓘ | Total Staff ⓘ | Total Hours ⓘ | Days Worked ⓘ | % of Days ⓘ | Avg Shift (hrs) ⓘ |
|---|---|---|---|---|---|---|---|
| Certified Nursing Assistant | 60 | 3 | 63 | 20,279 | 91 | 100% | 7.6 |
| Licensed Practical Nurse | 12 | 0 | 12 | 5,418 | 91 | 100% | 8 |
| Registered Nurse | 7 | 0 | 7 | 2,209 | 91 | 100% | 6.6 |
| Nurse Practitioner | 2 | 0 | 2 | 844 | 67 | 74% | 6.8 |
| Physical Therapy Aide | 1 | 2 | 3 | 723 | 66 | 73% | 6.1 |
| Mental Health Service Worker | 3 | 1 | 4 | 704 | 63 | 69% | 6.9 |
| RN Director of Nursing | 2 | 0 | 2 | 664 | 64 | 70% | 5.5 |
| Administrator | 1 | 0 | 1 | 480 | 64 | 70% | 7.5 |
| Respiratory Therapy Technician | 0 | 3 | 3 | 305 | 60 | 66% | 5 |
| Clinical Nurse Specialist | 1 | 0 | 1 | 248 | 26 | 29% | 9.5 |
| Physical Therapist | 0 | 1 | 1 | 209 | 52 | 57% | 4 |
| Occupational Therapy Aide | 0 | 1 | 1 | 152 | 29 | 32% | 5.3 |
| Speech Language Pathologist | 0 | 2 | 2 | 126 | 24 | 26% | 5 |
| Medical Director | 1 | 0 | 1 | 98 | 13 | 14% | 7.5 |
| Physical Therapy Assistant | 0 | 1 | 1 | 96 | 35 | 38% | 2.7 |
| Dietitian | 1 | 0 | 1 | 74 | 59 | 65% | 1.3 |
| Physician Assistant | 0 | 1 | 1 | 69 | 12 | 13% | 5.7 |
| Diagnostic X-ray Services Staff | 0 | 1 | 1 | 61 | 11 | 12% | 5.5 |
| Qualified Social Worker | 0 | 2 | 2 | 57 | 22 | 24% | 2.6 |
| Occupational Therapy Assistant | 0 | 1 | 1 | 42 | 7 | 8% | 6 |
| Dental Services Staff | 1 | 0 | 1 | 8 | 13 | 14% | 0.6 |
Massachusetts average 4.5
Last Health inspection on Jun 2025
Health citations are formal notices following inspections when they fail to comply with safety and care standards.
37 of 38 citations resulted from standard inspections; and 1 of 38 resulted from complaint investigations.
Massachusetts average: 0.3
Massachusetts average: 1.5
Data sourced from CMS Health Deficiencies reports. Citation severity codes range from A (least serious) to L (most serious). Immediate Jeopardy (J-L) citations indicate situations where the facility's noncompliance has placed residents at risk of death or serious harm.
Source: CMS Long-Term Care Facility Characteristics (Data as of Jan 2026)
Active councils help families stay involved in care decisions and facility operations.
These measures show how residents usually do over time at this home, based on health outcomes and preventive care.
Massachusetts average: 10.2
Massachusetts average: 20.0
Massachusetts average: 18.7%
Massachusetts average: 19.3%
Massachusetts average: 22.1%
Massachusetts average: 3.6%
Massachusetts average: 4.7%
Massachusetts average: 2.1%
Massachusetts average: 5.2%
Massachusetts average: 10.7%
Massachusetts average: 20.3%
Massachusetts average: 91.9%
Massachusetts average: 94.8%
Massachusetts average: 1.86
Massachusetts average: 1.54
Massachusetts average: 76.7%
Massachusetts average: 0.8%
Quality measures are calculated from Minimum Data Set (MDS) assessments. For most measures, lower percentages indicate better care quality.
Historical financial and operational data for Sudbury Pines Extended Care based on CMS SNF Cost Reports.
Loading trend charts...
Care Cost Calculator: See Prices in Your Area
Nursing Home Data Explorer
Don’t Wait Too Long: 7 Red Flag Signs Your Parent Needs Assisted Living Now
The True Cost of Assisted Living in 2025 – And How Families Are Paying For It
Understanding Senior Living Costs: Pricing Models, Discounts & Financial Assistance

We help families find affordable senior communities and unlock same day discounts, Medicaid, and Medicare options tailored to your needs.
Contact us Today
Touring a community? Use this expert-backed checklist to stay organized, ask the right questions, and find the perfect fit.
We'll send you a PDF version of the touring checklist.


