Sudbury Pines Extended Care
Nursing Home, Hospice Care, Memory Care & Respite Care · Sudbury, MA
CMS overall rating Info CMS (the Centers for Medicare & Medicaid Services) is the federal agency that rates nursing home quality. Its Overall Rating runs from 1 to 5 stars, combining health inspections, staffing, and quality measures, with inspections weighted most heavily.

Sudbury Pines Extended Care

Nursing Home, Hospice Care, Memory Care & Respite Care · Sudbury, MA
CMS overall rating Info CMS (the Centers for Medicare & Medicaid Services) is the federal agency that rates nursing home quality. Its Overall Rating runs from 1 to 5 stars, combining health inspections, staffing, and quality measures, with inspections weighted most heavily.
Calculator: See prices in your area
Sudbury Pines Extended Care accepts Medicare, Medicaid, and private pay.

Overview of Sudbury Pines Extended Care

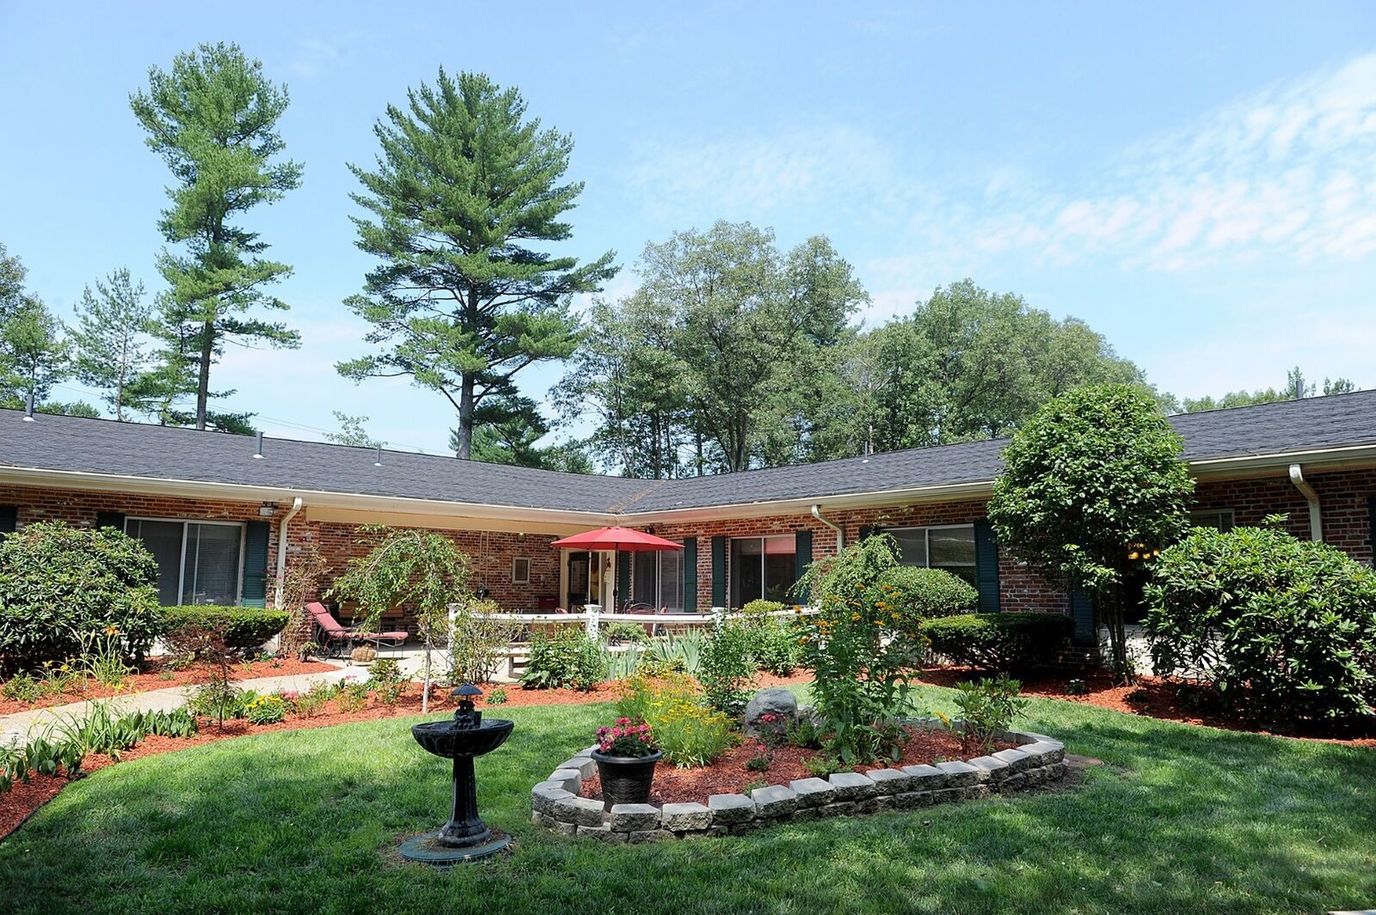
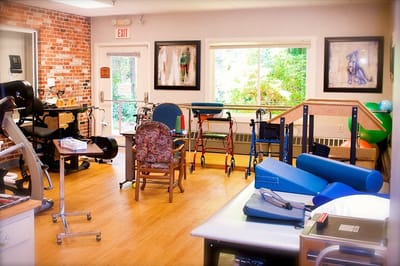
Sudbury Pines Extended Care is a family-owned and operated care home in Sudbury, MA, offering a relaxing environment for short-term rehabilitation and long-term care. They offer the services of a large skilled nursing community in a serene and intimate environment that caters to residents’ unique needs and preferences. They help residents maximize their abilities by providing them tailored physical, occupational, and speech therapies, alongside a well-equipped gym.

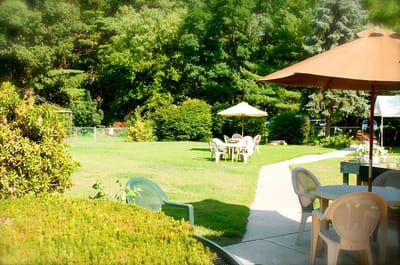
With the help of their dedicated activities and recreational personnel, residents have access to an array of enriching activities and programs that nurture their overall well-being. Three delicious and healthy meals are also served daily with flexible dining options to accommodate residents’ preferences. Here, residents enjoy a combination of comfort, quality care, and enriching experiences in a cozy and supportive environment.

Quality ratings

Measured by Centers for Medicare & Medicaid Services (CMS)

Overall rating Info The Overall CMS Rating combines results from health inspections, staffing levels and quality measures. Health inspections carry the most weight. Staffing and quality scores can increase or decrease the final rating based on performance compared to state and national standards.
▼ 31.0% Below MA avg. ▼ 31.0% Below MA avg.MA average: 2.9Click the badge to see the full State ranking.Click here to see the full State ranking.
Health Inspection Info Based on the results of the facility's three most recent standard inspections and any complaint investigations. CMS reviews the number, scope, and severity of deficiencies, with more recent findings weighted more heavily.
▼ 29.7% Below MA avg. ▼ 29.7% Below MA avg.MA average: 2.8Click the badge to see the full State ranking.Click here to see the full State ranking.
Staffing Info Measures average nursing staff hours per resident per day, including Registered Nurses (RNs) and total nursing staff. Ratings are adjusted based on the level of care residents require and are compared to state and national benchmarks.
▲ 33.3% Above MA avg. ▲ 33.3% Above MA avg.MA average: 3.0Click the badge to see the full State ranking.Click here to see the full State ranking.
Quality Measures Info Based on clinical and physical health indicators reported to CMS, such as hospital readmissions, falls, pressure ulcers, and improvements in mobility. These measures reflect how well residents' health needs are being managed.
▼ 37.1% Below MA avg. ▼ 37.1% Below MA avg.MA average: 3.2Click the badge to see the full State ranking.Click here to see the full State ranking.

Staffing hours breakdown

Info Daily nursing hours per resident by staff type, reported to CMS. Higher is generally better — compare this facility to state and national averages to see where staffing stands.

Hours per resident per day — compared to Massachusetts state averages

Total nursing care / resident Info This home is ranked 31st out of 93 homes in Massachusetts for nurse hours. Total adjusted nursing hours per resident per day, combining RN, LPN, and aide time. CMS adjusts this for case-mix so facilities can be fairly compared.
4h 6m per day
Rank #31 / 93Nurse hours — State benchmarkedThis home is ranked 31st out of 93 homes in Massachusetts. Shows adjusted nurse hours per resident per day benchmarked to the Massachusetts average, with a ranking across 93 Massachusetts facilities. More hours mean more direct care. The national average is about 3.5 hrs; below 3.0 is a red flag.Rankings are based only on facilities in Massachusetts that report data for that category. Facilities without available data are excluded from the ranking.Click the rank badge to see the full State ranking.Click here to see the full State ranking.
This facility Massachusetts avg (3h 56m per day)
vs Massachusetts avg
+4%

4 of 6 metrics below state avg

Standout metric Nurse Aide is +13% above state avg
Staff typeHours / Day / Residentvs state avg
Registered Nurse (RN) Info RNs hold the highest nursing license and can assess residents, interpret test results, and direct care plans. More RN hours per day often signals stronger clinical oversight and faster response to health changes. 27m per day ▼ 32% State avg: 39m per day · National avg: 41m per day
LPN / LVN Info Licensed Practical Nurses (LPNs) or Licensed Vocational Nurses (LVNs) deliver routine hands-on care — medication administration, wound dressing, and monitoring vital signs. They work under RN supervision and make up a large share of daily bedside care. 46m per day ▼ 20% State avg: 58m per day · National avg: 52m per day
Nurse Aide Info Certified Nurse Aides (CNAs) provide the most direct day-to-day assistance: bathing, dressing, feeding, and mobility. Nurse aide hours are typically the largest staffing category and directly affect residents' quality of life. 2h 34m per day ▲ 13% State avg: 2h 16m per day · National avg: 2h 21m per day
Weekend Total Nursing Info Combined nursing hours (RN + LPN + Nurse Aide) per resident per day on weekends. Staffing often drops on weekends — this figure reveals whether the facility maintains adequate coverage outside of weekday hours. 3h 14m per day ▼ 6% State avg: 3h 27m per day · National avg: 3h 26m per day
Physical Therapist Info Hours per resident per day provided by licensed Physical Therapists (PTs) or PT Assistants. PT services help residents recover mobility after injury or illness and are especially important for post-acute (short-stay) rehabilitation. 3m per day ▼ 35% State avg: 4m per day · National avg: 4m per day
Weekend RN Info Registered nurse hours specifically on weekends. Facilities sometimes reduce RN presence on Saturdays and Sundays — a low weekend RN figure compared to weekday hours can indicate reduced clinical oversight when most administrative staff are absent. 31m per day ▲ 11% State avg: 28m per day · National avg: 29m per day

Capacity and availability

This home usually has limited availability

Higher occupancy than the Massachusetts average: 82%
Occupancy rate
92.3% Rank #22 / 96Occupancy rate — State benchmarkedThis home is ranked 22nd out of 96 homes in Massachusetts. Shows this facility's occupancy rate versus the Massachusetts average, with its Statewide rank out of 96. Higher occupancy signals strong local demand and financial stability.Rankings are based only on facilities in Massachusetts that report data for that category. Facilities without available data are excluded from the ranking.Click the rank badge to see the full State ranking.Click here to see the full State ranking.
Avg. Length of Stay
738 days
Bed community size
92-bed community Rank #120 / 280Bed count — State benchmarkedThis home is ranked 120th out of 280 homes in Massachusetts. Shows this facility's certified or reported bed count compared to other Massachusetts facilities. Larger communities may offer more amenities, programs, and on-site services for residents and families.Rankings are based only on facilities in Massachusetts that report data for that category. Facilities without available data are excluded from the ranking.Click the rank badge to see the full State ranking.Click here to see the full State ranking.
A larger shared setting that may offer more common spaces and organized community services.
Walk Score
Walk Score: 43 / 100 Rank #301 / 499Walk Score — State benchmarkedThis home is ranked 301st out of 499 homes in Massachusetts. Shows how walkable this facility's neighborhood is compared to the average Walk Score across Massachusetts facilities. Higher scores benefit residents, families, and staff.Rankings are based only on facilities in Massachusetts that report data for that category. Facilities without available data are excluded from the ranking.Click the rank badge to see the full State ranking.Click here to see the full State ranking.
Somewhat walkable. A few nearby services may be reachable on foot, but most trips require transportation.

About this community

License Details

CMS Certification Number225531

Type Of Units

Low Income Rooms Yes/No from payment or funding tags indicating low-income accessibility options in state disclosures—not a determination of personal eligibility.
No
Total beds
92 units

Staffing

Key information about the people who lead and staff this community.

Leadership

ContactMs. Roberta Henderson, President

Contact Sudbury Pines Extended Care

Inspection History

In Massachusetts, the Executive Office of Elder Affairs (for assisted living facilities) and the Department of Public Health (for nursing homes) are the agencies authorized to inspect and report on facility safety.

Since 2022 · 4 years of data 38 citations

Inspection Scorecard Info This scorecard compares key inspection, citation, and complaint metrics at this facility against the Massachusetts state average. Metrics rated ≥15% worse than average are highlighted in red; those ≥15% better are highlighted in green.

Since 2022 vs. Massachusetts state average
Overall vs. MA average 2 Worse Metrics worse than Massachusetts average:
• Total citations (171% above)
• Citations per year (171% above)
0 Better No metrics in this bucket.
Latest Inspection June 10, 2025 Complaint Investigation

Citations Info Citations are formal regulatory issues recorded during state inspections.

This FacilityMA Averagevs. MA Avg
Total citations Info Formal regulatory issues recorded by inspectors across all inspection types. 3814 This facility has 171% more total citations than a typical Massachusetts nursing home (38 vs. MA avg 14).↑ 171% worse
Citations per year Info Average citations per year since 2022. 9.53.5 This facility has 171% more citations per year than a typical Massachusetts nursing home (9.5 vs. MA avg 3.5).↑ 171% worse

Inspection Reports Summary Info An editor-reviewed summary of the themes and findings across this facility's recent inspection reports.

  • June 10, 2025 complaint investigation found failure to immediately report witnessed abuse incidents involving a CNA slapping a resident, violating the facility’s abuse prevention policies.
  • March 6, 2025 routine inspection identified 23 deficiencies including failure to provide dignified care, inaccurate assessments, poor medication storage, and inadequate respiratory and wound care.
  • March 15, 2024 routine survey found three MDS assessment errors, failure to coordinate PASRR for one resident, and unsafe respiratory care due to missing physician orders.

Health Inspection History

Inspections since 2022
Total health inspections 4

Massachusetts average 4.5


Last Health inspection on Jun 2025

Total health citations
38 Rank #69 / 93Health citations — State benchmarkedThis home is ranked 69th out of 93 homes in Massachusetts. Shows this facility's total health deficiency citations benchmarked to the Massachusetts State average, with a ranking across all 93 MA facilities. Lower citation counts earn a better rank.Rankings are based only on facilities in Massachusetts that report data for that category. Facilities without available data are excluded from the ranking.Click the rank badge to see the full State ranking.Click here to see the full State ranking.

Massachusetts average 32.7

Citations per inspection
9.5 Rank #79 / 93Citations per inspection — State benchmarkedThis home is ranked 79th out of 93 homes in Massachusetts. Shows average deficiency citations per CMS inspection for this facility versus the Massachusetts mean across 93 facilities with citation data. Lower is better.Rankings are based only on facilities in Massachusetts that report data for that category. Facilities without available data are excluded from the ranking.Click the rank badge to see the full State ranking.Click here to see the full State ranking.

Massachusetts average 7.24


Health citations are formal notices following inspections when they fail to comply with safety and care standards.

37 of 38 citations resulted from standard inspections; and 1 of 38 resulted from complaint investigations.

Breakdown of citation severity (last 4 years)
Critical health citations
0
100% better than Massachusetts average

Massachusetts average: 0.3


Serious health citations
0
100% better than Massachusetts average

Massachusetts average: 1.5

0 critical citations Massachusetts average: 0.3

0 serious citations Massachusetts average: 1.5

35 moderate citations Massachusetts average: 29.7

3 minor citations Massachusetts average: 1.3
Citations history (last 4 years)
Abuse/Neglect moderate citation Jun 10, 2025
Corrected

Abuse/Neglect moderate citation Mar 06, 2025
Corrected

Abuse/Neglect moderate citation Mar 06, 2025
Corrected

Abuse/Neglect moderate citation Mar 06, 2025
Corrected

Staffing Data

Reporting period: October 1 – December 31, 2025 (Q4 2025). Source: CMS Payroll-Based Journal report.

Total staff 109
Employees 86
Contractors 23
Staff to resident ratio 1.30 : 1
22% fewer staff per resident than Massachusetts average
Massachusetts average ratio: 1.66 : 1 Massachusetts average ratio: 1.66 : 1See full Massachusetts ranking
Avg staff/day 50
Average shift 7.5 hours
5% worse than Massachusetts average
Massachusetts average: 7.9 hours Massachusetts average shift: 7.9 hoursSee full Massachusetts ranking
Total staff hours (quarter) 34,468

Nursing staff breakdown

Q4 2025 · Oct 1 – Dec 31 More info This data comes from the CMS Payroll-Based Journal report covering October 1 – December 31, 2025.
Registered Nurse

Manages medical care and health needs.

RN Staff Info All 8 RN Staff are full-time employees. No contractors work on this role. 8
Average shift length Info Average shift length. Calculated as total hours divided by days worked and average staff per day. 6.9 hours
Licensed Practical Nurse

Assists with medical care and medications.

LPN Staff Info All 12 LPN Staff are full-time employees. No contractors work on this role. 12
Average shift length Info Average shift length. Calculated as total hours divided by days worked and average staff per day. 7.9 hours
Certified Nursing Assistant

Helps with daily care and mobility.

CNA Staff Info 59 total: 53 full-time employees and 6 contractors. 59
Average shift length Info Average shift length. Calculated as total hours divided by days worked and average staff per day. 8 hours

Contractor staffing

Q4 2025 · Oct 1 – Dec 31 More info This data comes from the CMS Payroll-Based Journal report covering October 1 – December 31, 2025.

Total hours from contractors

8.8%

3,023 contractor hours this quarter

Certified Nursing Assistant: 6 Qualified Social Worker: 3 Physical Therapy Aide: 2 Respiratory Therapy Technician: 2 Physical Therapy Assistant: 2 Mental Health Service Worker: 1 Occupational Therapy Aide: 1 Speech Language Pathologist: 1 Physical Therapist: 1 Diagnostic X-ray Services Staff: 1 Physician Assistant: 1 Qualified Activities Professional: 1 Occupational Therapy Assistant: 1

Staff by category

Q4 2025 · Oct 1 – Dec 31 More info This data comes from the CMS Payroll-Based Journal report covering October 1 – December 31, 2025.
Certified Nursing Assistant5365921,29092100%8
Licensed Practical Nurse120125,72192100%7.9
Registered Nurse8082,52992100%6.9
Nurse Practitioner2028526470%7.2
Mental Health Service Worker3147046470%6.5
Physical Therapy Aide1236686470%5.9
RN Director of Nursing2026566368%5.5
Administrator1014806470%7.5
Respiratory Therapy Technician0223586267%5.8
Clinical Nurse Specialist1013012628%11.6
Physical Therapist0112135257%4.1
Occupational Therapy Aide0111432830%5.1
Medical Director1011051415%7.5
Speech Language Pathologist011962123%4.5
Qualified Social Worker033893336%2.6
Physical Therapy Assistant022672830%2.4
Physician Assistant011661314%5.1
Diagnostic X-ray Services Staff01155910%6.1
Occupational Therapy Assistant0114178%5.9
Dietitian101326470%0.5
Dental Services Staff1012910%0.3
Qualified Activities Professional011111%1
59 Certified Nursing Assistant
% of Days 100%
12 Licensed Practical Nurse
% of Days 100%
8 Registered Nurse
% of Days 100%
2 Nurse Practitioner
% of Days 70%
4 Mental Health Service Worker
% of Days 70%
3 Physical Therapy Aide
% of Days 70%
2 RN Director of Nursing
% of Days 68%
1 Administrator
% of Days 70%
2 Respiratory Therapy Technician
% of Days 67%
1 Clinical Nurse Specialist
% of Days 28%
1 Physical Therapist
% of Days 57%
1 Occupational Therapy Aide
% of Days 30%
1 Medical Director
% of Days 15%
1 Speech Language Pathologist
% of Days 23%
3 Qualified Social Worker
% of Days 36%
2 Physical Therapy Assistant
% of Days 30%
1 Physician Assistant
% of Days 14%
1 Diagnostic X-ray Services Staff
% of Days 10%
1 Occupational Therapy Assistant
% of Days 8%
1 Dietitian
% of Days 70%
1 Dental Services Staff
% of Days 10%
1 Qualified Activities Professional
% of Days 1%

Penalties and fines

Federal penalties imposed by CMS for regulatory violations, including civil money penalties (fines) and denials of payment for new Medicare/Medicaid admissions.

Source: CMS Penalties Database

No penalties in the past 3 years

No civil money penalties or payment denials were reported in the last 3 years.

Quality of care over time

These measures show how residents usually do over time at this home, based on health outcomes and preventive care.

High-risk clinical events score Info A composite score based on pressure ulcers, falls with injury, weight loss, walking ability decline, and activities of daily living decline. 7.9
23% better than Massachusetts average

Massachusetts average: 10.2

Functional decline score Info A composite score based on activities of daily living decline, walking ability decline, and incontinence. 10.7
46% better than Massachusetts average

Massachusetts average: 20.0

Long-stay resident measures
Below average Massachusetts avg: 3.6 Info CMS star rating based on long-stay quality measure performance. 5 stars = significantly above average, 1 star = significantly below average.
Need for Help with Daily Activities Increased Info Percent of long-stay residents whose need for help with daily activities has increased 13.2%
30% better than Massachusetts average

Massachusetts average: 18.7%

Walking Ability Worsened Info Percent of long-stay residents whose ability to move independently worsened 12.9%
33% better than Massachusetts average

Massachusetts average: 19.3%

Low Risk Residents with Bowel/Bladder Incontinence Info Percent of low risk long-stay residents who lose control of their bowels or bladder 6.0%
73% better than Massachusetts average

Massachusetts average: 22.1%

Falls with Major Injury Info Percent of long-stay residents experiencing one or more falls with major injury 1.8%
50% better than Massachusetts average

Massachusetts average: 3.6%

High Risk Residents with Pressure Ulcers Info Percent of long-stay high risk residents with pressure ulcers 5.7%
23% worse than Massachusetts average

Massachusetts average: 4.7%

Urinary Tract Infection Info Percent of long-stay residents with a urinary tract infection 5.9%
182% worse than Massachusetts average

Massachusetts average: 2.1%

Lost Too Much Weight Info Percent of long-stay residents who lose too much weight 5.7%
11% worse than Massachusetts average

Massachusetts average: 5.2%

Depressive Symptoms Info Percent of long-stay residents who have depressive symptoms 6.1%
43% better than Massachusetts average

Massachusetts average: 10.7%

Antipsychotic Use Info Percent of long-stay residents who received an antipsychotic medication 42.5%
110% worse than Massachusetts average

Massachusetts average: 20.3%

Pneumococcal Vaccine Info Percent of long-stay residents assessed and appropriately given the pneumococcal vaccine 97.3%
6% better than Massachusetts average

Massachusetts average: 91.9%

Influenza Vaccine Info Percent of long-stay residents assessed and appropriately given the seasonal influenza vaccine 95.5%
In line with Massachusetts average

Massachusetts average: 94.8%

Hospitalizations per 1,000 days Info Number of hospitalizations per 1,000 long-stay resident days. 2.93
58% worse than Massachusetts average

Massachusetts average: 1.86

ED visits per 1,000 days Info Number of outpatient emergency department visits per 1,000 long-stay resident days. 1.71
11% worse than Massachusetts average

Massachusetts average: 1.54

Short-stay resident measures
Pneumococcal Vaccine Info Percent of short-stay residents assessed and appropriately given the pneumococcal vaccine 54.6%
29% worse than Massachusetts average

Massachusetts average: 76.7%

Falls with major injury Info Percentage of SNF residents who experience falls with major injury during their stay. 0.0%
100% better than Massachusetts average

Massachusetts average: 0.8%

Breakdown by payment type

Medicare

70% of new residents, usually for short-term rehab.

Typical stay 1 - 2 months

Private pay

11% of new residents, often for short stays.

Typical stay 2 years

Medicaid

19% of new residents, often for long-term daily care.

Typical stay 10 - 11 years

Facility Characteristics

Source: CMS Long-Term Care Facility Characteristics (Data as of Jan 2026)

Total residents 84
Medicare
7
8.3% of residents
Medicaid
68
81% of residents
Private pay or other
9
10.7% of residents
Programs & Services
Residents Group

Residents meet regularly to discuss policies, care quality, and activities

Active Resident Council

Organized group of residents that meets regularly to discuss facility policies, quality of life, and activities.

Finances and operations

Based on CMS SNF Cost Report for fiscal year ending in 12/2023.

For-profit
Corporation
Net patient revenue Info Net patient revenue — what the home actually collects for resident care, after contractual allowances, bad debt and discounts are subtracted from its gross charges (CMS cost report, Worksheet G-3). It covers resident care only; money the home earns from other sources is shown separately as "Other income."
$11.5M
Net patient income Info Net patient income: net patient revenue minus the home's total operating expenses. A positive figure means it earns more from resident care than it spends to deliver it; a negative figure means the opposite. It excludes non-operating "other income."
$82.0K
For-profit Corporation
Net patient revenue Info Net patient revenue — what the home actually collects for resident care, after contractual allowances, bad debt and discounts are subtracted from its gross charges (CMS cost report, Worksheet G-3). It covers resident care only; money the home earns from other sources is shown separately as "Other income."
$11.5M Rank #73 / 96Revenue — State benchmarkedThis home is ranked 73rd out of 96 homes in Massachusetts. Shows this facility's annual revenue compared to the Massachusetts average. Higher revenue generally means more resources for staffing and capital — read alongside Payroll %.Rankings are based only on facilities in Massachusetts that report data for that category. Facilities without available data are excluded from the ranking.Click the rank badge to see the full State ranking.Click here to see the full State ranking.
Net patient income Info Net patient income: net patient revenue minus the home's total operating expenses. A positive figure means it earns more from resident care than it spends to deliver it; a negative figure means the opposite. It excludes non-operating "other income."
$82.0K
Other income Info Money the home earns outside of resident care — such as investments, grants, rentals and other non-operating sources (CMS cost report, Worksheet G-3). It is tracked separately from net patient revenue: it is not part of that figure, and it is not included in net patient income.
$771.9K
Payroll costs Info Staff salaries plus wage-related costs — benefits such as payroll taxes, health insurance and retirement — from the home's own accounting records (CMS cost report, Worksheet A). Contract or agency labor is counted separately, under other operating costs. Rank #71 / 96Payroll — State benchmarkedThis home is ranked 71st out of 96 homes in Massachusetts. Shows total annual staff payroll benchmarked to the Massachusetts average. Higher payroll investment relative to peers often signals better staffing and less reliance on cheaper contract labor.Rankings are based only on facilities in Massachusetts that report data for that category. Facilities without available data are excluded from the ranking.Click the rank badge to see the full State ranking.Click here to see the full State ranking.
$7.1M 61.5% of net patient revenue Info Payroll as a share of revenue: staff salaries and wage-related benefits divided by net patient revenue. A higher figure means more of each revenue dollar goes to staff pay. Rank #22 / 96Payroll % — State benchmarkedThis home is ranked 22nd out of 96 homes in Massachusetts. Shows payroll as a percentage of revenue versus the Massachusetts average. Well-run Massachusetts facilities typically land around 54–65% — the top third Statewide. Below 25% may signal understaffing or heavy agency use — read with Staffing ratings.Rankings are based only on facilities in Massachusetts that report data for that category. Facilities without available data are excluded from the ranking.Click the rank badge to see the full State ranking.Click here to see the full State ranking.
Other operating costs Info Everything it costs to run the home apart from payroll — food, utilities, supplies, maintenance, contract labor and administration. Calculated as total operating expense minus payroll (staff salaries and wage-related benefits).
$4.3M
Total costs Info The home's total operating expense for the year — all the costs of running it, salaries included (CMS cost report, Worksheet G-3).
$11.4M

What does this home offer?

Housing options icon

Housing Options: Private / Semi-Private Rooms

Building type icon
Building type icon

Building Type: Single-story

Beauty services icon

Beauty Services

Recreational activities icon

Recreational Activities

Exercise program icon

Exercise Programs

Who this home usually serves

TYPE OF STAY

Mostly short-term rehab stays

Most residents typically stay for a few weeks or months before returning home or moving on.

Most new residents arrive under Medicare (70% of admissions), and a typical Medicare stay runs around 1 - 2 months.

Admissions
37 total

Coverage residents most often arrive under.

Medicare 70%
Private pay 11%
Medicaid 19%
Discharges
42 total

Coverage residents most often leave under.

Medicare 40%
Private pay 10%
Medicaid 50%

Places of interest near Sudbury Pines Extended Care

Address 2.3 miles from city center Info Estimated distance in miles from Sudbury's city center to Sudbury Pines Extended Care's address, calculated via Google Maps.

Calculate Travel Distance to Sudbury Pines Extended Care

Add your location

Address

Compare Nursing Homes around Middlesex County

The information below is reported by the Massachusetts Executive Office of Elder Affairs and Department of Public Health.

5 facilities compared · CMS & MA Dept. of Health data

The Leonard Florence Center
NH
ADC
HC
MC
PC
RC
Chelsea (Admirals Hill)
100
Facility 100
MA AVG 94
Rank #94 / 280
96.7%
Facility 96.7%
MA AVG 82%
Rank #4 / 96
+18%
4.76
Facility 4.76
MA AVG 3.93
Rank #10 / 93
0%+21%
$0
Facility $0
MA AVG $76.6k
Rank #1 / 94
13
Facility 13
MA AVG 32.7
Rank #17 / 93
4.3
Facility 4.3
MA AVG 7.2
Rank #23 / 93
-98-
88
Facility 88
MA AVG 53
Rank #63 / 499
Adam Ernst
$20.6M
Facility $20.6M
MA AVG $17.4M
Rank #27 / 96
$14.3M
Facility $14.3M
MA AVG $6.5M
Rank #16 / 96
69.6%
Facility 69.6%
MA AVG 43.6%
Rank #28 / 96
225775
Life Care Center of Nashoba Valley
NH
MC
Littleton
120
Facility 120
MA AVG 94
Rank #63 / 280
85.4%
Facility 85.4%
MA AVG 82%
Rank #47 / 96
+4%
4.16
Facility 4.16
MA AVG 3.93
Rank #24 / 93
-14%+6%
$0
Facility $0
MA AVG $76.6k
Rank #1 / 94
15
Facility 15
MA AVG 32.7
Rank #21 / 93
5.0
Facility 5.0
MA AVG 7.2
Rank #31 / 93
-112-
5
Facility 5
MA AVG 53
Rank #486 / 499
Shari Laroche
$14.4M
Facility $14.4M
MA AVG $17.4M
Rank #28 / 96
$10.1M
Facility $10.1M
MA AVG $6.5M
Rank #40 / 96
70%
Facility 70%
MA AVG 43.6%
Rank #74 / 96
225569
Life Care Center of Acton
NH
Acton (East Acton)
155
Facility 155
MA AVG 94
Rank #26 / 280
74.2%
Facility 74.2%
MA AVG 82%
Rank #69 / 96
-9%
3.73
Facility 3.73
MA AVG 3.93
Rank #58 / 93
-51%-5%
$0
Facility $0
MA AVG $76.6k
Rank #1 / 94
16
Facility 16
MA AVG 32.7
Rank #24 / 93
5.3
Facility 5.3
MA AVG 7.2
Rank #34 / 93
1125-
39
Facility 39
MA AVG 53
Rank #319 / 499
Christopher Foye
$13.2M
Facility $13.2M
MA AVG $17.4M
Rank #43 / 96
$9.1M
Facility $9.1M
MA AVG $6.5M
Rank #48 / 96
68.6%
Facility 68.6%
MA AVG 43.6%
Rank #60 / 96
225191
Sudbury Pines Extended Care
NH
HC
MC
RC
Sudbury
92
Facility 92
MA AVG 94
Rank #120 / 280
92.3%
Facility 92.3%
MA AVG 82%
Rank #22 / 96
+13%
4.10
Facility 4.10
MA AVG 3.93
Rank #31 / 93
-43%+4%
$0
Facility $0
MA AVG $76.6k
Rank #1 / 94
38
Facility 38
MA AVG 32.7
Rank #69 / 93
9.5
Facility 9.5
MA AVG 7.2
Rank #79 / 93
-90-
43
Facility 43
MA AVG 53
Rank #301 / 499
Roberta Henderson
$11.5M
Facility $11.5M
MA AVG $17.4M
Rank #73 / 96
$7.1M
Facility $7.1M
MA AVG $6.5M
Rank #71 / 96
61.5%
Facility 61.5%
MA AVG 43.6%
Rank #22 / 96
225531
Belmont Manor Nursing & Rehabilitation Center
NH
MC
Belmont (Waverley Square)
156
Facility 156
MA AVG 94
Rank #25 / 280
--
4.72
Facility 4.72
MA AVG 3.93
Rank #11 / 93
+8%+20%
$18.5k
Facility $18.5k
MA AVG $76.6k
Rank #71 / 94
28
Facility 28
MA AVG 32.7
Rank #50 / 93
7.0
Facility 7.0
MA AVG 7.2
Rank #58 / 93
119A+
79
Facility 79
MA AVG 53
Rank #123 / 499
Stewart Karger
$21.2M
Facility $21.2M
MA AVG $17.4M
Rank #42 / 96
$14.5M
Facility $14.5M
MA AVG $6.5M
Rank #12 / 96
68.6%
Facility 68.6%
MA AVG 43.6%
Rank #8 / 96
225419

Financial Assistance for
Nursing Home in Massachusetts

Sudbury Pines Extended Care is located in Sudbury, Massachusetts.
Here are the financial assistance programs available to residents in Massachusetts.

Get Financial aid guidance

Home Care Program

MassHealth Home Care

Age 60+
General Massachusetts resident, at risk of nursing home placement.
Income Limits (2025) ~$1,500/month individual, varies by region
Asset Limits $2,000 individual, excludes home, car
MA

Coordinated through Aging Services Access Points (ASAPs); high demand in urban areas.

Benefits
In-home care (3-5 hours/day) Homemaker services Respite care (up to 14 days/year) Adult day care (~$75/day)

Frail Elder Waiver

Massachusetts Medicaid FE Waiver

Age 65+
General Massachusetts resident, Medicaid-eligible, nursing home-level care need.
Income Limits (2025) ~$2,829/month 300% FBR, individual
Asset Limits $2,000 (individual), $3,000 (couple).
MA

Requires clinical eligibility determination.

Benefits
Personal care (5-7 hours/day) Respite care (240 hours/year) Adult day care (~$75/day) Home health services

Senior Care Options (SCO)

Massachusetts Senior Care Options

Age 65+
General Massachusetts resident, eligible for MassHealth (Medicare optional), nursing home-level care need.
Income Limits (2025) ~$2,829/month (300% FBR, individual); QIT allowed.
Asset Limits $2,000 (individual), $3,000 (couple) (excludes home up to $713,000, car).
MA

Not available in Dukes/Nantucket Counties; multiple SCO providers (e.g., CCA, Tufts).

Benefits
Personal care (5-7 hours/day) Medical care Respite (240 hours/year) Adult

Medicare Savings Program (MSP)

Massachusetts Medicare Savings Program (MassHealth Buy-In)

Age 65+ or disabled
General Massachusetts resident, Medicare Part A/B.
Income Limits (2025) ~$2,510/month (QMB), ~$3,380/month (SLMB), ~$3,598/month (QI)—individual.
Asset Limits $9,430 (individual), $14,130 (couple).
MA

Three tiers; no waitlist; includes Extra Help for Part D.

Benefits
Covers Part B premiums ($174.70/month) Deductibles ($240/year) Copays (~20%)

National Family Caregiver Support Program (NFCSP) Respite

Massachusetts NFCSP Respite Care

Age
General Caregivers of 60+ needing care or 55+ caregivers of others; Massachusetts resident; functional needs (2+ ADLs).
Income Limits (2025) Prioritizes ~$24,980/year (individual); no strict cap.
Asset Limits Not assessed; need-based.
MA

27 ASAPs; prioritizes low-income, rural caregivers.

Benefits
Respite (4-6 hours/week or 5 days/year) Adult day care ($60/day) Caregiver training Supplies (~$500/year)

Prescription Advantage

Massachusetts Prescription Advantage

Age 65+ or disabled
General Massachusetts resident, enrolled in Medicare Part D (or ineligible for Medicare).
Income Limits (2025) No strict limit; copays vary by income ~$24,980-$75,000/year individual
Asset Limits Not assessed.
MA

Supplements Medicare Part D; no enrollment fee for low-income.

Benefits
Covers prescription copays ($5-$40/drug) Fills coverage gaps Catastrophic cost protection ($4,000+ covered)

VA Aid and Attendance (A&A) and Housebound Benefits

Massachusetts VA Aid and Attendance/Housebound

Age 65+ or disabled veteran/spouse
General Massachusetts resident, wartime service, need for ADL help (A&A) or homebound.
Income Limits (2025) Net income < ~$1,984/month (veteran with dependent, A&A); pension offsets income.
Asset Limits ~$155,356 net worth limit
MA

High veteran demand statewide.

Benefits
Cash (~$1,433-$2,642/month veteran, ~$951-$1,318 spouse) for care costs (e.g., in-home, assisted living)

Frequently Asked Questions about Sudbury Pines Extended Care

Is Sudbury Pines Extended Care in a walkable area?

Sudbury Pines Extended Care has a walk score of 43. Somewhat walkable. A few nearby services may be reachable on foot, but most trips require transportation.

What is the occupancy rate at Sudbury Pines Extended Care?

Sudbury Pines Extended Care's occupancy is 92.3%.

Does Sudbury Pines Extended Care operate as a for-profit or non-profit?

Sudbury Pines Extended Care is registered as a for-profit in MA.

Are there photos of Sudbury Pines Extended Care?

Yes — there are 6 photos of Sudbury Pines Extended Care in the photo gallery on this page.

What is the address of Sudbury Pines Extended Care?

Sudbury Pines Extended Care is located at 642 Boston Post Rd, Sudbury, MA 01776.

What is the phone number of Sudbury Pines Extended Care?

(978) 443-9000 will put you in contact with the team at Sudbury Pines Extended Care.

Is Sudbury Pines Extended Care Medicare or Medicaid certified?

Yes — Sudbury Pines Extended Care is a CMS-certified provider of Medicare and Medicaid.

Guides for Better Senior Living

Care Cost Calculator: See Prices in Your Area

Nursing Home Data Explorer

Don’t Wait Too Long: 7 Red Flag Signs Your Parent Needs Assisted Living Now

The True Cost of Assisted Living in 2025 – And How Families Are Paying For It

Understanding Senior Living Costs: Pricing Models, Discounts & Financial Assistance