Summit Rehabilitation and Care Community
Nursing Home & Assisted Living · Aurora, CO
CMS overall rating Info CMS (the Centers for Medicare & Medicaid Services) is the federal agency that rates nursing home quality. Its Overall Rating runs from 1 to 5 stars, combining health inspections, staffing, and quality measures, with inspections weighted most heavily.

Summit Rehabilitation and Care Community

Nursing Home & Assisted Living · Aurora, CO
CMS overall rating Info CMS (the Centers for Medicare & Medicaid Services) is the federal agency that rates nursing home quality. Its Overall Rating runs from 1 to 5 stars, combining health inspections, staffing, and quality measures, with inspections weighted most heavily.
Calculator: See prices in your area
Summit Rehabilitation and Care Community accepts Medicare, Medicaid, and private pay.

Overview of Summit Rehabilitation and Care Community

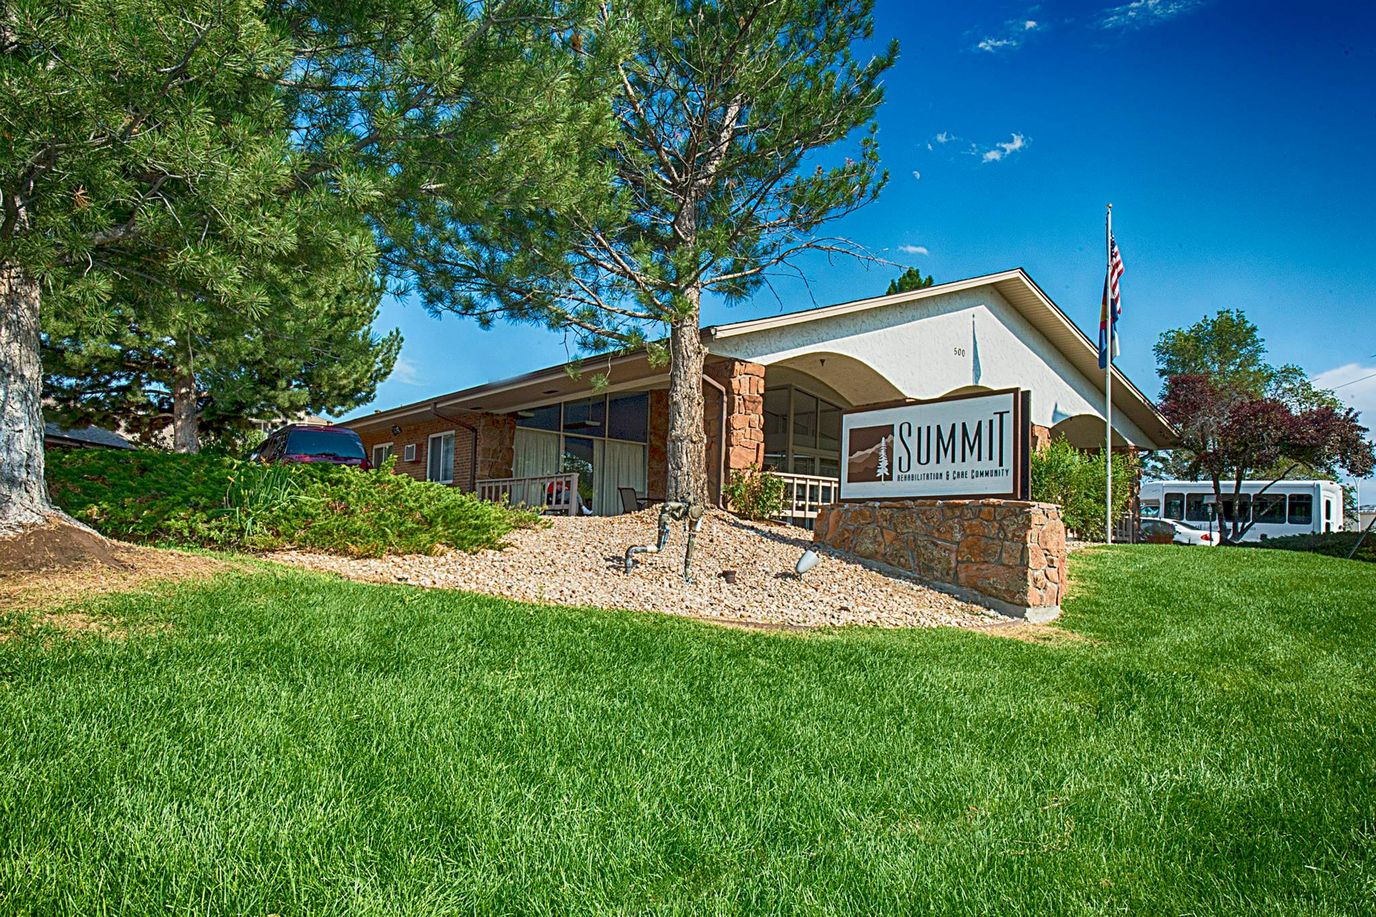
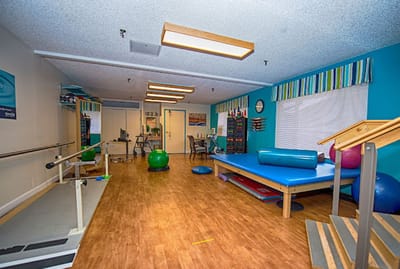
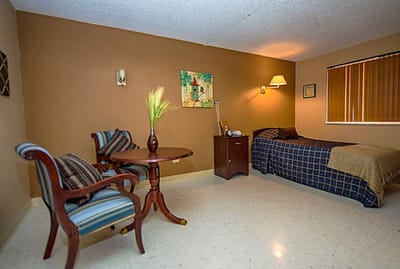
Whether you need short-term rehab and transitional care or long-term skilled nursing care, Summit Rehabilitation & Care Community is here to help. As a skilled nursing community, they provide specialized care for those in need of memory care, speech therapy, physical therapy, occupational therapy, and respiratory therapy. Their on-site physician services ensure that their residents receive the medical attention they need as well. They also specialize in Post-Hospitalization Orthopedic and Joint Replacement Care, stroke recovery, chronic condition management, and more.

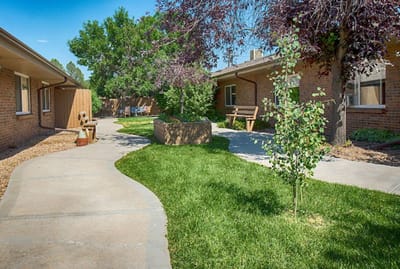
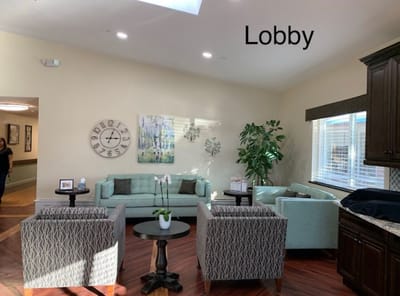
The home is located near the beautiful Aurora Reservoir, one of the largest parks in the city. Residents can enjoy the outdoors and all the activities the park has to offer. Additionally, they are close to the Aurora Center of Active Adults, which offers jewelry-making classes, educational classes, massage services, and much more. Summit Rehabilitation & Care Community prides itself on providing a warm and supportive environment for their residents, and they are exceptionally good at it.

(303) 364-9311

Quality ratings

Measured by Centers for Medicare & Medicaid Services (CMS)

Overall rating Info The Overall CMS Rating combines results from health inspections, staffing levels and quality measures. Health inspections carry the most weight. Staffing and quality scores can increase or decrease the final rating based on performance compared to state and national standards.
▲ 27.2% Above CO avg. ▲ 27.2% Above CO avg.CO average: 3.1Click the badge to see the full State ranking.Click here to see the full State ranking.
Health Inspection Info Based on the results of the facility's three most recent standard inspections and any complaint investigations. CMS reviews the number, scope, and severity of deficiencies, with more recent findings weighted more heavily.
▲ 8.3% Above CO avg. ▲ 8.3% Above CO avg.CO average: 2.8Click the badge to see the full State ranking.Click here to see the full State ranking.
Staffing Info Measures average nursing staff hours per resident per day, including Registered Nurses (RNs) and total nursing staff. Ratings are adjusted based on the level of care residents require and are compared to state and national benchmarks.
▼ 34.2% Below CO avg. ▼ 34.2% Below CO avg.CO average: 3.0Click the badge to see the full State ranking.Click here to see the full State ranking.
Quality Measures Info Based on clinical and physical health indicators reported to CMS, such as hospital readmissions, falls, pressure ulcers, and improvements in mobility. These measures reflect how well residents' health needs are being managed.
▲ 20.5% Above CO avg. ▲ 20.5% Above CO avg.CO average: 4.1Click the badge to see the full State ranking.Click here to see the full State ranking.

Staffing hours breakdown

Info Daily nursing hours per resident by staff type, reported to CMS. Higher is generally better — compare this facility to state and national averages to see where staffing stands.

Hours per resident per day — compared to Colorado state averages

Total nursing care / resident Info This home is ranked 177th out of 215 homes in Colorado for nurse hours. Total adjusted nursing hours per resident per day, combining RN, LPN, and aide time. CMS adjusts this for case-mix so facilities can be fairly compared.
2h 59m per day
Rank #177 / 215Nurse hours — State benchmarkedThis home is ranked 177th out of 215 homes in Colorado. Shows adjusted nurse hours per resident per day benchmarked to the Colorado average, with a ranking across 215 Colorado facilities. More hours mean more direct care. The national average is about 3.5 hrs; below 3.0 is a red flag.Ranking totals vary by category as each rank only includes facilities that report data for that metric. Homes missing that data point aren't included in the ranking.Click the rank badge to see the full State ranking.Click here to see the full State ranking.
This facility Colorado avg (3h 52m per day)
vs Colorado avg
-23%

4 of 6 metrics below state avg

Standout metric Physical Therapist is +33% above state avg
Staff typeHours / Day / Residentvs state avg
Registered Nurse (RN) Info RNs hold the highest nursing license and can assess residents, interpret test results, and direct care plans. More RN hours per day often signals stronger clinical oversight and faster response to health changes. 33m per day ▼ 33% State avg: 50m per day · National avg: 41m per day
LPN / LVN Info Licensed Practical Nurses (LPNs) or Licensed Vocational Nurses (LVNs) deliver routine hands-on care — medication administration, wound dressing, and monitoring vital signs. They work under RN supervision and make up a large share of daily bedside care. 48m per day ▲ 17% State avg: 41m per day · National avg: 52m per day
Nurse Aide Info Certified Nurse Aides (CNAs) provide the most direct day-to-day assistance: bathing, dressing, feeding, and mobility. Nurse aide hours are typically the largest staffing category and directly affect residents' quality of life. 2h 3m per day ▼ 8% State avg: 2h 13m per day · National avg: 2h 21m per day
Weekend Total Nursing Info Combined nursing hours (RN + LPN + Nurse Aide) per resident per day on weekends. Staffing often drops on weekends — this figure reveals whether the facility maintains adequate coverage outside of weekday hours. 3h 5m per day ▼ 6% State avg: 3h 17m per day · National avg: 3h 26m per day
Physical Therapist Info Hours per resident per day provided by licensed Physical Therapists (PTs) or PT Assistants. PT services help residents recover mobility after injury or illness and are especially important for post-acute (short-stay) rehabilitation. 7m per day ▲ 33% State avg: 5m per day · National avg: 4m per day
Weekend RN Info Registered nurse hours specifically on weekends. Facilities sometimes reduce RN presence on Saturdays and Sundays — a low weekend RN figure compared to weekday hours can indicate reduced clinical oversight when most administrative staff are absent. 24m per day ▼ 34% State avg: 36m per day · National avg: 29m per day

Capacity and availability

This home usually has limited availability

Higher occupancy than the Colorado average: 76.5%
Occupancy rate
92.7% Rank #21 / 221Occupancy rate — State benchmarkedThis home is ranked 21st out of 221 homes in Colorado. Shows this facility's occupancy rate versus the Colorado average, with its Statewide rank out of 221. Higher occupancy signals strong local demand and financial stability.Ranking totals vary by category as each rank only includes facilities that report data for that metric. Homes missing that data point aren't included in the ranking.Click the rank badge to see the full State ranking.Click here to see the full State ranking.
Avg. Length of Stay
182 days
Bed community size
110-bed community Rank #108 / 533Bed count — State benchmarkedThis home is ranked 108th out of 533 homes in Colorado. Shows this facility's certified or reported bed count compared to other Colorado facilities. Larger communities may offer more amenities, programs, and on-site services for residents and families.Ranking totals vary by category as each rank only includes facilities that report data for that metric. Homes missing that data point aren't included in the ranking.Click the rank badge to see the full State ranking.Click here to see the full State ranking.
A larger shared setting that may offer more common spaces and organized community services.
Walk Score
Walk Score: 70 / 100 Rank #227 / 872Walk Score — State benchmarkedThis home is ranked 227th out of 872 homes in Colorado. Shows how walkable this facility's neighborhood is compared to the average Walk Score across Colorado facilities. Higher scores benefit residents, families, and staff.Ranking totals vary by category as each rank only includes facilities that report data for that metric. Homes missing that data point aren't included in the ranking.Click the rank badge to see the full State ranking.Click here to see the full State ranking.
Very walkable. Most errands can be accomplished on foot, and many essentials are within a short walk.

About this community

Contact Summit Rehabilitation and Care Community

Staffing Data

Reporting period: October 1 – December 31, 2025 (Q4 2025). Source: CMS Payroll-Based Journal report.

Total staff 143
Employees 143
Contractors 0
Staff to resident ratio 1.36 : 1
28% fewer staff per resident than Colorado average
Colorado average ratio: 1.88 : 1 Colorado average ratio: 1.88 : 1See full Colorado ranking
Avg staff/day 68
Average shift 8.2 hours
0% compared with Colorado average
Colorado average: 8.3 hours Colorado average shift: 8.3 hoursSee full Colorado ranking
Total staff hours (quarter) 51,374

Nursing staff breakdown

Q4 2025 · Oct 1 – Dec 31 More info This data comes from the CMS Payroll-Based Journal report covering October 1 – December 31, 2025.
Registered Nurse

Manages medical care and health needs.

RN Staff Info All 21 RN Staff are full-time employees. No contractors work on this role. 21
Average shift length Info Average shift length. Calculated as total hours divided by days worked and average staff per day. 8.7 hours
Licensed Practical Nurse

Assists with medical care and medications.

LPN Staff Info All 19 LPN Staff are full-time employees. No contractors work on this role. 19
Average shift length Info Average shift length. Calculated as total hours divided by days worked and average staff per day. 9.5 hours
Certified Nursing Assistant

Helps with daily care and mobility.

CNA Staff Info All 55 CNA Staff are full-time employees. No contractors work on this role. 55
Average shift length Info Average shift length. Calculated as total hours divided by days worked and average staff per day. 7.6 hours

Contractor staffing

Q4 2025 · Oct 1 – Dec 31 More info This data comes from the CMS Payroll-Based Journal report covering October 1 – December 31, 2025.
Total hours from contractors 0% — all staff are direct employees this quarter

Staff by category

Q4 2025 · Oct 1 – Dec 31 More info This data comes from the CMS Payroll-Based Journal report covering October 1 – December 31, 2025.
Certified Nursing Assistant5505519,91592100%7.6
Licensed Practical Nurse190197,80692100%9.5
Registered Nurse210214,90992100%8.7
Dental Services Staff110114,52992100%8.4
Qualified Activities Professional100103,40692100%9.9
Physical Therapy Aide5052,2907986%7.8
Qualified Social Worker3031,5177278%8.1
Speech Language Pathologist3031,4267076%7.8
Physical Therapy Assistant3031,3726773%8.1
Respiratory Therapy Technician3031,0837278%8.1
Other Dietary Services Staff3031,04992100%7.7
Administrator1015126470%8
Nurse Practitioner1015126470%8
Occupational Therapy Aide1014966267%8
Dietitian2024706065%7.8
Occupational Therapy Assistant101641415%4.6
Medical Director101171213%1.4
55 Certified Nursing Assistant
% of Days 100%
19 Licensed Practical Nurse
% of Days 100%
21 Registered Nurse
% of Days 100%
11 Dental Services Staff
% of Days 100%
10 Qualified Activities Professional
% of Days 100%
5 Physical Therapy Aide
% of Days 86%
3 Qualified Social Worker
% of Days 78%
3 Speech Language Pathologist
% of Days 76%
3 Physical Therapy Assistant
% of Days 73%
3 Respiratory Therapy Technician
% of Days 78%
3 Other Dietary Services Staff
% of Days 100%
1 Administrator
% of Days 70%
1 Nurse Practitioner
% of Days 70%
1 Occupational Therapy Aide
% of Days 67%
2 Dietitian
% of Days 65%
1 Occupational Therapy Assistant
% of Days 15%
1 Medical Director
% of Days 13%

Penalties and fines

Includes penalties issued in 2023

Federal penalties imposed by CMS for regulatory violations, including civil money penalties (fines) and denials of payment for new Medicare/Medicaid admissions.

Source: CMS Penalties Database (Data as of Jan 2026)

Total fines amount $0 Rank #1 / 221Federal fines — State benchmarkedThis home is ranked 1st out of 221 homes in Colorado. Shows this facility's cumulative CMS federal fine dollars versus the Colorado average among facilities with fines, and where it ranks among 221 facilities in the pool. Lower total dollars mean a better rank.Ranking totals vary by category as each rank only includes facilities that report data for that metric. Homes missing that data point aren't included in the ranking.Click the rank badge to see the full State ranking.Click here to see the full State ranking.
100% lower than Colorado average

Colorado average: $40K

Number of fines 0
100% fewer fines than Colorado average

Colorado average: 2.2

Payment Denials Info Serious action where Medicare and/or Medicaid temporarily stops payments for new residents until issues are fixed. 1
276% more payment denials than Colorado average

Colorado average: 0.3

Fines amount comparison
This facility $0
Colorado average $40K
Penalty History

Penalties are imposed by CMS for violations of federal nursing home regulations.

1 penalty in the past 3 years

Aug 2, 2023 · 17 days

Payment Denial Info Serious action where Medicare and/or Medicaid temporarily stops payments for new residents until issues are fixed. Aug 2, 2023
17 days

Last updated: Jan 2026

Quality of care over time

These measures show how residents usually do over time at this home, based on health outcomes and preventive care.

High-risk clinical events score Info A composite score based on pressure ulcers, falls with injury, weight loss, walking ability decline, and activities of daily living decline. 3.7
59% better than Colorado average

Colorado average: 9.0

Functional decline score Info A composite score based on activities of daily living decline, walking ability decline, and incontinence. 8.9
52% better than Colorado average

Colorado average: 18.8

Long-stay resident measures
Significantly above average Colorado avg: 3.9 Info CMS star rating based on long-stay quality measure performance. 5 stars = significantly above average, 1 star = significantly below average.
Need for Help with Daily Activities Increased Info Percent of long-stay residents whose need for help with daily activities has increased 6.4%
60% better than Colorado average

Colorado average: 16.0%

Walking Ability Worsened Info Percent of long-stay residents whose ability to move independently worsened 3.3%
81% better than Colorado average

Colorado average: 17.0%

Low Risk Residents with Bowel/Bladder Incontinence Info Percent of low risk long-stay residents who lose control of their bowels or bladder 17.1%
26% better than Colorado average

Colorado average: 23.2%

Falls with Major Injury Info Percent of long-stay residents experiencing one or more falls with major injury 1.9%
44% better than Colorado average

Colorado average: 3.3%

High Risk Residents with Pressure Ulcers Info Percent of long-stay high risk residents with pressure ulcers 2.6%
33% better than Colorado average

Colorado average: 3.9%

Urinary Tract Infection Info Percent of long-stay residents with a urinary tract infection 1.1%
25% better than Colorado average

Colorado average: 1.4%

Lost Too Much Weight Info Percent of long-stay residents who lose too much weight 4.2%
20% better than Colorado average

Colorado average: 5.2%

Depressive Symptoms Info Percent of long-stay residents who have depressive symptoms 0.6%
92% better than Colorado average

Colorado average: 7.2%

Antipsychotic Use Info Percent of long-stay residents who received an antipsychotic medication 13.7%
27% better than Colorado average

Colorado average: 18.8%

Pneumococcal Vaccine Info Percent of long-stay residents assessed and appropriately given the pneumococcal vaccine 97.1%
In line with Colorado average

Colorado average: 93.3%

Influenza Vaccine Info Percent of long-stay residents assessed and appropriately given the seasonal influenza vaccine 98.0%
In line with Colorado average

Colorado average: 94.7%

Hospitalizations per 1,000 days Info Number of hospitalizations per 1,000 long-stay resident days. 0.93
28% better than Colorado average

Colorado average: 1.30

ED visits per 1,000 days Info Number of outpatient emergency department visits per 1,000 long-stay resident days. 1.23
26% better than Colorado average

Colorado average: 1.67

Short-stay resident measures
Significantly above average Colorado avg: 2.7 Info CMS star rating based on short-stay quality measure performance. 5 stars = much above average, 1 star = much below average.
Pneumococcal Vaccine Info Percent of short-stay residents assessed and appropriately given the pneumococcal vaccine 74.8%
In line with Colorado average

Colorado average: 76.6%

Antipsychotic medication increase Info Percent of short-stay residents who newly received an antipsychotic medication 1.2%
16% better than Colorado average

Colorado average: 1.4%

Influenza Vaccine Info Percent of short-stay residents assessed and appropriately given the seasonal influenza vaccine 72.6%
In line with Colorado average

Colorado average: 75.6%

Re-hospitalized after SNF stay Info Percentage of short-stay residents who were re-hospitalized after their nursing home admission. 16.5%
19% better than Colorado average

Colorado average: 20.3%

Emergency department visits Info Percentage of short-stay residents who had an outpatient emergency department visit. 12.8%
In line with Colorado average

Colorado average: 12.8%

Falls with major injury Info Percentage of SNF residents who experience falls with major injury during their stay. 0.0%
100% better than Colorado average

Colorado average: 0.8%

Ability to care for self at discharge Info Percentage of residents at or above expected ability to care for themselves at discharge. 68.2%
27% better than Colorado average

Colorado average: 53.7%

Successful return to home or community Info Rate of successful return to home or community from a skilled nursing facility. 53.2%
5% better than Colorado average

Colorado average: 50.6%

Breakdown by payment type

Medicare

14% of new residents, usually for short-term rehab.

Typical stay 18 days

Private pay

73% of new residents, often for short stays.

Typical stay 1 - 2 months

Medicaid

12% of new residents, often for long-term daily care.

Typical stay 3 - 4 years

Facility Characteristics

Source: CMS Long-Term Care Facility Characteristics (Data as of Jan 2026)

Total residents 105
Medicare
5
4.8% of residents
Medicaid
78
74.3% of residents
Private pay or other
22
21% of residents
Programs & Services
Residents Group

Residents meet regularly to discuss policies, care quality, and activities

Active Resident Council

Organized group of residents that meets regularly to discuss facility policies, quality of life, and activities.

Finances and operations

Based on CMS SNF Cost Report for fiscal year ending in 12/2023.

Privately-owned community
Operated by a single business entity.
Net patient revenue Info Net patient revenue — what the home actually collects for resident care, after contractual allowances, bad debt and discounts are subtracted from its gross charges (CMS cost report, Worksheet G-3). It covers resident care only; money the home earns from other sources is shown separately as "Other income."
$12.3M
Net patient income Info Net patient income: net patient revenue minus the home's total operating expenses. A positive figure means it earns more from resident care than it spends to deliver it; a negative figure means the opposite. It excludes non-operating "other income."
$371.5K
Privately-owned community Operated by a single business entity.
Net patient revenue Info Net patient revenue — what the home actually collects for resident care, after contractual allowances, bad debt and discounts are subtracted from its gross charges (CMS cost report, Worksheet G-3). It covers resident care only; money the home earns from other sources is shown separately as "Other income."
$12.3M Rank #42 / 221Revenue — State benchmarkedThis home is ranked 42nd out of 221 homes in Colorado. Shows this facility's annual revenue compared to the Colorado average. Higher revenue generally means more resources for staffing and capital — read alongside Payroll %.Ranking totals vary by category as each rank only includes facilities that report data for that metric. Homes missing that data point aren't included in the ranking.Click the rank badge to see the full State ranking.Click here to see the full State ranking.
Net patient income Info Net patient income: net patient revenue minus the home's total operating expenses. A positive figure means it earns more from resident care than it spends to deliver it; a negative figure means the opposite. It excludes non-operating "other income."
$371.5K
Other income Info Money the home earns outside of resident care — such as investments, grants, rentals and other non-operating sources (CMS cost report, Worksheet G-3). It is tracked separately from net patient revenue: it is not part of that figure, and it is not included in net patient income.
$88.2K
Payroll costs Info Staff salaries plus wage-related costs — benefits such as payroll taxes, health insurance and retirement — from the home's own accounting records (CMS cost report, Worksheet A). Contract or agency labor is counted separately, under other operating costs. Rank #76 / 221Payroll — State benchmarkedThis home is ranked 76th out of 221 homes in Colorado. Shows total annual staff payroll benchmarked to the Colorado average. Higher payroll investment relative to peers often signals better staffing and less reliance on cheaper contract labor.Ranking totals vary by category as each rank only includes facilities that report data for that metric. Homes missing that data point aren't included in the ranking.Click the rank badge to see the full State ranking.Click here to see the full State ranking.
$6.8M 55.4% of net patient revenue Info Payroll as a share of revenue: staff salaries and wage-related benefits divided by net patient revenue. A higher figure means more of each revenue dollar goes to staff pay. Rank #172 / 221Payroll % — State benchmarkedThis home is ranked 172nd out of 221 homes in Colorado. Shows payroll as a percentage of revenue versus the Colorado average. Well-run Colorado facilities typically land around 59–66% — the top third Statewide. Below 25% may signal understaffing or heavy agency use — read with Staffing ratings.Ranking totals vary by category as each rank only includes facilities that report data for that metric. Homes missing that data point aren't included in the ranking.Click the rank badge to see the full State ranking.Click here to see the full State ranking.
Other operating costs Info Everything it costs to run the home apart from payroll — food, utilities, supplies, maintenance, contract labor and administration. Calculated as total operating expense minus payroll (staff salaries and wage-related benefits).
$5.1M
Total costs Info The home's total operating expense for the year — all the costs of running it, salaries included (CMS cost report, Worksheet G-3).
$11.9M

Who this home usually serves

TYPE OF STAY

Primarily short stays

Residents typically stay for brief periods, with frequent admissions and discharges throughout the year.

Most new residents arrive under private pay (73% of admissions), and a typical private pay stay runs around 1 - 2 months.

Admissions
210 total

Coverage residents most often arrive under.

Medicare 14%
Private pay 73%
Medicaid 12%
Discharges
204 total

Coverage residents most often leave under.

Medicare 12%
Private pay 65%
Medicaid 23%

Places of interest near Summit Rehabilitation and Care Community

Address 2.5 miles from city center Info Estimated distance in miles from Aurora's city center to Summit Rehabilitation and Care Community's address, calculated via Google Maps. — 1.82 miles to nearest hospital (UCHealth University of Colorado Hospital)

Calculate Travel Distance to Summit Rehabilitation and Care Community

Add your location

Address

Compare Nursing Home around Aurora

The information below is reported by the Colorado Department of Public Health and Environment, Health Facilities Division.

5 facilities compared · CMS & CO Dept. of Health data

Garden Terrace at Aurora
NH
MC
Aurora (South Potomac Street)
120
Facility 120
CO AVG 76
Rank #79 / 533
77.5%
Facility 77.5%
CO AVG 76.5%
Rank #111 / 221
+1%
4.36
Facility 4.36
CO AVG 3.86
Rank #34 / 215
-10%+13%
$0
Facility $0
CO AVG $39.2k
Rank #1 / 221
11
Facility 11
CO AVG 24.8
Rank #24 / 221
2.8
Facility 2.8
CO AVG 5.2
Rank #30 / 221
-96-
46
Facility 46
CO AVG 51
Rank #525 / 872
Jerry Weeter
$10.7M
Facility $10.7M
CO AVG $11.2M
Rank #91 / 221
$7.9M
Facility $7.9M
CO AVG $4.9M
Rank #55 / 221
73.3%
Facility 73.3%
CO AVG 46.6%
Rank #25 / 221
65266
Life Care Center of Aurora
NH
Aurora (Southeast Crossing)
166
Facility 166
CO AVG 76
Rank #27 / 533
31.9%
Facility 31.9%
CO AVG 76.5%
Rank #205 / 221
-58%
3.95
Facility 3.95
CO AVG 3.86
Rank #66 / 215
+17%+2%
$33.2k
Facility $33.2k
CO AVG $39.2k
Rank #162 / 221
28
Facility 28
CO AVG 24.8
Rank #142 / 221
5.6
Facility 5.6
CO AVG 5.2
Rank #139 / 221
253A+
41
Facility 41
CO AVG 51
Rank #570 / 872
David Strain
$14.6M
Facility $14.6M
CO AVG $11.2M
Rank #40 / 221
$10.6M
Facility $10.6M
CO AVG $4.9M
Rank #23 / 221
72.4%
Facility 72.4%
CO AVG 46.6%
Rank #54 / 221
65332
The Springs at St Andrew‘s Village
NH
Aurora (Heather Gardens)
58
Facility 58
CO AVG 76
Rank #325 / 533
60.3%
Facility 60.3%
CO AVG 76.5%
Rank #167 / 221
-21%
3.50
Facility 3.50
CO AVG 3.86
Rank #117 / 215
+39%-9%
$0
Facility $0
CO AVG $39.2k
Rank #1 / 221
16
Facility 16
CO AVG 24.8
Rank #54 / 221
5.3
Facility 5.3
CO AVG 5.2
Rank #120 / 221
135-
38
Facility 38
CO AVG 51
Rank #598 / 872
David Dunyon
$6.5M
Facility $6.5M
CO AVG $11.2M
Rank #166 / 221
$4.4M
Facility $4.4M
CO AVG $4.9M
Rank #166 / 221
67.7%
Facility 67.7%
CO AVG 46.6%
Rank #124 / 221
65388
Summit Rehabilitation and Care Community
NH
AL
Aurora (Sunny Vale)
110
Facility 110
CO AVG 76
Rank #108 / 533
92.7%
Facility 92.7%
CO AVG 76.5%
Rank #21 / 221
+21%
2.98
Facility 2.98
CO AVG 3.86
Rank #177 / 215
+4%-23%
$0
Facility $0
CO AVG $39.2k
Rank #1 / 221
23
Facility 23
CO AVG 24.8
Rank #117 / 221
3.3
Facility 3.3
CO AVG 5.2
Rank #46 / 221
1106-
70
Facility 70
CO AVG 51
Rank #227 / 872
-
$12.3M
Facility $12.3M
CO AVG $11.2M
Rank #42 / 221
$6.8M
Facility $6.8M
CO AVG $4.9M
Rank #76 / 221
55.4%
Facility 55.4%
CO AVG 46.6%
Rank #172 / 221
65176
Aviva at Fitzsimons
NH
Aurora (Morris Heights)
100
Facility 100
CO AVG 76
Rank #161 / 533
80.2%
Facility 80.2%
CO AVG 76.5%
Rank #96 / 221
+5%
3.04
Facility 3.04
CO AVG 3.86
Rank #177 / 215
+51%-21%
$14.7k
Facility $14.7k
CO AVG $39.2k
Rank #117 / 221
28
Facility 28
CO AVG 24.8
Rank #142 / 221
4.0
Facility 4.0
CO AVG 5.2
Rank #67 / 221
374-
31
Facility 31
CO AVG 51
Rank #673 / 872
Kcp Aurora, LLC
$18.7M
Facility $18.7M
CO AVG $11.2M
Rank #4 / 221
$11.2M
Facility $11.2M
CO AVG $4.9M
Rank #5 / 221
59.9%
Facility 59.9%
CO AVG 46.6%
Rank #195 / 221
65430

Financial Assistance for
Nursing Home in Colorado

Summit Rehabilitation and Care Community is located in Aurora, Colorado.
Here are the financial assistance programs available to residents in Colorado.

Get Financial aid guidance

Elderly, Blind, and Disabled Waiver

Colorado Medicaid EBD Waiver

Age 65+ or disabled
General Colorado resident, Medicaid- eligible, nursing home-level care need.
Income Limits (2025) ~$2,829/month 300% FBR, individual
Asset Limits $2,000 (individual), $3,000 (couple).
CO

Requires level-of-care assessment by case manager.

Benefits
Personal care (5-7 hours/day) Respite care (up to 240 hours/year) Adult day care ($65/day) Home modifications ($1,500 avg.)

Old Age Pension (OAP) Health Care Program

Colorado OAP

Age 60+
General Colorado resident.
Income Limits ~$1,215/month individual
Asset Limits $2,000 individual
CO

Supplements SSI; limited medical coverage.

Benefits
Cash (~$100-$800/month) Limited in-home care (2-3 hours/week) Medical assistance

Program of All-Inclusive Care for the Elderly (PACE)

Colorado Medicaid PACE

Age 55+
General Colorado resident, nursing home-level care need, safe with PACE support.
Income Limits (2025) ~$2,829/month 300% FBR
Asset Limits $2,000 (individual), $3,000 (couple).
CO

Limited to specific regions (e.g., Denver, Pueblo).

Benefits
All-inclusive care—personal care (5-7 hours/day) Meals Transportation Therapy Medical visits

Home Care Allowance (HCA)

Colorado Home Care Allowance (HCA)

Age
General Seniors typically 65+, Age 5+ with disability, Colorado resident, financial/functional need.
Income Limits (2025) ~$1,004/month individual, stricter than waivers
Asset Limits $2,000 (individual), $3,000 (couple).
CO

Must need help with ADLs; not Medicaid-waiver eligible.

Benefits
Personal care (~4-6 hours/day, paid to provider) E.g. Bathing Dressing

Frequently Asked Questions about Summit Rehabilitation and Care Community

What neighborhood is Summit Rehabilitation and Care Community in?

Summit Rehabilitation and Care Community is in the Sunny Vale neighborhood.

Is Summit Rehabilitation and Care Community in a walkable area?

Summit Rehabilitation and Care Community has a walk score of 70. Very walkable. Most errands can be accomplished on foot, and many essentials are within a short walk.

What is the occupancy rate at Summit Rehabilitation and Care Community?

Summit Rehabilitation and Care Community's occupancy is 92.7%.

Are there photos of Summit Rehabilitation and Care Community?

Yes — there are 6 photos of Summit Rehabilitation and Care Community in the photo gallery on this page.

What is the phone number of Summit Rehabilitation and Care Community?

(303) 364-9311 will put you in contact with the team at Summit Rehabilitation and Care Community.

Is Summit Rehabilitation and Care Community Medicare or Medicaid certified?

Yes — Summit Rehabilitation and Care Community is a CMS-certified provider of Medicare and Medicaid.

Guides for Better Senior Living

Care Cost Calculator: See Prices in Your Area

Nursing Home Data Explorer

Don’t Wait Too Long: 7 Red Flag Signs Your Parent Needs Assisted Living Now

The True Cost of Assisted Living in 2025 – And How Families Are Paying For It

Understanding Senior Living Costs: Pricing Models, Discounts & Financial Assistance