Total health inspections
17
Illinois average 10.4
Last Health inspection on Sep 2025

We arrange tours, appointments, and even moving support so you don’t have to
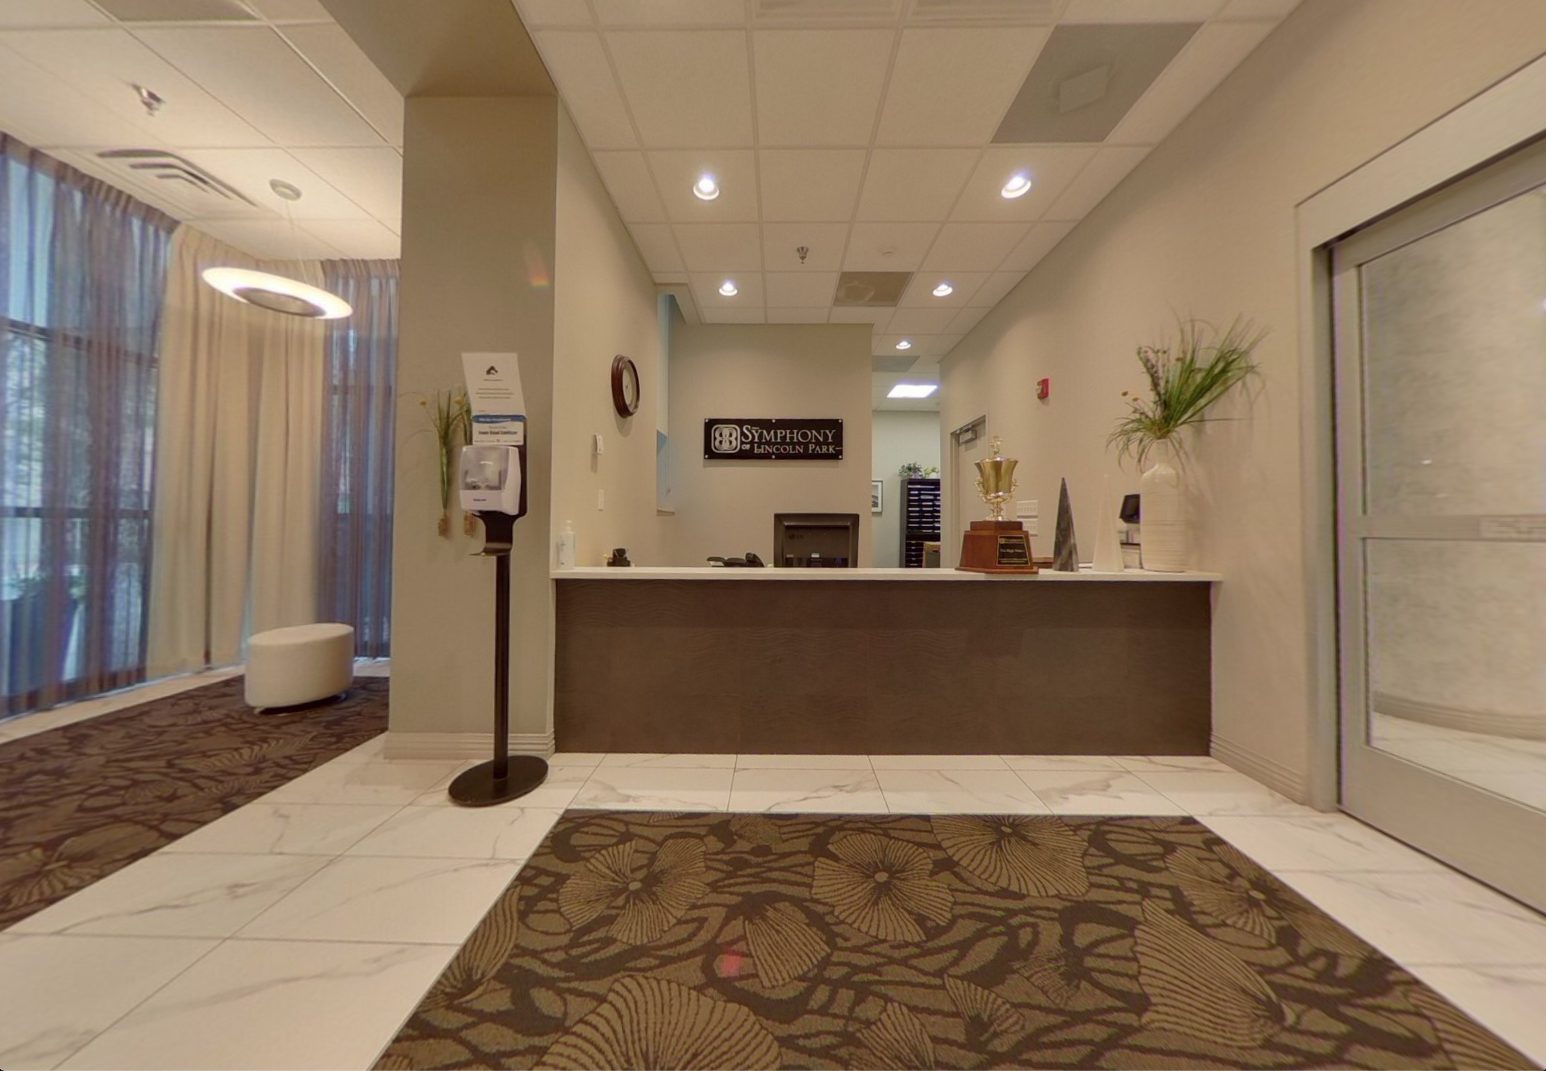

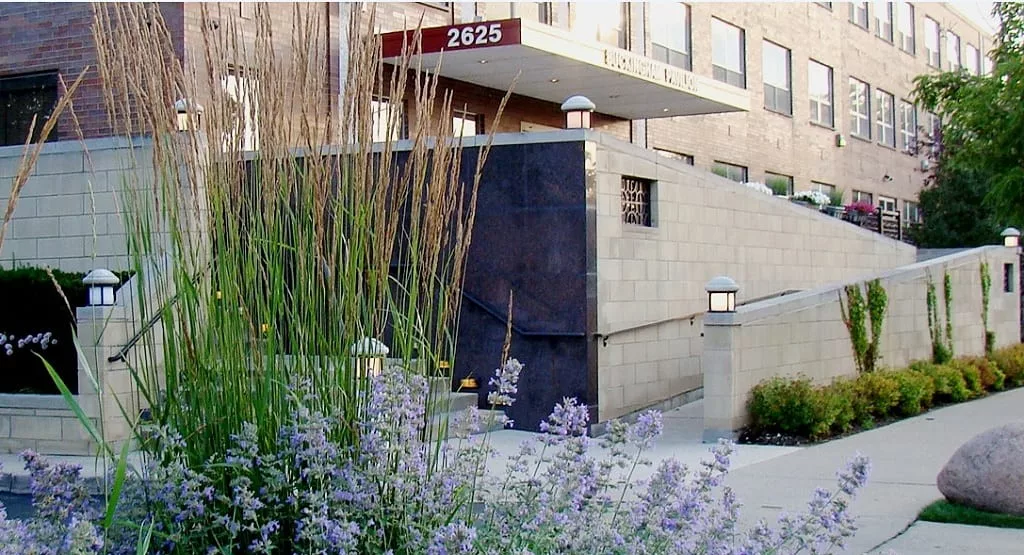
Symphony Residences of Lincoln Park is an elegant senior living facility that provides an affordable lifestyle. A personalized care service is provided for residents of independent and assisted living to allow an enriching experience at the Symphony Residences. They pride themselves as a warm and welcoming environment making residents feel safe and comfortable. Symphony Residences of Lincoln Park promotes a simplified life balanced with an enriching lifestyle; from the moment you step into the grounds, you will feel like you truly belong and have just discovered your new home. You’ll immediately notice the serene yet professional environment that the community holds. Symphony Residences ensures a resort-like hospitality experience by providing only the utmost comfort and security.
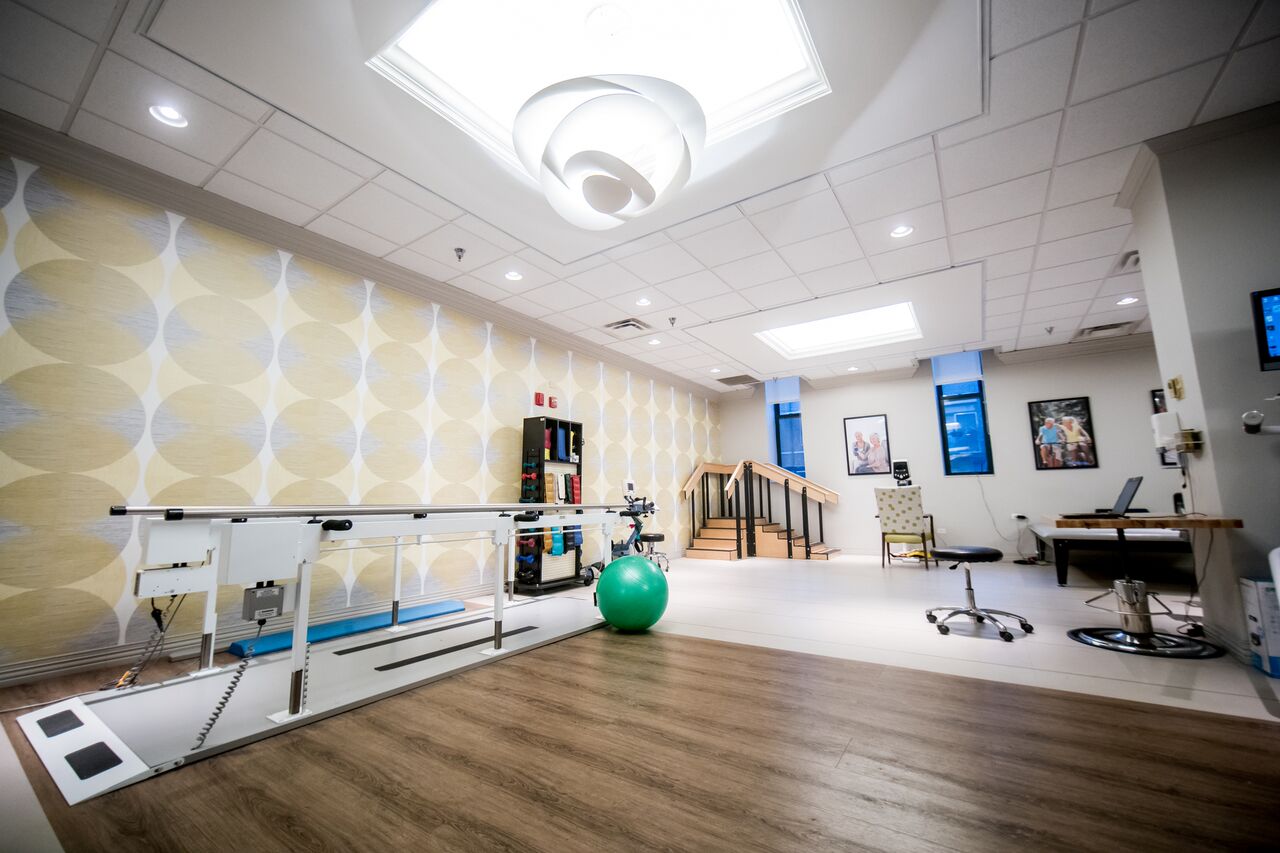
Life at Symphony Residences boasts an affordable senior living with renowned amenities and services; such as their five-star dining with an executive chef. Private apartments with the options of choosing from studio and one or two-bedroom apartments inclusive of housekeeping and laundry services. Other community amenities included are: salon and barbershop, library, outdoor patio, and spa– all included to provide quality service.
 Official CMS rating based on health inspections, staffing and quality measures.
Official CMS rating based on deficiencies found during state health inspections.
Official CMS rating based on nurse staffing hours per resident per day.
Official CMS rating based on clinical outcomes for residents.
Average daily nursing hours per resident (adjusted for acuity). Higher values indicate more nursing time per resident.
Official CMS rating based on health inspections, staffing and quality measures.
Official CMS rating based on deficiencies found during state health inspections.
Official CMS rating based on nurse staffing hours per resident per day.
Official CMS rating based on clinical outcomes for residents.
Average daily nursing hours per resident (adjusted for acuity). Higher values indicate more nursing time per resident.
May provide extensive amenities, services and programs.
Lower occupancy suggests more openings may be available.
Most residents typically stay for a few weeks or months before returning home or moving on.
78% of new residents, usually for short-term rehab.
20% of new residents, often for short stays.
2% of new residents, often for long-term daily care.
The portion of the home's budget spent on staff, including nurses, caregivers, and other employees who support care and operations.
All remaining costs needed to run the home, such as food, utilities, building maintenance, supplies and administrative expenses.
Illinois average 10.4
Last Health inspection on Sep 2025
Health citations are formal notices following inspections when they fail to comply with safety and care standards.
32 of 65 citations resulted from standard inspections; 32 of 65 resulted from complaint investigations; and 1 of 65 came from combined inspections (standard and complaint).
Illinois average: 0.7
Illinois average: 3.6
Data sourced from CMS Health Deficiencies reports. Citation severity codes range from A (least serious) to L (most serious). Immediate Jeopardy (J-L) citations indicate situations where the facility's noncompliance has placed residents at risk of death or serious harm.
Nursing Homes 24/7 care needed
Memory Care Specialized care for those with Memory Loss, Alzheimer's, or dementia, ensuring safety and support.
Nursing Homes 24/7 care needed
Respite Care
Nursing Homes 24/7 care needed
Nursing Homes 24/7 care needed
Assisted Living For seniors needing help with daily tasks but not full-time nursing.
Independent Living For self-sufficient seniors seeking community and minimal assistance.
Memory Care Specialized care for those with Memory Loss, Alzheimer's, or dementia, ensuring safety and support.
Nursing Homes 24/7 care needed
 Astoria Place
  Symphony Lincoln Park
 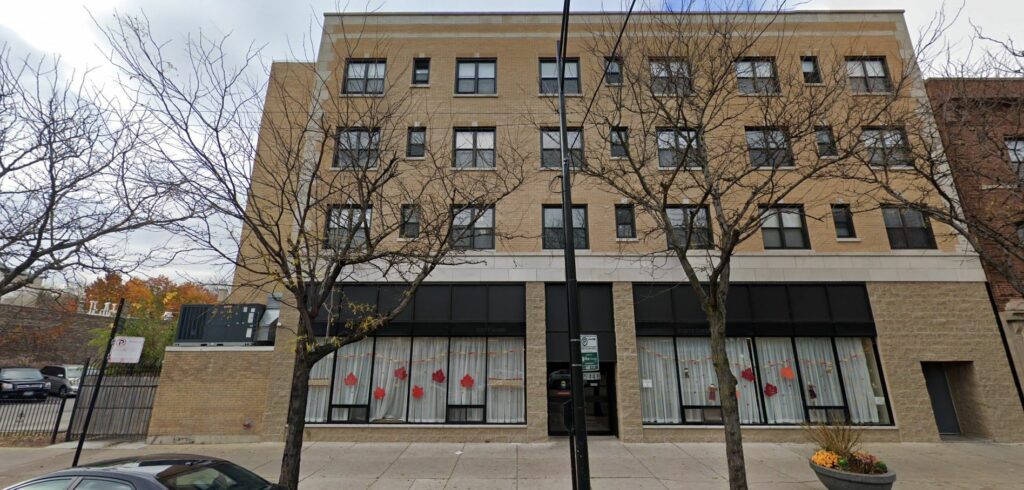 All American Village Nursing and Rehabilitation Center
  Avantara Evergreen Park
![]() 5.1 miles from city center — 1.45 miles to nearest hospital (Ascension Saint Joseph - Chicago)
5.1 miles from city center — 1.45 miles to nearest hospital (Ascension Saint Joseph - Chicago)
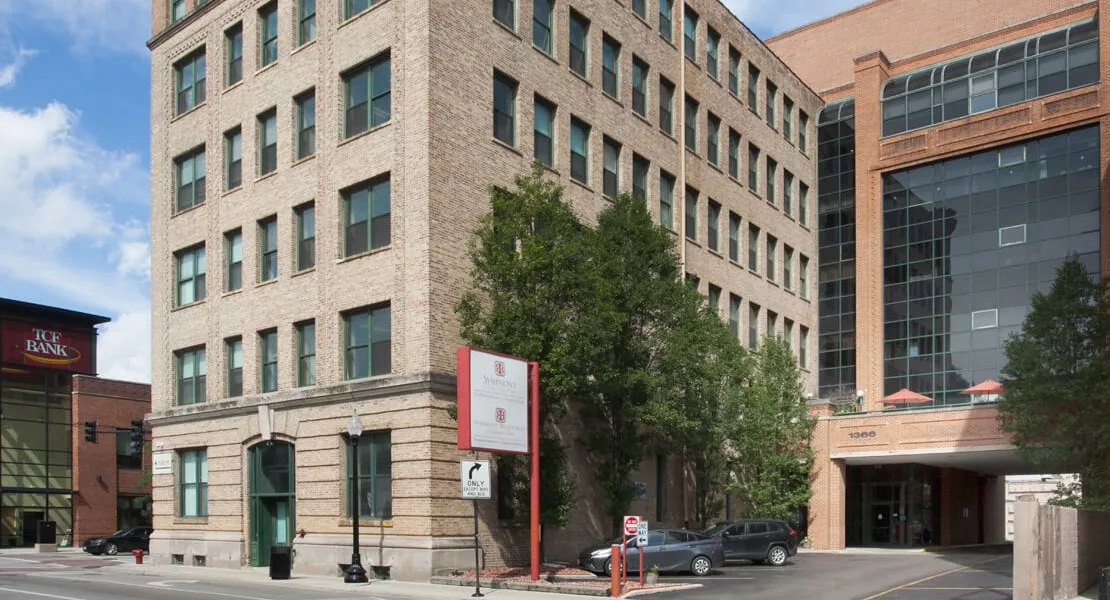
![]() 1366 W Fullerton Ave, Chicago, IL 60614
1366 W Fullerton Ave, Chicago, IL 60614
Add your location
Source: CMS Payroll-Based Journal (Q2 2025)
| Role ⓘ | Count ⓘ | Avg Shift (hrs) ⓘ | Uses Contractors? ⓘ |
|---|---|---|---|
| Registered Nurse | 111 | 8.8 | Yes |
| Licensed Practical Nurse | 85 | 9.3 | Yes |
| Certified Nursing Assistant | 364 | 7 | Yes |
| Role ⓘ | Employees ⓘ | Contractors ⓘ | Total Staff ⓘ | Total Hours ⓘ | Days Worked ⓘ | % of Days ⓘ | Avg Shift (hrs) ⓘ |
|---|---|---|---|---|---|---|---|
| Certified Nursing Assistant | 95 | 269 | 364 | 37,563 | 91 | 100% | 7 |
| Licensed Practical Nurse | 32 | 53 | 85 | 13,977 | 91 | 100% | 9.3 |
| Registered Nurse | 24 | 87 | 111 | 13,101 | 91 | 100% | 8.8 |
| Other Dietary Services Staff | 8 | 0 | 8 | 3,113 | 91 | 100% | 7.2 |
| Clinical Nurse Specialist | 6 | 0 | 6 | 2,501 | 91 | 100% | 6 |
| Dental Services Staff | 5 | 0 | 5 | 1,757 | 89 | 98% | 5.7 |
| RN Director of Nursing | 4 | 0 | 4 | 1,219 | 90 | 99% | 5.4 |
| Respiratory Therapy Technician | 0 | 5 | 5 | 1,019 | 74 | 81% | 7.8 |
| Physical Therapy Aide | 0 | 2 | 2 | 753 | 54 | 59% | 7.2 |
| Speech Language Pathologist | 0 | 7 | 7 | 584 | 62 | 68% | 6.7 |
| Physical Therapy Assistant | 0 | 6 | 6 | 517 | 71 | 78% | 6.2 |
| Administrator | 1 | 0 | 1 | 504 | 89 | 98% | 5.7 |
| Mental Health Service Worker | 1 | 0 | 1 | 496 | 88 | 97% | 5.6 |
| Nurse Practitioner | 1 | 0 | 1 | 461 | 81 | 89% | 5.7 |
| Dietitian | 1 | 0 | 1 | 448 | 81 | 89% | 5.5 |
| Qualified Social Worker | 0 | 2 | 2 | 289 | 50 | 55% | 5.8 |
Source: CMS Long-Term Care Facility Characteristics (Data as of Jan 2026)
Residents meet regularly to discuss policies, care quality, and activities
Organized group of residents that meets regularly to discuss facility policies, quality of life, and activities.
Data sourced from CMS Long-Term Care Facility Characteristics quarterly report. Payer mix reflects the current resident census by primary payment source.
These measures show how residents usually do over time at this home, based on health outcomes and preventive care.
Illinois average: 9.7
Illinois average: 18.6
Illinois average: 15.5%
Illinois average: 18.4%
Illinois average: 21.6%
Illinois average: 3.4%
Illinois average: 5.3%
Illinois average: 1.8%
Illinois average: 6.5%
Illinois average: 48.1%
Illinois average: 20.2%
Illinois average: 89.2%
Illinois average: 91.6%
Illinois average: 68.3%
Illinois average: 2.3%
Illinois average: 63.0%
Quality measures are calculated from Minimum Data Set (MDS) assessments. For most measures, lower percentages indicate better care quality.
Federal penalties imposed by CMS for regulatory violations, including civil money penalties (fines) and denials of payment for new Medicare/Medicaid admissions.
Source: CMS Penalties Database (Data as of Jan 2026)
Illinois average: $143K
Illinois average: 3.0
Illinois average: 1.1
Penalties are imposed by CMS for violations of federal nursing home regulations.
Last updated: Jan 2026
Historical financial and operational data for Symphony Lincoln Park based on CMS SNF Cost Reports.
Loading trend charts...
Care Cost Calculator: See Prices in Your Area
Nursing Home Data Explorer
Don’t Wait Too Long: 7 Red Flag Signs Your Parent Needs Assisted Living Now
The True Cost of Assisted Living in 2025 – And How Families Are Paying For It
Understanding Senior Living Costs: Pricing Models, Discounts & Financial Assistance

Touring a community? Use this expert-backed checklist to stay organized, ask the right questions, and find the perfect fit.
We'll send you a PDF version of the touring checklist.