


Total staff
986
Employees
973
Contractors
13
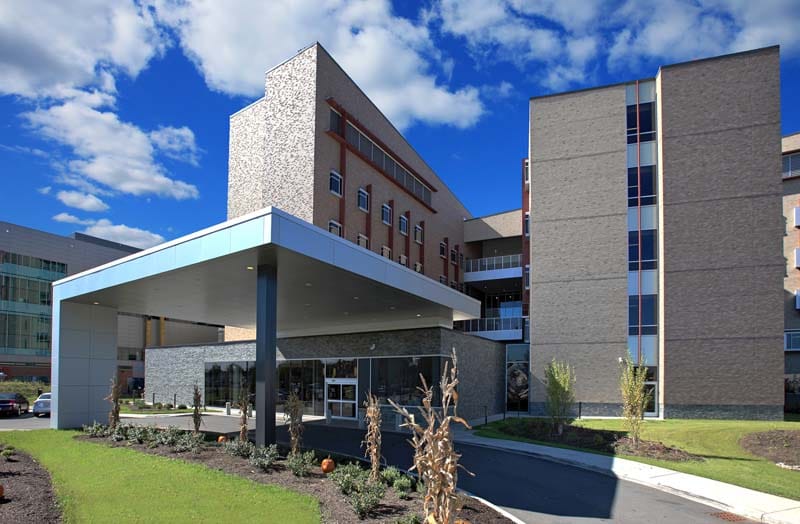
Serving residents in Buffalo, New York, Terrace View Long-Term Care is a skilled nursing home at 462 Grider Street. The 390-bed home provides ongoing nursing care, rehabilitation, and assistance with daily personal needs. Residents receive an average of 5 hours and 12 minutes of nursing care each day. Care is delivered by registered nurses, licensed practical nurses, nurse aides, and other clinical professionals.
The surrounding neighborhood has a Walk Score of 46. A few nearby services are walkable, but most errands and appointments require transportation. Families considering the home’s location should take note of this if they plan to visit regularly.
Visiting Terrace View is one of the best ways to learn more about the community. Families can tour the care areas, observe daily routines, and meet members of the care team. It is also a great way to see whether the home’s environment and approach to care suit a loved one’s individual needs.
| Staff type | Hours / Day / Resident | vs state avg |
|---|---|---|
|
Registered Nurse (RN)
| 56m per day | ▲ 33% State avg: 42m per day · National avg: 41m per day |
|
LPN / LVN
| 1h 5m per day | ▲ 41% State avg: 46m per day · National avg: 52m per day |
|
Nurse Aide
| 2h 39m per day | ▲ 21% State avg: 2h 11m per day · National avg: 2h 21m per day |
|
Weekend Total Nursing
| 4h 9m per day | ▲ 31% State avg: 3h 10m per day · National avg: 3h 26m per day |
|
Physical Therapist
| 4m per day | ▼ 48% State avg: 7m per day · National avg: 4m per day |
|
Weekend RN
| 39m per day | ▲ 39% State avg: 28m per day · National avg: 29m per day |
Reporting period: October 1 – December 31, 2025 (Q4 2025). Source: CMS Payroll-Based Journal report.
Manages medical care and health needs.
Assists with medical care and medications.
Helps with daily care and mobility.
Total hours from contractors
2,399 contractor hours this quarter
| Certified Nursing Assistant | 467 | 5 | 472 | 92,627 | 92 | 100% | 7.5 |
| Licensed Practical Nurse | 213 | 0 | 213 | 37,796 | 92 | 100% | 7.8 |
| Registered Nurse | 162 | 1 | 163 | 26,054 | 92 | 100% | 8.6 |
| Clinical Nurse Specialist | 31 | 0 | 31 | 6,414 | 83 | 90% | 7.9 |
| Qualified Activities Professional | 26 | 0 | 26 | 3,930 | 92 | 100% | 8.5 |
| Mental Health Service Worker | 15 | 0 | 15 | 3,186 | 63 | 68% | 7.6 |
| Speech Language Pathologist | 13 | 0 | 13 | 2,782 | 76 | 83% | 7.2 |
| Physical Therapy Assistant | 12 | 0 | 12 | 2,490 | 77 | 84% | 7.3 |
| Respiratory Therapy Technician | 10 | 0 | 10 | 2,137 | 78 | 85% | 7.3 |
| Physical Therapy Aide | 8 | 0 | 8 | 1,680 | 75 | 82% | 7.2 |
| Other Physician | 1 | 3 | 4 | 1,112 | 64 | 70% | 8 |
| Other Dietary Services Staff | 5 | 0 | 5 | 919 | 69 | 75% | 7.8 |
| Qualified Social Worker | 4 | 0 | 4 | 775 | 63 | 68% | 7.3 |
| Physician Assistant | 0 | 3 | 3 | 758 | 57 | 62% | 8.7 |
| Therapeutic Recreation Specialist | 2 | 0 | 2 | 512 | 41 | 45% | 7.1 |
| Medical Director | 0 | 1 | 1 | 480 | 48 | 52% | 10 |
| Occupational Therapy Assistant | 2 | 0 | 2 | 323 | 48 | 52% | 6.7 |
| Dental Services Staff | 1 | 0 | 1 | 198 | 27 | 29% | 7.3 |
| Nurse Practitioner | 1 | 0 | 1 | 143 | 19 | 21% | 7.5 |
Federal penalties imposed by CMS for regulatory violations, including civil money penalties (fines) and denials of payment for new Medicare/Medicaid admissions.
Source: CMS Penalties Database
No penalties in the past 3 years
No civil money penalties or payment denials were reported in the last 3 years.
These measures show how residents usually do over time at this home, based on health outcomes and preventive care.
New York average: 9.8
New York average: 18.1
New York average: 16.4%
New York average: 16.6%
New York average: 21.4%
New York average: 3.0%
New York average: 7.2%
New York average: 1.4%
New York average: 6.1%
New York average: 18.1%
New York average: 12.6%
New York average: 91.4%
New York average: 95.2%
New York average: 1.71
New York average: 1.35
New York average: 76.6%
New York average: 1.3%
New York average: 78.8%
New York average: 20.6%
New York average: 9.7%
New York average: 0.8%
New York average: 53.7%
New York average: 50.6%
Quality measures are calculated from Minimum Data Set (MDS) assessments. For most measures, lower percentages indicate better care quality.
Source: CMS Long-Term Care Facility Characteristics (Data as of Jan 2026)
Residents meet regularly to discuss policies, care quality, and activities
Organized group of residents that meets regularly to discuss facility policies, quality of life, and activities.
Data sourced from CMS Long-Term Care Facility Characteristics quarterly report. Payer mix reflects the current resident census by primary payment source.
![]() 3.6 miles from city center
3.6 miles from city center
![]() Estimated distance in miles from Buffalo's city center to Terrace View Long-Term Care's address, calculated via Google Maps.
Estimated distance in miles from Buffalo's city center to Terrace View Long-Term Care's address, calculated via Google Maps.
Add your location
Info below is compiled from CMS reports & the NY State Dept. of Health (NYSDOH), senior community websites & trusted data sources such as Walk Score & BBB.
Communities are listed from highest to lowest based on our ranking methodology.
| Schofield Residence Nursing Facility | NH ADC HC HOS PC SNF | Buffalo (Elmwood North) | 120
Facility
120
NY AVG
160
Rank
#408 / 739 |
85.3%
Facility
85.3%
NY AVG
87.1
Rank
#332 / 410 | -2% | 4.10
Facility
4.10
NY AVG
3.58
Rank
#70 / 394 | -69% | +14% | $0
Facility
$0
NY AVG
$67.6k
Rank
#1 / 402 | - | 15
Facility
15
NY AVG
18.5
Rank
#163 / 401 | 3.8
Facility
3.8
NY AVG
5.1
Rank
#116 / 401 | - | 102 | - |
60
Facility
60
NY AVG
63
Rank
#693 / 1169 | James Cambell | $15.6MFiscal year ending 12/2023
Facility
$15.6MFiscal year ending 12/2023
NY AVG
$32.0M
Rank
#230 / 388 | $8.9MFiscal year ending 12/2023
Facility
$8.9MFiscal year ending 12/2023
NY AVG
$10.7M
Rank
#251 / 388 | 57.3%Fiscal year ending 12/2023
Facility
57.3%Fiscal year ending 12/2023
NY AVG
37%
Rank
#271 / 388 | 335603 | ||||
| Terrace View Long-Term Care | NH PC SNF | Buffalo (East Side) | 390
Facility
390
NY AVG
160
Rank
#27 / 739 |
97.6%
Facility
97.6%
NY AVG
87.1
Rank
#80 / 410 | +12% | 5.21
Facility
5.21
NY AVG
3.58
Rank
#13 / 394 | +31% | +45% | $47.5k
Facility
$47.5k
NY AVG
$67.6k
Rank
#354 / 402 | - | 15
Facility
15
NY AVG
18.5
Rank
#163 / 401 | 5.0
Facility
5.0
NY AVG
5.1
Rank
#212 / 401 | - | 381 | - |
46
Facility
46
NY AVG
63
Rank
#811 / 1169 | - | - | - | - | 335650 | ||||
| The Grand Rehabilitation and Nursing at Delaware Park | NH RC SNF | Buffalo (Elmwood Village) | 95
Facility
95
NY AVG
160
Rank
#517 / 739 |
96.9%
Facility
96.9%
NY AVG
87.1
Rank
#109 / 410 | +11% | 3.28
Facility
3.28
NY AVG
3.58
Rank
#186 / 394 | -40% | -8% | $0
Facility
$0
NY AVG
$67.6k
Rank
#1 / 402 | - | 19
Facility
19
NY AVG
18.5
Rank
#231 / 401 | 4.8
Facility
4.8
NY AVG
5.1
Rank
#202 / 401 | - | 92 | - |
0
Facility
0
NY AVG
63
Rank
#1154 / 1169 | Elliot Strauss | $10.0MFiscal year ending 12/2023
Facility
$10.0MFiscal year ending 12/2023
NY AVG
$32.0M
Rank
#365 / 388 | $7.5MFiscal year ending 12/2023
Facility
$7.5MFiscal year ending 12/2023
NY AVG
$10.7M
Rank
#332 / 388 | 74.8%Fiscal year ending 12/2023
Facility
74.8%Fiscal year ending 12/2023
NY AVG
37%
Rank
#24 / 388 | 335640 | ||||
| Ellicott Center for Rehabilitation and Nursing | NH SNF | Buffalo (Lakeview) | 160
Facility
160
NY AVG
160
Rank
#295 / 739 |
90.6%
Facility
90.6%
NY AVG
87.1
Rank
#277 / 410 | +4% | 3.29
Facility
3.29
NY AVG
3.58
Rank
#186 / 394 | -30% | -8% | $10.9k
Facility
$10.9k
NY AVG
$67.6k
Rank
#320 / 402 | 66
Facility
66
NY AVG
83
Rank
#554 / 608 | 32
Facility
32
NY AVG
18.5
Rank
#360 / 401 | 8.0
Facility
8.0
NY AVG
5.1
Rank
#351 / 401 | 1 | 145 | - |
89
Facility
89
NY AVG
63
Rank
#285 / 1169 | Denise Marciano | $17.1MFiscal year ending 12/2023
Facility
$17.1MFiscal year ending 12/2023
NY AVG
$32.0M
Rank
#282 / 388 | $6.4MFiscal year ending 12/2023
Facility
$6.4MFiscal year ending 12/2023
NY AVG
$10.7M
Rank
#254 / 388 | 37.2%Fiscal year ending 12/2023
Facility
37.2%Fiscal year ending 12/2023
NY AVG
37%
Rank
#117 / 388 | 335437 | ||||
| Buffalo Center for Rehabilitation and Nursing | NH SNF | Buffalo (Masten Park) | 200
Facility
200
NY AVG
160
Rank
#166 / 739 |
95.0%
Facility
95.0%
NY AVG
87.1
Rank
#174 / 410 | +9% | 4.43
Facility
4.43
NY AVG
3.58
Rank
#49 / 394 | -39% | +24% | $139.7k
Facility
$139.7k
NY AVG
$67.6k
Rank
#385 / 402 | 63
Facility
63
NY AVG
83
Rank
#587 / 608 | 36
Facility
36
NY AVG
18.5
Rank
#366 / 401 | 6.0
Facility
6.0
NY AVG
5.1
Rank
#281 / 401 | 3 | 190 | - |
76
Facility
76
NY AVG
63
Rank
#514 / 1169 | David Denny | $29.7MFiscal year ending 12/2023
Facility
$29.7MFiscal year ending 12/2023
NY AVG
$32.0M
Rank
#182 / 388 | $8.4MFiscal year ending 12/2023
Facility
$8.4MFiscal year ending 12/2023
NY AVG
$10.7M
Rank
#218 / 388 | 28.2%Fiscal year ending 12/2023
Facility
28.2%Fiscal year ending 12/2023
NY AVG
37%
Rank
#331 / 388 | 335638 |
Terrace View Long-Term Care is located in Buffalo, New York State.
Here are the financial assistance programs available to residents in New York State.
Terrace View Long-Term Care is in the East Side neighborhood.
Terrace View Long-Term Care has a walk score of 46. Somewhat walkable. A few nearby services may be reachable on foot, but most trips require transportation.
No, Terrace View Long-Term Care has a no-pet policy.
Terrace View Long-Term Care is a government-operated nursing facility.
Yes — there is 1 photo of Terrace View Long-Term Care in the photo gallery on this page.
Terrace View Long-Term Care is located at 462 Grider St, Buffalo, NY 14215.
(716) 551-7100 will put you in contact with the team at Terrace View Long-Term Care.
Care Cost Calculator: See Prices in Your Area
Nursing Home Data Explorer
Don’t Wait Too Long: 7 Red Flag Signs Your Parent Needs Assisted Living Now
The True Cost of Assisted Living in 2025 – And How Families Are Paying For It
Understanding Senior Living Costs: Pricing Models, Discounts & Financial Assistance


