


Total staff
143
Employees
128
Contractors
15
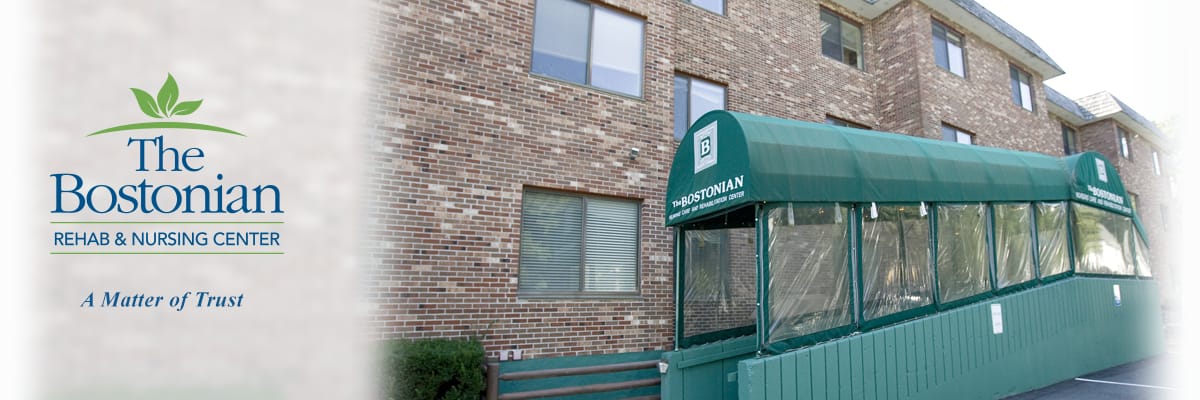


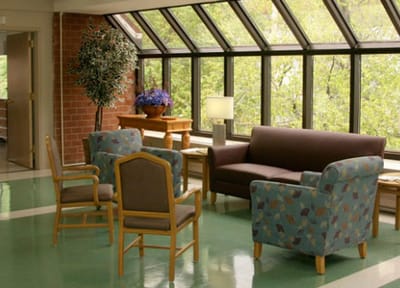

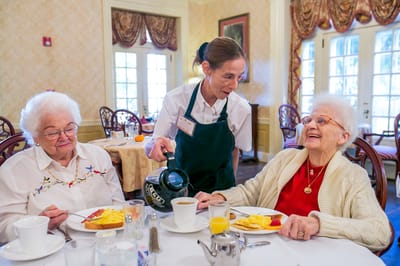


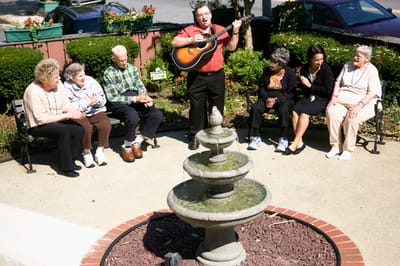


Just a few minutes away from Boston, The Bostonian Nursing Care and Rehabilitation in Dorherster is a community focused on creating an efficient rehabilitative approach to skilled nursing and rehab in order while enhancing their quality of life. They have a team of well-trained care staff who deliver a multidisciplinary approach to nursing when providing tailored care– ensuring to deliver service with compassion, kindness, and professionalism. The Bostonian is guaranteed to create connections and provide engaging experiences among members of the community while maintaining a balance of independence and extra comprehensive assistance.
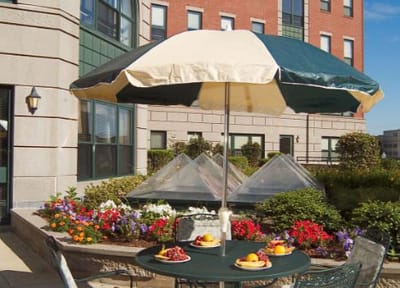
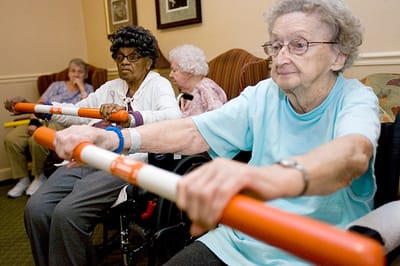
The Bostonian offers a range of services such as short-term and sub-acute care, skilled nursing, rehabilitative services, and long-term care. They boast their exclusive BaneCare Day program that creates engaging social activities such as fitness exercises, religious services, theater and movie outings, visits to local shops, and full-service hair dressing– all included to stimulate and enrich the wellness of its residents.
| Staff type | Hours / Day / Resident | vs state avg |
|---|---|---|
|
Registered Nurse (RN)
| 33m per day | ▼ 15% State avg: 39m per day · National avg: 41m per day |
|
LPN / LVN
| 1h 1m per day | ▲ 5% State avg: 58m per day · National avg: 52m per day |
|
Nurse Aide
| 2h 6m per day | ▼ 7% State avg: 2h 16m per day · National avg: 2h 21m per day |
|
Weekend Total Nursing
| 3h 23m per day | ■ Avg State avg: 3h 27m per day · National avg: 3h 26m per day |
|
Physical Therapist
| 3m per day | ▼ 28% State avg: 4m per day · National avg: 4m per day |
|
Weekend RN
| 23m per day | ▼ 19% State avg: 28m per day · National avg: 29m per day |
Reporting period: October 1 – December 31, 2025 (Q4 2025). Source: CMS Payroll-Based Journal report.
Manages medical care and health needs.
Assists with medical care and medications.
Helps with daily care and mobility.
Total hours from contractors
2,837 contractor hours this quarter
| Certified Nursing Assistant | 58 | 0 | 58 | 20,839 | 92 | 100% | 8 |
| Licensed Practical Nurse | 27 | 0 | 27 | 7,427 | 92 | 100% | 8.4 |
| Registered Nurse | 15 | 0 | 15 | 4,436 | 92 | 100% | 8.2 |
| RN Director of Nursing | 11 | 0 | 11 | 2,777 | 89 | 97% | 8 |
| Other Dietary Services Staff | 4 | 0 | 4 | 1,243 | 91 | 99% | 7.6 |
| Physical Therapy Aide | 0 | 2 | 2 | 909 | 67 | 73% | 7.3 |
| Clinical Nurse Specialist | 5 | 0 | 5 | 714 | 68 | 74% | 4.9 |
| Speech Language Pathologist | 0 | 4 | 4 | 566 | 75 | 82% | 7.1 |
| Administrator | 1 | 0 | 1 | 488 | 61 | 66% | 8 |
| Respiratory Therapy Technician | 0 | 3 | 3 | 484 | 69 | 75% | 6.7 |
| Dietitian | 1 | 0 | 1 | 468 | 62 | 67% | 7.5 |
| Qualified Social Worker | 0 | 1 | 1 | 446 | 59 | 64% | 7.6 |
| Nurse Practitioner | 1 | 0 | 1 | 432 | 54 | 59% | 8 |
| Physical Therapy Assistant | 0 | 3 | 3 | 404 | 63 | 68% | 6.4 |
| Occupational Therapy Aide | 1 | 0 | 1 | 332 | 45 | 49% | 7.4 |
| Mental Health Service Worker | 3 | 0 | 3 | 309 | 40 | 43% | 7.7 |
| Nurse Aide in Training | 1 | 0 | 1 | 300 | 31 | 34% | 9.7 |
| Occupational Therapy Assistant | 0 | 1 | 1 | 18 | 6 | 7% | 3 |
| Medical Director | 0 | 1 | 1 | 10 | 8 | 9% | 1.3 |
Federal penalties imposed by CMS for regulatory violations, including civil money penalties (fines) and denials of payment for new Medicare/Medicaid admissions.
Source: CMS Penalties Database (Data as of Jan 2026)
Massachusetts average: $72K
Massachusetts average: 1.7
Massachusetts average: 0.1
No penalties in the past 3 years
No civil money penalties or payment denials were reported in the last 3 years.
These measures show how residents usually do over time at this home, based on health outcomes and preventive care.
Massachusetts average: 10.2
Massachusetts average: 20.0
Massachusetts average: 18.7%
Massachusetts average: 19.3%
Massachusetts average: 22.1%
Massachusetts average: 3.6%
Massachusetts average: 4.7%
Massachusetts average: 2.1%
Massachusetts average: 5.2%
Massachusetts average: 10.7%
Massachusetts average: 20.3%
Massachusetts average: 91.9%
Massachusetts average: 94.8%
Massachusetts average: 1.86
Massachusetts average: 1.54
Massachusetts average: 76.7%
Massachusetts average: 1.3%
Massachusetts average: 77.7%
Massachusetts average: 25.8%
Massachusetts average: 11.8%
Massachusetts average: 0.8%
Massachusetts average: 53.7%
Massachusetts average: 50.6%
Quality measures are calculated from Minimum Data Set (MDS) assessments. For most measures, lower percentages indicate better care quality.
23% of new residents, usually for short-term rehab.
60% of new residents, often for short stays.
16% of new residents, often for long-term daily care.
Source: CMS Long-Term Care Facility Characteristics (Data as of Jan 2026)
Residents meet regularly to discuss policies, care quality, and activities
Organized group of residents that meets regularly to discuss facility policies, quality of life, and activities.
Data sourced from CMS Long-Term Care Facility Characteristics quarterly report. Payer mix reflects the current resident census by primary payment source.
Historical financial and operational data for The Bostonian Skilled Nursing & Rehab from 2011–2023, based on CMS SNF Cost Reports.
Key figures below are for fiscal year ending in 12/2023.
Based on CMS SNF Cost Report for fiscal year ending in 12/2023.
Residents typically stay for brief periods, with frequent admissions and discharges throughout the year.
Most new residents arrive under private pay (60% of admissions), and a typical private pay stay runs around 1 - 2 months.
Coverage residents most often arrive under.
Coverage residents most often leave under.
![]() 1.2 miles from city center
1.2 miles from city center
![]() Estimated distance in miles from Dorchester's city center to The Bostonian Skilled Nursing & Rehab's address, calculated via Google Maps.
— 2.93 miles to nearest hospital (Beth Israel Deaconess Hospitalu2013Milton)
Estimated distance in miles from Dorchester's city center to The Bostonian Skilled Nursing & Rehab's address, calculated via Google Maps.
— 2.93 miles to nearest hospital (Beth Israel Deaconess Hospitalu2013Milton)
Add your location
Info below is compiled from CMS reports & the MA Executive Office of Elder Affairs, senior community websites & trusted data sources such as Walk Score & BBB.
Communities are listed from highest to lowest based on our ranking methodology.
| The Boston Home Inc | NH RC SNF | Dorchester Center (Dorchester) | 96
Facility
96
MA AVG
94
Rank
#108 / 276 |
97.0%
Facility
97.0%
MA AVG
78.3
Rank
#3 / 81 | +24% | 5.17
Facility
5.17
MA AVG
3.93
Rank
#7 / 86 | -18% | +32% | $0
Facility
$0
MA AVG
$76.6k
Rank
#1 / 87 | 8
Facility
8
MA AVG
32.7
Rank
#7 / 86 | 8.0
Facility
8.0
MA AVG
7.2
Rank
#57 / 86 | - | 93 | - |
76
Facility
76
MA AVG
53
Rank
#146 / 498 | Christine Reilly | $15.6MFiscal year ending 12/2023
Facility
$15.6MFiscal year ending 12/2023
MA AVG
$17.4M
Rank
#34 / 89 | $14.5MFiscal year ending 12/2023
Facility
$14.5MFiscal year ending 12/2023
MA AVG
$6.5M
Rank
#11 / 89 | 92.6%Fiscal year ending 12/2023
Facility
92.6%Fiscal year ending 12/2023
MA AVG
43.6%
Rank
#11 / 89 | 225434 | ||||
| Hebrew SeniorLife | NH AL HC HOS IL MC PC SNF | Boston (Roslindale) | 50
Facility
50
MA AVG
94
Rank
#232 / 276 |
63.2%
Facility
63.2%
MA AVG
78.3
Rank
#71 / 81 | -19% | 4.65
Facility
4.65
MA AVG
3.93
Rank
#12 / 86 | +18% | +18% | $0
Facility
$0
MA AVG
$76.6k
Rank
#1 / 87 | 11
Facility
11
MA AVG
32.7
Rank
#9 / 86 | 3.7
Facility
3.7
MA AVG
7.2
Rank
#13 / 86 | - | 32 | - |
38
Facility
38
MA AVG
53
Rank
#324 / 498 | - | - | - | - | 225759 | ||||
| The Bostonian Skilled Nursing & Rehab | NH HOS RC SNF | Dorchester | 121
Facility
121
MA AVG
94
Rank
#62 / 276 |
90.5%
Facility
90.5%
MA AVG
78.3
Rank
#26 / 81 | +16% | 3.93
Facility
3.93
MA AVG
3.93
Rank
#39 / 86 | -18% | 0% | $8.6k
Facility
$8.6k
MA AVG
$76.6k
Rank
#51 / 87 | 21
Facility
21
MA AVG
32.7
Rank
#28 / 86 | 5.3
Facility
5.3
MA AVG
7.2
Rank
#30 / 86 | 1 | 110 | - |
71
Facility
71
MA AVG
53
Rank
#165 / 498 | Bostonian Foundation Inc | $13.0MFiscal year ending 12/2023
Facility
$13.0MFiscal year ending 12/2023
MA AVG
$17.4M
Rank
#62 / 89 | $7.4MFiscal year ending 12/2023
Facility
$7.4MFiscal year ending 12/2023
MA AVG
$6.5M
Rank
#60 / 89 | 56.5%Fiscal year ending 12/2023
Facility
56.5%Fiscal year ending 12/2023
MA AVG
43.6%
Rank
#27 / 89 | 225436 | ||||
| St. Joseph Rehabilitation and Nursing Center | NH HOS MC SNF | Dorchester | 123
Facility
123
MA AVG
94
Rank
#55 / 276 |
31.7%
Facility
31.7%
MA AVG
78.3
Rank
#78 / 81 | -60% | 3.90
Facility
3.90
MA AVG
3.93
Rank
#39 / 86 | +40% | -1% | $82.6k
Facility
$82.6k
MA AVG
$76.6k
Rank
#77 / 87 | 50
Facility
50
MA AVG
32.7
Rank
#75 / 86 | 8.3
Facility
8.3
MA AVG
7.2
Rank
#58 / 86 | 6 | 39 | A+ |
83
Facility
83
MA AVG
53
Rank
#102 / 498 | Landmark Health Solutions, LLC | $15.5MFiscal year ending 12/2023
Facility
$15.5MFiscal year ending 12/2023
MA AVG
$17.4M
Rank
#47 / 89 | $9.9MFiscal year ending 12/2023
Facility
$9.9MFiscal year ending 12/2023
MA AVG
$6.5M
Rank
#50 / 89 | 63.6%Fiscal year ending 12/2023
Facility
63.6%Fiscal year ending 12/2023
MA AVG
43.6%
Rank
#49 / 89 | 225493 | ||||
| Sherrill House | NH HOS MC PC SNF | Boston (Jamaica Hills) | 196
Facility
196
MA AVG
94
Rank
#9 / 276 |
84.3%
Facility
84.3%
MA AVG
78.3
Rank
#38 / 81 | +8% | 3.94
Facility
3.94
MA AVG
3.93
Rank
#39 / 86 | +88% | 0% | $0
Facility
$0
MA AVG
$76.6k
Rank
#1 / 87 | 27
Facility
27
MA AVG
32.7
Rank
#40 / 86 | 3.9
Facility
3.9
MA AVG
7.2
Rank
#15 / 86 | - | 165 | - |
78
Facility
78
MA AVG
53
Rank
#133 / 498 | Joao Santos | $24.8MFiscal year ending 12/2023
Facility
$24.8MFiscal year ending 12/2023
MA AVG
$17.4M
Rank
#12 / 89 | $20.1MFiscal year ending 12/2023
Facility
$20.1MFiscal year ending 12/2023
MA AVG
$6.5M
Rank
#5 / 89 | 81.1%Fiscal year ending 12/2023
Facility
81.1%Fiscal year ending 12/2023
MA AVG
43.6%
Rank
#8 / 89 | 225201 |
The Bostonian Skilled Nursing & Rehab is located in Dorchester, Massachusetts.
Here are the financial assistance programs available to residents in Massachusetts.
The Bostonian Skilled Nursing & Rehab is in the Dorchester neighborhood.
The Bostonian Skilled Nursing & Rehab has a walk score of 71. Very walkable. Most errands can be accomplished on foot, and many essentials are within a short walk.
The Bostonian Skilled Nursing & Rehab's occupancy is 87.8%.
No, The Bostonian Skilled Nursing & Rehab has a no-pet policy.
The Bostonian Skilled Nursing & Rehab is registered as a non-profit.
Yes — there are 19 photos of The Bostonian Skilled Nursing & Rehab in the photo gallery on this page.
The Bostonian Skilled Nursing & Rehab is located at 337 Neponset Ave, Dorchester, MA 02122.
Care Cost Calculator: See Prices in Your Area
Nursing Home Data Explorer
Don’t Wait Too Long: 7 Red Flag Signs Your Parent Needs Assisted Living Now
The True Cost of Assisted Living in 2025 – And How Families Are Paying For It
Understanding Senior Living Costs: Pricing Models, Discounts & Financial Assistance


