


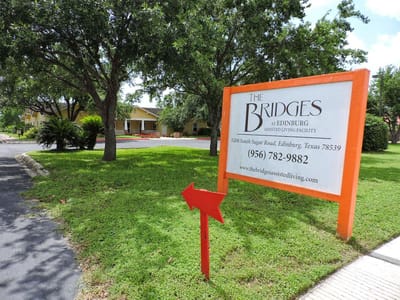
The Bridges at Edinburg Assisted Living Homes
Assisted Living, Nursing Home, Adult Day Care, Memory Care & Respite Care · Edinburg, TX
The Bridges at Edinburg Assisted Living Homes
Assisted Living, Nursing Home, Adult Day Care, Memory Care & Respite Care · Edinburg, TX
Overview of The Bridges at Edinburg Assisted Living Homes
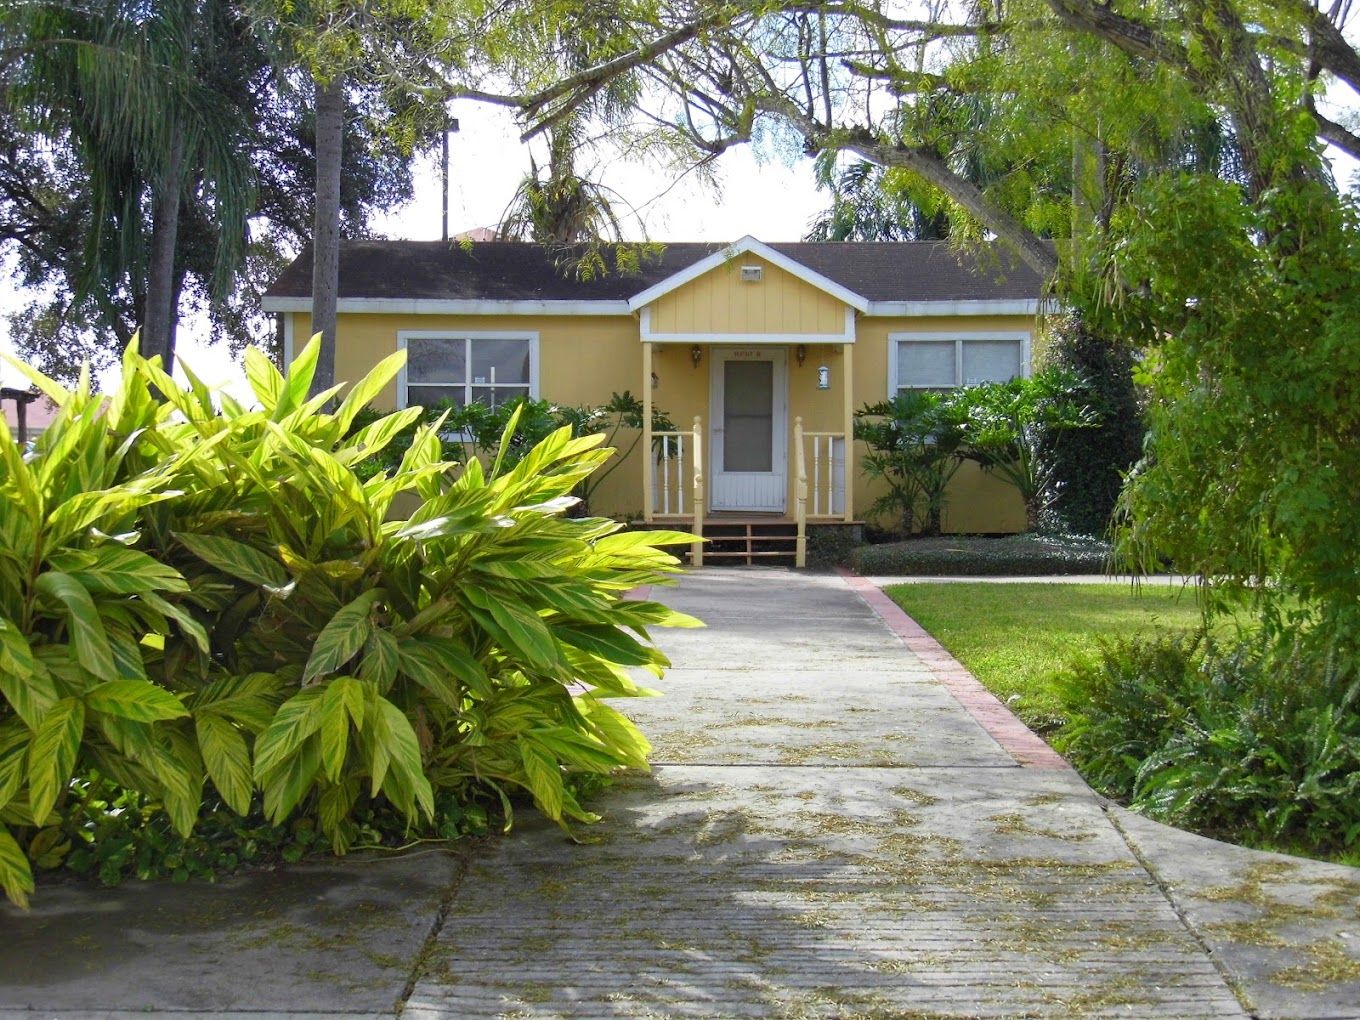
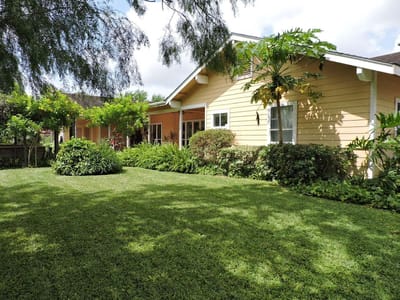
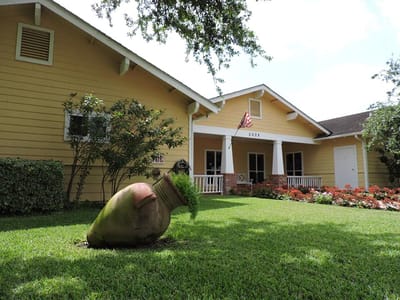
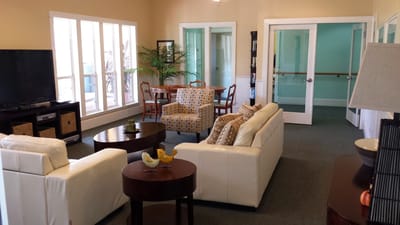
Settled in the vibrant neighborhood of Edinburg, TX, The Bridges at Edinburg Assisted Living Homes is an enticing community that offers assisted living, memory care, and respite services. A wide array of well-appointed and spacious private accommodations with floor plans are available for its residents. Having a highly trained and compassionate team, the community provides round-the-clock care and assistance to ensure comfort and security. In terms of memory care, the community also provides a journey of compassion, engagement, and technology-driven support to accommodate different levels of Memory Care needs.
With its top-notch amenities and services, residents can enjoy three well-balanced nutritious chef-prepared meals, housekeeping and personal laundry services, 24/7 health monitoring, transportation services, and many more. Create unforgettable memories with new companions at the beautifully created private gardens and other common spaces. With The Bridges at Edinburg Assisted Living Homes, seniors can truly enjoy a wonderful retirement.
16-bed community
A smaller, more intimate setting that may offer a quieter environment and closer staff-resident interactions.
Walk Score: 16 / 100
Car-dependent. Most errands require a car, with limited nearby walkable options.
About this community
Facility TypeType B
CountyHidalgo
The Bridges at Edinburg Assisted Living Homes is legally operated by Assisted Living Partnership I, Ltd.
No Alzheimer's certification
Inspection History
In Texas, the Health and Human Services Commission (HHSC) is the primary regulatory body that conducts unannounced inspections and publishes quality reports for all long-term care homes.
Since 2023 · 3 years of data
0 citations
Inspection Scorecard
 This scorecard compares key inspection, citation, and complaint metrics at this facility against the Texas state average. Metrics rated ≥15% worse than average are highlighted in red; those ≥15% better are highlighted in green.
Since 2023 vs. Texas state average
Overall vs. TX average
0 Worse
No metrics in this bucket.
1 Better
Metrics better than Texas average:
• Total citations (100% below)
• Total citations (100% below)
Latest Inspection
January 24, 2023
Annual Inspection
Citations
| This Facility | TX Average | vs. TX Avg |
|---|---|---|---|
|
Total citations
| 0 | 6 | This facility has 100% fewer total citations than a typical Texas assisted living residence (0 vs. TX avg 6).↓ 100% better |
Inspection Reports Summary
An editor-reviewed summary of the themes and findings across this facility's recent inspection reports.
- The January 24, 2023 annual inspection found no deficiencies or violations of state or life safety standards.
- No complaints were filed or substantiated in the period leading up to the most recent inspection.
- The facility maintained a clean record with no health code or safety citations across all inspections.
What does this home offer?
Staff to Resident Ratio: 1:1
Building Type: Single-story
Transportation Services
Places of interest near The Bridges at Edinburg Assisted Living Homes
![]() 4.4 miles from city center
4.4 miles from city center
![]() Estimated distance in miles from Edinburg's city center to The Bridges at Edinburg Assisted Living Homes's address, calculated via Google Maps.
Estimated distance in miles from Edinburg's city center to The Bridges at Edinburg Assisted Living Homes's address, calculated via Google Maps.
Calculate Travel Distance to The Bridges at Edinburg Assisted Living Homes
Add your location
Compare Assisted Living around Cameron County
The information below is reported by the Texas Health and Human Services Commission.
| Sun Valley Rehabilitation and Healthcare Center | AL HOS MC NH RC SNF | Harlingen (Estrellita Subdivision) | - | 124 | - | 37 | Suite |
| Harlingen Nursing and Rehabilitation Center | AL MC NH RC SNF | Harlingen (Hale Avenue) | - | 120 | - | 49 | Private Rooms |
| Golden Palms Retirement Center and Healthcare | AL IL MC NH RC SNF | Harlingen | - | 60 | - | 50 | - |
| Alta Vista Rehabilitation and Healthcare | AL MC NH SNF | Brownsville (Los Ebanos) | - | 100 | - | 71 | - |
Financial Assistance for
Assisted Living in Texas
The Bridges at Edinburg Assisted Living Homes is located in Edinburg, Texas.
Here are the financial assistance programs available to residents in Texas.
Frequently Asked Questions about The Bridges at Edinburg Assisted Living Homes
What neighborhood is The Bridges at Edinburg Assisted Living Homes in?
The Bridges at Edinburg Assisted Living Homes is in the Acacia Colonia neighborhood of Edinburg.
Who is the owner of The Bridges at Edinburg Assisted Living Homes?
The Bridges at Edinburg Assisted Living Homes is legally operated by Assisted Living Partnership I, Ltd.
Is The Bridges at Edinburg Assisted Living Homes in a walkable area?
The Bridges at Edinburg Assisted Living Homes has a walk score of 16. Car-dependent. Most errands require a car, with limited nearby walkable options.
How many beds does The Bridges at Edinburg Assisted Living Homes have?
The Bridges at Edinburg Assisted Living Homes has 16 beds.
Are there photos of The Bridges at Edinburg Assisted Living Homes?
Yes — there are 5 photos of The Bridges at Edinburg Assisted Living Homes in the photo gallery on this page.
What is the address of The Bridges at Edinburg Assisted Living Homes?
The Bridges at Edinburg Assisted Living Homes is located at 5208 Sugar Rd, Edinburg, TX 78539.
What is the phone number of The Bridges at Edinburg Assisted Living Homes?
(956) 782-9882 will put you in contact with the team at The Bridges at Edinburg Assisted Living Homes.
Guides for Better Senior Living
Care Cost Calculator: See Prices in Your Area
Nursing Home Data Explorer
Don’t Wait Too Long: 7 Red Flag Signs Your Parent Needs Assisted Living Now
The True Cost of Assisted Living in 2025 – And How Families Are Paying For It
Understanding Senior Living Costs: Pricing Models, Discounts & Financial Assistance
Updated on
