The Elms
Nursing Home & Memory Care · Macomb, IL
CMS overall rating Info The Overall CMS Rating is scored from 1 to 5 stars and combines results from health inspections, staffing levels, and quality measures. Health inspections carry the most weight. Staffing and quality scores can increase or decrease the final rating based on performance compared to state and national standards.

The Elms

Nursing Home & Memory Care · Macomb, IL
CMS overall rating Info The Overall CMS Rating is scored from 1 to 5 stars and combines results from health inspections, staffing levels, and quality measures. Health inspections carry the most weight. Staffing and quality scores can increase or decrease the final rating based on performance compared to state and national standards.
Calculator: See prices in your area
The Elms accepts Medicare, Medicaid, and private pay.

Overview of The Elms

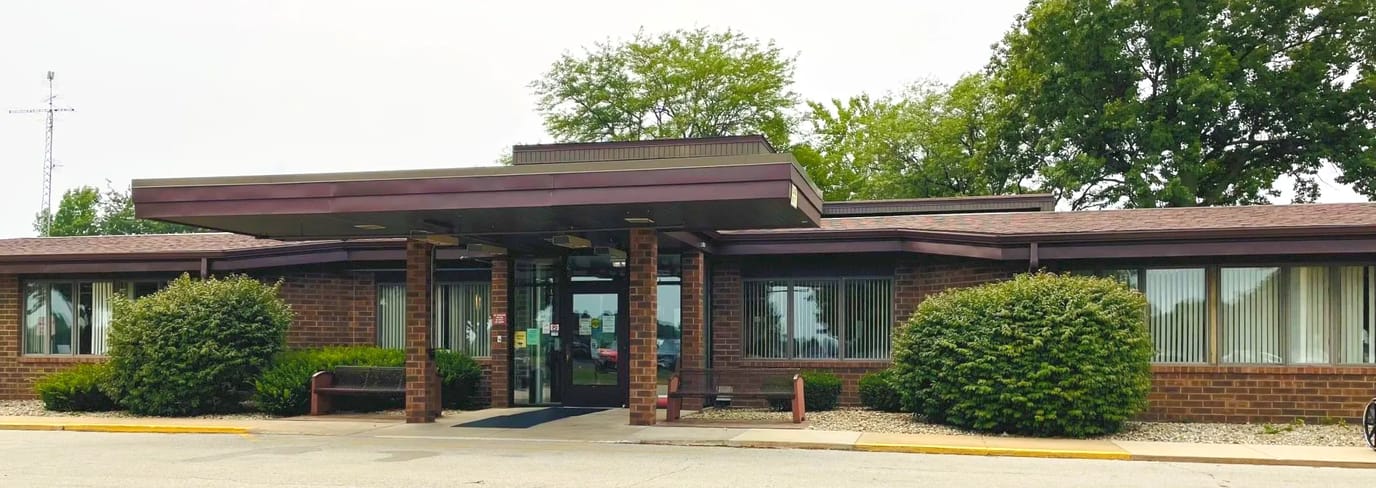
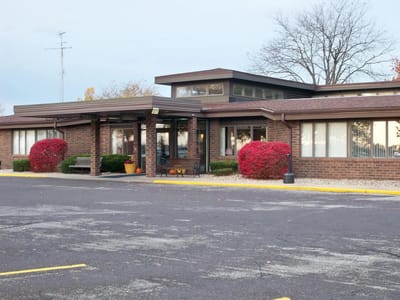
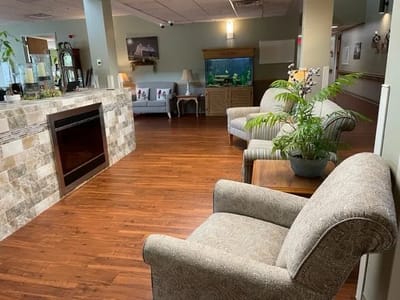
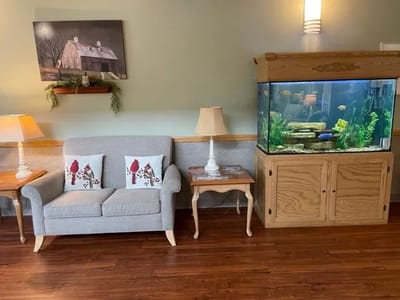
The Elms is a nursing home in Macomb, IL, offering skilled nursing and rehabilitation. Promoting a nurturing and home-like environment, the community ensures older adults are well-cared for during their stay. Residents also experience a maintenance-free lifestyle with 24-hour care, housekeeping, laundry, and nutritious meals. The community also strives to help residents live to their potential through personalized care plans.

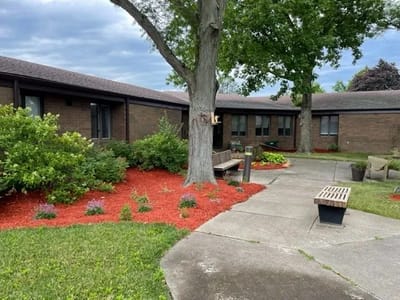
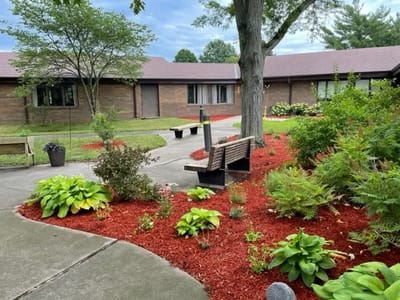
Holiday celebrations, music therapy, and games provide residents with more opportunities to learn and gain meaningful experiences. With paved walking paths and spacious gathering areas, residents can rest and move around comfortably. McDonough District Hospital and bus stops are also located nearby, providing residents with convenient access to healthcare and other needs. This nursing home is a great choice for senior living in Illinois, especially with its commitment to improving older adults’ well-being.

(309) 837-5482

Quality ratings

Measured by Centers for Medicare & Medicaid Services (CMS)

Overall rating Info The Overall CMS Rating combines results from health inspections, staffing levels and quality measures. Health inspections carry the most weight. Staffing and quality scores can increase or decrease the final rating based on performance compared to state and national standards.
▲ 98.4% Above IL avg. ▲ 98.4% Above IL avg.Click the badge to see the full State ranking.Click here to see the full State ranking.
Health Inspection Info Based on the results of the facility's three most recent standard inspections and any complaint investigations. CMS reviews the number, scope, and severity of deficiencies, with more recent findings weighted more heavily.
▲ 80.1% Above IL avg. ▲ 80.1% Above IL avg.Click the badge to see the full State ranking.Click here to see the full State ranking.
Staffing Info Measures average nursing staff hours per resident per day, including Registered Nurses (RNs) and total nursing staff. Ratings are adjusted based on the level of care residents require and are compared to state and national benchmarks.
▲ 133.9% Above IL avg. ▲ 133.9% Above IL avg.Click the badge to see the full State ranking.Click here to see the full State ranking.
Quality Measures Info Based on clinical and physical health indicators reported to CMS, such as hospital readmissions, falls, pressure ulcers, and improvements in mobility. These measures reflect how well residents' health needs are being managed.
▼ 29.0% Below IL avg. ▼ 29.0% Below IL avg.Click the badge to see the full State ranking.Click here to see the full State ranking.

Staffing hours breakdown

Info Daily nursing hours per resident by staff type, reported to CMS. Higher is generally better — compare this facility to state and national averages to see where staffing stands.

Hours per resident per day — compared to Illinois state averages

Total nursing care / resident Info This home is ranked 24th out of 167 homes in Illinois. Total adjusted nursing hours per resident per day, combining RN, LPN, and aide time. CMS adjusts this for case-mix so facilities can be fairly compared.
4h 35m per day
Rank #24 / 167Nurse hours — State benchmarkedThis home is ranked 24th out of 167 homes in Illinois. Shows adjusted nurse hours per resident per day benchmarked to the Illinois average, with a ranking across 167 Illinois SNFs. More hours mean more direct care. The national average is about 3.5 hrs; below 3.0 is a red flag.Click the rank badge to see the full State ranking.Click here to see the full State ranking.
This facility Illinois avg (3h 6m per day)
vs Illinois avg
+48%
Staff typeHours / Day / Residentvs state avg
Weekend Total Nursing Info Combined nursing hours (RN + LPN + Nurse Aide) per resident per day on weekends. Staffing often drops on weekends — this figure reveals whether the facility maintains adequate coverage outside of weekday hours. 4h 6m per day

Types of Care at The Elms

Nursing Home Memory Care

Capacity and availability

This home usually has availability

Occupancy lower than 85% suggests more openings may be available.

Similar occupancy to the Illinois average: 69.3%
Occupancy rate 69.1% Rank #124 / 199Occupancy rate — State benchmarkedThis home is ranked 124th out of 199 homes in Illinois. Shows this facility's occupancy rate versus the Illinois average, with its Statewide rank out of 199. Higher occupancy signals strong local demand and financial stability.Click the rank badge to see the full State ranking.Click here to see the full State ranking.
Avg. Length of Stay 47 days
Occupancy rate
69.1% Rank #124 / 199Occupancy rate — State benchmarkedThis home is ranked 124th out of 199 homes in Illinois. Shows this facility's occupancy rate versus the Illinois average, with its Statewide rank out of 199. Higher occupancy signals strong local demand and financial stability.Click the rank badge to see the full State ranking.Click here to see the full State ranking.
Avg. Length of Stay
47 days
Walk Score
Walk Score: 10 / 100 Rank #594 / 647Walk Score — State benchmarkedThis home is ranked 594th out of 647 homes in Illinois. Shows how walkable this facility's neighborhood is compared to the average Walk Score across Illinois SNFs. Higher scores benefit residents, families, and staff.Click the rank badge to see the full State ranking.Click here to see the full State ranking.
Car-dependent. Most errands require a car, with limited nearby walkable options.

Contact The Elms

Staffing Data

Reporting period: October 1 – December 31, 2025 (Q4 2025). Source: CMS Payroll-Based Journal report.

Total staff 217
Employees 88
Contractors 129
Staff to resident ratio 2.93:1
63% better than Illinois average
Illinois average ratio: 1.80:1 Illinois average ratio: 1.80:1See full Illinois ranking
Avg staff/day 49
Average shift 7.4 hours
0% compared with Illinois average
Illinois average: 7.6 hours Illinois average shift: 7.6 hoursSee full Illinois ranking
Total staff hours (quarter) 33,252

Nursing staff breakdown

Q4 2025 · Oct 1 – Dec 31 More info This data comes from the CMS Payroll-Based Journal report covering October 1 – December 31, 2025.
Registered Nurse

Manages medical care and health needs.

RN Staff 33
Average shift length Info Average shift length. Calculated as total hours divided by days worked and average staff per day. 7.9 hours

This role is partially covered by contractors.

Licensed Practical Nurse

Assists with medical care and medications.

LPN Staff 21
Average shift length Info Average shift length. Calculated as total hours divided by days worked and average staff per day. 7.7 hours

This role is partially covered by contractors.

Certified Nursing Assistant

Helps with daily care and mobility.

CNA Staff 123
Average shift length Info Average shift length. Calculated as total hours divided by days worked and average staff per day. 7.6 hours

This role is partially covered by contractors.

Contractor staffing

Q4 2025 · Oct 1 – Dec 31 More info This data comes from the CMS Payroll-Based Journal report covering October 1 – December 31, 2025.

Total hours from contractors

11.9%

3,968 contractor hours this quarter

Certified Nursing Assistant: 68 Registered Nurse: 18 Other Physician: 14 Licensed Practical Nurse: 13 Physical Therapy Assistant: 4 Speech Language Pathologist: 3 Respiratory Therapy Technician: 2 Qualified Social Worker: 2 Medical Director: 1 Physical Therapy Aide: 1 Occupational Therapy Aide: 1 Occupational Therapy Assistant: 1 Feeding Assistant: 1

Staff by category

Q4 2025 · Oct 1 – Dec 31 More info This data comes from the CMS Payroll-Based Journal report covering October 1 – December 31, 2025.
Certified Nursing Assistant556812319,53992100%7.6
Registered Nurse1518335,98592100%7.9
Licensed Practical Nurse813213,14592100%7.7
Speech Language Pathologist0335146672%5.6
Respiratory Therapy Technician0225006672%4.5
Administrator1014725964%8
Mental Health Service Worker1014725863%8.1
Dietitian1014645863%8
Clinical Nurse Specialist1014485762%7.9
Physical Therapy Assistant0444386368%5
Dental Services Staff1014285560%7.8
Other Dietary Services Staff3033565560%6.5
Nurse Practitioner2021802325%7.8
Other Physician014141744953%2.9
Occupational Therapy Assistant0114267%7
Physical Therapy Aide011341112%3
Occupational Therapy Aide011321415%2.3
Feeding Assistant0111233%4
Qualified Social Worker0221133%3.7
Medical Director011778%1
123 Certified Nursing Assistant
% of Days 100%
33 Registered Nurse
% of Days 100%
21 Licensed Practical Nurse
% of Days 100%
3 Speech Language Pathologist
% of Days 72%
2 Respiratory Therapy Technician
% of Days 72%
1 Administrator
% of Days 64%
1 Mental Health Service Worker
% of Days 63%
1 Dietitian
% of Days 63%
1 Clinical Nurse Specialist
% of Days 62%
4 Physical Therapy Assistant
% of Days 68%
1 Dental Services Staff
% of Days 60%
3 Other Dietary Services Staff
% of Days 60%
2 Nurse Practitioner
% of Days 25%
14 Other Physician
% of Days 53%
1 Occupational Therapy Assistant
% of Days 7%
1 Physical Therapy Aide
% of Days 12%
1 Occupational Therapy Aide
% of Days 15%
1 Feeding Assistant
% of Days 3%
2 Qualified Social Worker
% of Days 3%
1 Medical Director
% of Days 8%

Penalties and fines

Federal penalties imposed by CMS for regulatory violations, including civil money penalties (fines) and denials of payment for new Medicare/Medicaid admissions.

Source: CMS Penalties Database

No penalties in the past 3 years

No civil money penalties or payment denials were reported in the last 3 years.

Quality of care over time

These measures show how residents usually do over time at this home, based on health outcomes and preventive care.

High-risk clinical events score Info A composite score based on pressure ulcers, falls with injury, weight loss, walking ability decline, and activities of daily living decline. 14.6
51% worse than Illinois average

Illinois average: 9.7

Functional decline score Info A composite score based on activities of daily living decline, walking ability decline, and incontinence. 25.8
39% worse than Illinois average

Illinois average: 18.6

Long-stay resident measures
Need for Help with Daily Activities Increased Info Percent of long-stay residents whose need for help with daily activities has increased 22.6%
46% worse than Illinois average

Illinois average: 15.5%

Walking Ability Worsened Info Percent of long-stay residents whose ability to move independently worsened 25.6%
39% worse than Illinois average

Illinois average: 18.4%

Low Risk Residents with Bowel/Bladder Incontinence Info Percent of low risk long-stay residents who lose control of their bowels or bladder 29.2%
35% worse than Illinois average

Illinois average: 21.6%

Falls with Major Injury Info Percent of long-stay residents experiencing one or more falls with major injury 3.2%
In line with Illinois average

Illinois average: 3.4%

High Risk Residents with Pressure Ulcers Info Percent of long-stay high risk residents with pressure ulcers 3.2%
40% better than Illinois average

Illinois average: 5.3%

Urinary Tract Infection Info Percent of long-stay residents with a urinary tract infection 7.0%
288% worse than Illinois average

Illinois average: 1.8%

Lost Too Much Weight Info Percent of long-stay residents who lose too much weight 18.5%
184% worse than Illinois average

Illinois average: 6.5%

Depressive Symptoms Info Percent of long-stay residents who have depressive symptoms 0.0%
100% better than Illinois average

Illinois average: 48.1%

Antipsychotic Use Info Percent of long-stay residents who received an antipsychotic medication 8.8%
57% better than Illinois average

Illinois average: 20.2%

Pneumococcal Vaccine Info Percent of long-stay residents assessed and appropriately given the pneumococcal vaccine 90.7%
In line with Illinois average

Illinois average: 89.2%

Influenza Vaccine Info Percent of long-stay residents assessed and appropriately given the seasonal influenza vaccine 100.0%
9% better than Illinois average

Illinois average: 91.6%

Short-stay resident measures
Pneumococcal Vaccine Info Percent of short-stay residents assessed and appropriately given the pneumococcal vaccine 90.4%
32% better than Illinois average

Illinois average: 68.3%

Antipsychotic medication increase Info Percent of short-stay residents who newly received an antipsychotic medication 0.0%
100% better than Illinois average

Illinois average: 2.3%

Influenza Vaccine Info Percent of short-stay residents assessed and appropriately given the seasonal influenza vaccine 79.4%
26% better than Illinois average

Illinois average: 63.0%

Breakdown by payment type

Medicare

32% of new residents, usually for short-term rehab.

Typical stay 29 days

Private pay

42% of new residents, often for short stays.

Typical stay 2 - 3 months

Medicaid

26% of new residents, often for long-term daily care.

Typical stay 6 - 7 months

Facility Characteristics

Source: CMS Long-Term Care Facility Characteristics (Data as of Jan 2026)

Total residents 74
Medicare
12
16.2% of residents
Medicaid
42
56.8% of residents
Private pay or other
20
27% of residents
Programs & Services
Residents Group

Residents meet regularly to discuss policies, care quality, and activities

Active Resident Council

Organized group of residents that meets regularly to discuss facility policies, quality of life, and activities.

Finances and operations

Governmental community
Operated by county authorities.
Home revenue
$10.9M
Surplus of revenue
$1.1M
Governmental community Operated by county authorities.
Home revenue
$10.9M Rank #121 / 166Revenue — State benchmarkedThis home is ranked 121st out of 166 homes in Illinois. Shows this facility's annual revenue compared to the Illinois SNF average. Higher revenue generally means more resources for staffing and capital — read alongside Payroll %.Click the rank badge to see the full State ranking.Click here to see the full State ranking.
Surplus of revenue
$1.1M
Payroll costs Info The portion of the home's budget spent on staff, including nurses, caregivers, and other employees who support care and operations. Rank #101 / 166Payroll — State benchmarkedThis home is ranked 101st out of 166 homes in Illinois. Shows total annual staff payroll benchmarked to the Illinois average. Higher payroll investment relative to peers often signals better staffing and less reliance on cheaper contract labor.Click the rank badge to see the full State ranking.Click here to see the full State ranking.
$6.2M
57.2% of revenue Rank #44 / 166Payroll % — State benchmarkedThis home is ranked 44th out of 166 homes in Illinois. Shows payroll as a percentage of revenue versus the Illinois average. Well-run Illinois SNFs typically land around 54–67% — the top third Statewide. Below 25% may signal understaffing or heavy agency use — read with Staffing ratings.Click the rank badge to see the full State ranking.Click here to see the full State ranking.
Other operating costs Info All remaining costs needed to run the home, such as food, utilities, building maintenance, supplies and administrative expenses.
$3.5M
Total costs $9.8M

What does this home offer?

Building type icon
Building type icon

Building Type: Single-story

On-site medical care and health services icon

On-site Medical Care and Health Services

Rehabilitative support icon

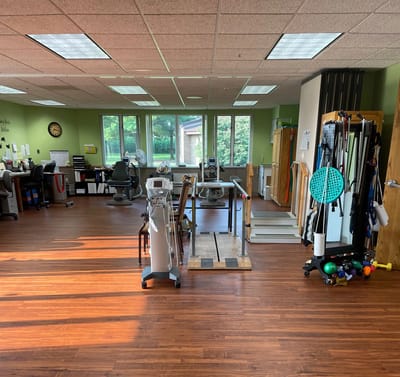
Rehabilitative Support

Beauty services icon

Beauty Services

Dining services icon

Dining Services

Housekeeping icon
Housekeeping icon

Housekeeping Services

Social and recreational activities icon

Social and Recreational Activities

Transportation services icon

Transportation Services

Who this home usually serves

TYPE OF STAY

Mix of rehab and long-term care

This home supports both short-term rehab and long-term care, with residents staying for a wide range of durations.

Places of interest near The Elms

Address 1.6 miles from city center Info Estimated distance in miles from Macomb's city center to The Elms's address, calculated via Google Maps.

Calculate Travel Distance to The Elms

Add your location

Address

Financial Assistance for
Nursing Home in Illinois

The Elms is located in Macomb, Illinois.
Here are the financial assistance programs available to residents in Illinois.

Get Financial aid guidance

Community Care Program

Illinois CCP

Age 60+
General Illinois resident, at risk of nursing home placement.
Income Limits (2025) ~$1,215/month individual
Asset Limits $17,500 individual, excludes home, car
IL

High demand in urban areas; waitlists possible.

Benefits
In-home care (3-5 hours/day) Adult day services ($65/day) Emergency home response systems ($30/month)

Illinois Respite Program

IL Respite (via NFCSP)

Age Caregiver of someone 60+ (or with dementia)
General Illinois resident.
Income Limits No strict limit; prioritizes low-income.
Asset Limits Not applicable.
IL

Limited slots; urban/rural balance.

Benefits
In-home respite (4-6 hours/day) Adult day care (~$65/day) Short-term facility care (up to 5 days)

Supportive Living Program (SLP)

Illinois Medicaid Supportive Living Program

Age 65+ or 22-64 with disability
General Illinois resident, Medicaid-eligible, needs moderate assistance (not nursing home-level).
Income Limits (2025) ~$2,829/month (300% FBR, individual); QIT allowed.
Asset Limits $2,000 (individual), $3,000 (couple) (excludes home, car).
IL

~200 SLP sites statewide; room/board not covered.

Benefits
Personal care (5-7 hours/day, e.g., bathing, mobility) Meals Housekeeping Medication management Respite (~240 hours/year)

Persons Who Are Elderly Waiver

Illinois Medicaid Elderly Waiver

Age 65+
General Illinois resident, Medicaid-eligible, nursing home-level care need.
Income Limits (2025) ~$2,829/month 300% FBR, individual
Asset Limits $2,000 (individual), $3,000 (couple).
IL

Part of HealthChoice Illinois; consumer-directed options available.

Benefits
Personal care (5-7 hours/day, e.g., dressing, eating) Homemaker Adult day care (~$60/day) Respite (240 hours/year) Home mods ($1,000 avg.)

Medicare Savings Program (MSP)

Illinois Medicare Savings Program

Age 65+ or disabled
General Illinois resident, Medicare Part A/B.
Income Limits (2025) ~$2,510/month (QMB), ~$3,380/month (SLMB), ~$3,598/month (QI)—individual.
Asset Limits $9,430 (individual), $14,130 (couple).
IL

Three tiers; no waitlist.

Benefits
Covers Part B premiums ($174.70/month) Deductibles ($240/year) Copays (~20%)

Optional State Supplementation (OSS)

Illinois Optional State Supplementation

Age 65+ or disabled
General Illinois resident, in approved facility, SSI recipient or low-income.
Income Limits (2025) ~$1,004/month including SSI
Asset Limits $2,000 (individual), $3,000 (couple).
IL

~$50-$500/month based on facility type.

Benefits
Cash (~$50-$500/month) for room/board in personal care homes or SLFs

VA Aid and Attendance (A&A) and Housebound Benefits

Illinois VA Aid and Attendance/Housebound

Age 65+ or disabled veteran/spouse
General Illinois resident, wartime service, need for ADL help (A&A) or homebound.
Income Limits (2025) Net income < ~$1,984/month (veteran with dependent, A&A); pension offsets income.
Asset Limits ~$155,356 net worth limit
IL

High veteran demand in urban/rural areas.

Benefits
Cash (~$1,433-$2,642/month veteran, ~$951-$1,318 spouse) for care costs (e.g., in-home, assisted living)

Compare Nursing Home around Macomb

The information below is reported by the Illinois Department of Public Health, Office of Health Care Regulation.

4 facilities compared · CMS & IL Dept. of Health data

Filter by care type
The Elms
NH

Nursing Home Licensed facility providing 24/7 skilled nursing care for residents with complex, ongoing medical needs. Staffed by RNs, LPNs, and CNAs. Inspected and star-rated annually by CMS. Accepts Medicare (short-term rehab) and Medicaid (long-term care).

MC

Memory Care Secured, specialized care for people living with Alzheimer's or dementia. Staff trained in cognitive impairment, with higher staff-to-resident ratios and an environment designed to reduce confusion and wandering risk.

Macomb98 69.1% 0%4.58 +7%+48%$0142.8173 10 County Of Mcdonough Mcdonough County Clerk$10.9M$6.2M57.2%146033
Wesley Village Retirement Center
NH

Nursing Home Licensed facility providing 24/7 skilled nursing care for residents with complex, ongoing medical needs. Staffed by RNs, LPNs, and CNAs. Inspected and star-rated annually by CMS. Accepts Medicare (short-term rehab) and Medicaid (long-term care).

AL

Assisted Living A licensed, long-term care setting for seniors or individuals with disabilities who need help with daily activities — like bathing, dressing, and medication management — but not 24-hour skilled nursing. Offers housing, meals, and around-the-clock support while aiming to maximize resident independence.

IL

Independent Living Lifestyle-focused communities for older adults offering dining, activities, and transportation with minimal personal care. Best for active, independent seniors who want community without medical support.

MC

Memory Care Secured, specialized care for people living with Alzheimer's or dementia. Staff trained in cognitive impairment, with higher staff-to-resident ratios and an environment designed to reduce confusion and wandering risk.

Macomb73 65.9% -5%5.31 +18%+71%$082.0-50 5 Raymond Bunch$10.9M$6.0M55.1%146047
Macomb Post Acute Care Center
NH

Nursing Home Licensed facility providing 24/7 skilled nursing care for residents with complex, ongoing medical needs. Staffed by RNs, LPNs, and CNAs. Inspected and star-rated annually by CMS. Accepts Medicare (short-term rehab) and Medicaid (long-term care).

Macomb80 53.4% -23%3.17 -26%+2%$0323.6355 11 Etn Family Holdings LLC$5.9M$2.7M45.2%145021
Countryside Care Center
NH

Nursing Home Licensed facility providing 24/7 skilled nursing care for residents with complex, ongoing medical needs. Staffed by RNs, LPNs, and CNAs. Inspected and star-rated annually by CMS. Accepts Medicare (short-term rehab) and Medicaid (long-term care).

Macomb62 62.9% -9%3.09 -42%0%$260.6k675.2846 24 -$3.2M$1.7M53.8%146080

Frequently Asked Questions about The Elms

Is The Elms in a walkable area?

The Elms has a walk score of 10. Car-dependent. Most errands require a car, with limited nearby walkable options.

What is the occupancy rate at The Elms?

The Elms's occupancy is 69.1%.

What is the address of The Elms?

The Elms is located at 1212 Madelyn Ave, Macomb, IL 61455.

What is the phone number of The Elms?

(309) 837-5482 will put you in contact with the team at The Elms.

Is The Elms Medicare or Medicaid certified?

Yes — The Elms is a CMS-certified provider of Medicare and Medicaid.

Guides for Better Senior Living

Care Cost Calculator: See Prices in Your Area

Nursing Home Data Explorer

Don’t Wait Too Long: 7 Red Flag Signs Your Parent Needs Assisted Living Now

The True Cost of Assisted Living in 2025 – And How Families Are Paying For It

Understanding Senior Living Costs: Pricing Models, Discounts & Financial Assistance

Explore Open Rooms
1 Contact details
2 What type of senior care service are you looking for?
3 What budget do you have in mind for senior care?
4 How soon do you need to find care?
5 Additional details

Thank you for your interest!

Our team will be in touch shortly to help with next steps.