The Emeralds at Grand Rapids
Nursing Home & Assisted Living · Grand Rapids, MN
CMS overall rating Info CMS (the Centers for Medicare & Medicaid Services) is the federal agency that rates nursing home quality. Its Overall Rating runs from 1 to 5 stars, combining health inspections, staffing, and quality measures, with inspections weighted most heavily.

The Emeralds at Grand Rapids

Nursing Home & Assisted Living · Grand Rapids, MN
CMS overall rating Info CMS (the Centers for Medicare & Medicaid Services) is the federal agency that rates nursing home quality. Its Overall Rating runs from 1 to 5 stars, combining health inspections, staffing, and quality measures, with inspections weighted most heavily.
Calculator: See prices in your area
The Emeralds at Grand Rapids accepts Medicare, Medicaid, and private pay.

Overview of The Emeralds at Grand Rapids

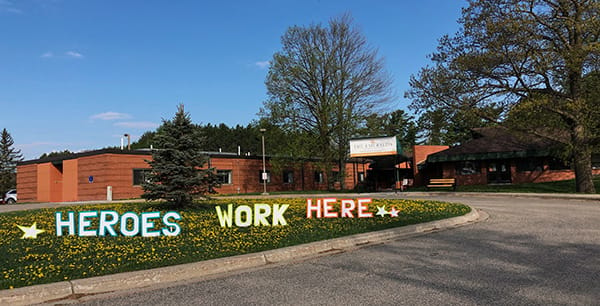
The Emeralds at Grand Rapids is a nursing home in Grand Rapids, MN, offering a wide range of care options, including assisted living, long-term care, skilled nursing, and rehabilitation. Here, older adults can keep their peace of mind, especially with a nurturing and welcoming environment. Excellent services, including 24-hour care, housekeeping, laundry, well-balanced meals, and transportation, are also provided, so residents can focus on recovery. Alongside a continuum of care, personalized care plans are also provided to meet residents’ unique needs and preferences.

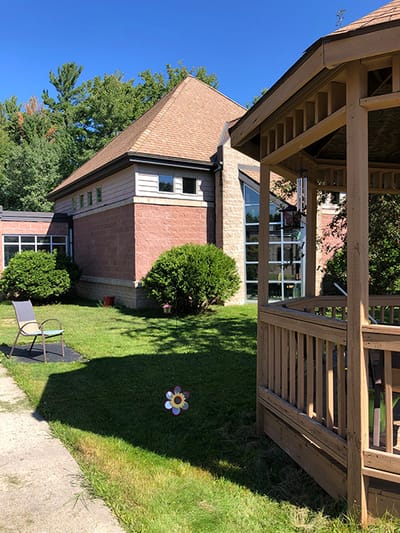
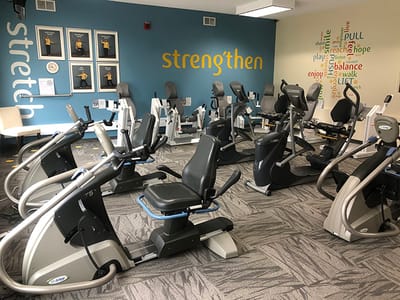
Social gatherings, light exercises, and various activities foster interactions and encourage residents to explore new hobbies. A wellness center, a beauty salon, and peaceful outdoor areas are also available, so residents can focus on their wellness. Set along major roads, near restaurants, shops, and the Judy Garland Museum, the community guarantees accessibility and convenience. This nursing home continuously provides excellent services for older adults’ welfare, making it a reliable choice for senior living in Minnesota.

Quality ratings

Measured by Centers for Medicare & Medicaid Services (CMS)

Overall rating Info The Overall CMS Rating combines results from health inspections, staffing levels and quality measures. Health inspections carry the most weight. Staffing and quality scores can increase or decrease the final rating based on performance compared to state and national standards.
▼ 68.6% Below MN avg. ▼ 68.6% Below MN avg.MN average: 3.2Click the badge to see the full State ranking.Click here to see the full State ranking.
Health Inspection Info Based on the results of the facility's three most recent standard inspections and any complaint investigations. CMS reviews the number, scope, and severity of deficiencies, with more recent findings weighted more heavily.
▼ 64.4% Below MN avg. ▼ 64.4% Below MN avg.MN average: 2.8Click the badge to see the full State ranking.Click here to see the full State ranking.
Staffing Info Measures average nursing staff hours per resident per day, including Registered Nurses (RNs) and total nursing staff. Ratings are adjusted based on the level of care residents require and are compared to state and national benchmarks.
▼ 51.2% Below MN avg. ▼ 51.2% Below MN avg.MN average: 4.1Click the badge to see the full State ranking.Click here to see the full State ranking.
Quality Measures Info Based on clinical and physical health indicators reported to CMS, such as hospital readmissions, falls, pressure ulcers, and improvements in mobility. These measures reflect how well residents' health needs are being managed.
▼ 36.1% Below MN avg. ▼ 36.1% Below MN avg.MN average: 3.1Click the badge to see the full State ranking.Click here to see the full State ranking.

Staffing hours breakdown

Info Daily nursing hours per resident by staff type, reported to CMS. Higher is generally better — compare this facility to state and national averages to see where staffing stands.

Hours per resident per day — compared to Minnesota state averages

Total nursing care / resident Info This home is ranked 89th out of 89 homes in Minnesota for nurse hours. Total adjusted nursing hours per resident per day, combining RN, LPN, and aide time. CMS adjusts this for case-mix so facilities can be fairly compared.
3h 22m per day
Rank #89 / 89Nurse hours — State benchmarkedThis home is ranked 89th out of 89 homes in Minnesota. Shows adjusted nurse hours per resident per day benchmarked to the Minnesota average, with a ranking across 89 Minnesota facilities. More hours mean more direct care. The national average is about 3.5 hrs; below 3.0 is a red flag.Rankings are based only on facilities in Minnesota that report data for that category. Facilities without available data are excluded from the ranking.Click the rank badge to see the full State ranking.Click here to see the full State ranking.
This facility Minnesota avg (4h 46m per day)
vs Minnesota avg
-29%

6 of 6 metrics below state avg

Staff typeHours / Day / Residentvs state avg
Registered Nurse (RN) Info RNs hold the highest nursing license and can assess residents, interpret test results, and direct care plans. More RN hours per day often signals stronger clinical oversight and faster response to health changes. 39m per day ▼ 40% State avg: 1h 4m per day · National avg: 41m per day
LPN / LVN Info Licensed Practical Nurses (LPNs) or Licensed Vocational Nurses (LVNs) deliver routine hands-on care — medication administration, wound dressing, and monitoring vital signs. They work under RN supervision and make up a large share of daily bedside care. 24m per day ▼ 35% State avg: 37m per day · National avg: 52m per day
Nurse Aide Info Certified Nurse Aides (CNAs) provide the most direct day-to-day assistance: bathing, dressing, feeding, and mobility. Nurse aide hours are typically the largest staffing category and directly affect residents' quality of life. 1h 59m per day ▼ 22% State avg: 2h 33m per day · National avg: 2h 21m per day
Weekend Total Nursing Info Combined nursing hours (RN + LPN + Nurse Aide) per resident per day on weekends. Staffing often drops on weekends — this figure reveals whether the facility maintains adequate coverage outside of weekday hours. 2h 47m per day ▼ 24% State avg: 3h 41m per day · National avg: 3h 26m per day
Physical Therapist Info Hours per resident per day provided by licensed Physical Therapists (PTs) or PT Assistants. PT services help residents recover mobility after injury or illness and are especially important for post-acute (short-stay) rehabilitation. 2m per day ▼ 45% State avg: 4m per day · National avg: 4m per day
Weekend RN Info Registered nurse hours specifically on weekends. Facilities sometimes reduce RN presence on Saturdays and Sundays — a low weekend RN figure compared to weekday hours can indicate reduced clinical oversight when most administrative staff are absent. 21m per day ▼ 49% State avg: 41m per day · National avg: 29m per day

Capacity and availability

This home usually has availability

Lower occupancy than the Minnesota average: 79.7%
Occupancy rate
60.1% Rank #248 / 331Occupancy rate — State benchmarkedThis home is ranked 248th out of 331 homes in Minnesota. Shows this facility's occupancy rate versus the Minnesota average, with its Statewide rank out of 331. Higher occupancy signals strong local demand and financial stability.Rankings are based only on facilities in Minnesota that report data for that category. Facilities without available data are excluded from the ranking.Click the rank badge to see the full State ranking.Click here to see the full State ranking.
Avg. Length of Stay
130 days
Bed community size
93-bed community Rank #138 / 532Bed count — State benchmarkedThis home is ranked 138th out of 532 homes in Minnesota. Shows this facility's certified or reported bed count compared to other Minnesota facilities. Larger communities may offer more amenities, programs, and on-site services for residents and families.Rankings are based only on facilities in Minnesota that report data for that category. Facilities without available data are excluded from the ranking.Click the rank badge to see the full State ranking.Click here to see the full State ranking.
A larger shared setting that may offer more common spaces and organized community services.
Walk Score
Walk Score: 9 / 100 Rank #560 / 632Walk Score — State benchmarkedThis home is ranked 560th out of 632 homes in Minnesota. Shows how walkable this facility's neighborhood is compared to the average Walk Score across Minnesota facilities. Higher scores benefit residents, families, and staff.Rankings are based only on facilities in Minnesota that report data for that category. Facilities without available data are excluded from the ranking.Click the rank badge to see the full State ranking.Click here to see the full State ranking.
Car-dependent. Most errands require a car, with limited nearby walkable options.

Contact The Emeralds at Grand Rapids

Staffing Data

Reporting period: October 1 – December 31, 2025 (Q4 2025). Source: CMS Payroll-Based Journal report.

Total staff 72
Employees 54
Contractors 18
Staff to resident ratio 1.53 : 1
30% fewer staff per resident than Minnesota average
Minnesota average ratio: 2.19 : 1 Minnesota average ratio: 2.19 : 1See full Minnesota ranking
Avg staff/day 22
Average shift 7.7 hours
0% compared with Minnesota average
Minnesota average: 7.5 hours Minnesota average shift: 7.5 hoursSee full Minnesota ranking
Total staff hours (quarter) 15,675

Nursing staff breakdown

Q4 2025 · Oct 1 – Dec 31 More info This data comes from the CMS Payroll-Based Journal report covering October 1 – December 31, 2025.
Registered Nurse

Manages medical care and health needs.

RN Staff Info 10 total: 6 full-time employees and 4 contractors. 10
Average shift length Info Average shift length. Calculated as total hours divided by days worked and average staff per day. 9.8 hours
Licensed Practical Nurse

Assists with medical care and medications.

LPN Staff Info All 7 LPN Staff are full-time employees. No contractors work on this role. 7
Average shift length Info Average shift length. Calculated as total hours divided by days worked and average staff per day. 8.4 hours
Certified Nursing Assistant

Helps with daily care and mobility.

CNA Staff Info 27 total: 25 full-time employees and 2 contractors. 27
Average shift length Info Average shift length. Calculated as total hours divided by days worked and average staff per day. 7.3 hours

Contractor staffing

Q4 2025 · Oct 1 – Dec 31 More info This data comes from the CMS Payroll-Based Journal report covering October 1 – December 31, 2025.

Total hours from contractors

18.4%

2,882 contractor hours this quarter

Registered Nurse: 4 Physical Therapy Assistant: 3 Certified Nursing Assistant: 2 Speech Language Pathologist: 2 Qualified Social Worker: 2 Respiratory Therapy Technician: 2 Occupational Therapy Assistant: 1 Medical Director: 1 Physical Therapy Aide: 1

Staff by category

Q4 2025 · Oct 1 – Dec 31 More info This data comes from the CMS Payroll-Based Journal report covering October 1 – December 31, 2025.
Certified Nursing Assistant252277,06692100%7.3
Registered Nurse64101,83492100%9.8
Licensed Practical Nurse7071,5719199%8.4
Medication Aide/Technician7071,22192100%8.8
Other Dietary Services Staff2029336470%7.8
Nurse Practitioner1015606267%9
Administrator1015155661%9.2
Dental Services Staff2025115560%7.9
Speech Language Pathologist0223996166%6.5
Physical Therapy Assistant0333776267%6.1
Clinical Nurse Specialist1012943942%7.5
Respiratory Therapy Technician0221543235%4.8
RN Director of Nursing1011081516%7.2
Occupational Therapy Assistant0113467%5.6
Qualified Social Worker022301516%2
Occupational Therapy Aide1013044%7.5
Physical Therapy Aide0112778%3.9
Medical Director0111333%4.3
27 Certified Nursing Assistant
% of Days 100%
10 Registered Nurse
% of Days 100%
7 Licensed Practical Nurse
% of Days 99%
7 Medication Aide/Technician
% of Days 100%
2 Other Dietary Services Staff
% of Days 70%
1 Nurse Practitioner
% of Days 67%
1 Administrator
% of Days 61%
2 Dental Services Staff
% of Days 60%
2 Speech Language Pathologist
% of Days 66%
3 Physical Therapy Assistant
% of Days 67%
1 Clinical Nurse Specialist
% of Days 42%
2 Respiratory Therapy Technician
% of Days 35%
1 RN Director of Nursing
% of Days 16%
1 Occupational Therapy Assistant
% of Days 7%
2 Qualified Social Worker
% of Days 16%
1 Occupational Therapy Aide
% of Days 4%
1 Physical Therapy Aide
% of Days 8%
1 Medical Director
% of Days 3%

Penalties and fines

Includes penalties issued in 2023-2024

Federal penalties imposed by CMS for regulatory violations, including civil money penalties (fines) and denials of payment for new Medicare/Medicaid admissions.

Source: CMS Penalties Database (Data as of Jan 2026)

Total fines amount $39K Rank #68 / 90Federal fines — State benchmarkedThis home is ranked 68th out of 90 homes in Minnesota. Shows this facility's cumulative CMS federal fine dollars versus the Minnesota average among facilities with fines, and where it ranks among 90 facilities in the pool. Lower total dollars mean a better rank.Rankings are based only on facilities in Minnesota that report data for that category. Facilities without available data are excluded from the ranking.Click the rank badge to see the full State ranking.Click here to see the full State ranking.
13% lower than Minnesota average

Minnesota average: $44K

Number of fines 3
50% more fines than Minnesota average

Minnesota average: 2.0

Payment Denials Info Serious action where Medicare and/or Medicaid temporarily stops payments for new residents until issues are fixed. 0
100% fewer payment denials than Minnesota average

Minnesota average: 0.4

Fines amount comparison
This facility $39K
Minnesota average $44K
Penalty History

Penalties are imposed by CMS for violations of federal nursing home regulations.

3 penalties in the past 3 years

Multiple penalties were reported in the last 3 years.

Civil Money Penalty Info Fines imposed for noncompliance, which can be assessed per day or per instance of violation. Mar 22, 2024
$14K
Civil Money Penalty Info Fines imposed for noncompliance, which can be assessed per day or per instance of violation. Mar 7, 2024
$9K
Civil Money Penalty Info Fines imposed for noncompliance, which can be assessed per day or per instance of violation. Oct 13, 2023
$15K

Last updated: Jan 2026

Quality of care over time

These measures show how residents usually do over time at this home, based on health outcomes and preventive care.

High-risk clinical events score Info A composite score based on pressure ulcers, falls with injury, weight loss, walking ability decline, and activities of daily living decline. 6.5
41% better than Minnesota average

Minnesota average: 11.1

Functional decline score Info A composite score based on activities of daily living decline, walking ability decline, and incontinence. 11.8
48% better than Minnesota average

Minnesota average: 22.6

Long-stay resident measures
Average Info CMS star rating based on long-stay quality measure performance. 5 stars = significantly above average, 1 star = significantly below average.
Need for Help with Daily Activities Increased Info Percent of long-stay residents whose need for help with daily activities has increased 7.8%
59% better than Minnesota average

Minnesota average: 18.9%

Walking Ability Worsened Info Percent of long-stay residents whose ability to move independently worsened 11.8%
51% better than Minnesota average

Minnesota average: 23.8%

Low Risk Residents with Bowel/Bladder Incontinence Info Percent of low risk long-stay residents who lose control of their bowels or bladder 16.0%
36% better than Minnesota average

Minnesota average: 25.0%

Falls with Major Injury Info Percent of long-stay residents experiencing one or more falls with major injury 4.1%
8% worse than Minnesota average

Minnesota average: 3.7%

High Risk Residents with Pressure Ulcers Info Percent of long-stay high risk residents with pressure ulcers 7.0%
28% worse than Minnesota average

Minnesota average: 5.4%

Urinary Tract Infection Info Percent of long-stay residents with a urinary tract infection 3.5%
28% worse than Minnesota average

Minnesota average: 2.7%

Lost Too Much Weight Info Percent of long-stay residents who lose too much weight 2.1%
50% better than Minnesota average

Minnesota average: 4.1%

Depressive Symptoms Info Percent of long-stay residents who have depressive symptoms 4.1%
6% better than Minnesota average

Minnesota average: 4.4%

Antipsychotic Use Info Percent of long-stay residents who received an antipsychotic medication 25.2%
46% worse than Minnesota average

Minnesota average: 17.2%

Pneumococcal Vaccine Info Percent of long-stay residents assessed and appropriately given the pneumococcal vaccine 98.3%
In line with Minnesota average

Minnesota average: 97.3%

Influenza Vaccine Info Percent of long-stay residents assessed and appropriately given the seasonal influenza vaccine 100.0%
In line with Minnesota average

Minnesota average: 96.0%

Short-stay resident measures
Average Info CMS star rating based on short-stay quality measure performance. 5 stars = much above average, 1 star = much below average.
Pneumococcal Vaccine Info Percent of short-stay residents assessed and appropriately given the pneumococcal vaccine 81.2%
9% worse than Minnesota average

Minnesota average: 88.9%

Antipsychotic medication increase Info Percent of short-stay residents who newly received an antipsychotic medication 1.6%
19% better than Minnesota average

Minnesota average: 1.9%

Influenza Vaccine Info Percent of short-stay residents assessed and appropriately given the seasonal influenza vaccine 71.6%
13% worse than Minnesota average

Minnesota average: 82.6%

Re-hospitalized after SNF stay Info Percentage of short-stay residents who were re-hospitalized after their nursing home admission. 20.8%
10% better than Minnesota average

Minnesota average: 23.1%

Emergency department visits Info Percentage of short-stay residents who had an outpatient emergency department visit. 32.1%
129% worse than Minnesota average

Minnesota average: 14.0%

Falls with major injury Info Percentage of SNF residents who experience falls with major injury during their stay. 3.5%
356% worse than Minnesota average

Minnesota average: 0.8%

Ability to care for self at discharge Info Percentage of residents at or above expected ability to care for themselves at discharge. 44.4%
17% worse than Minnesota average

Minnesota average: 53.7%

Successful return to home or community Info Rate of successful return to home or community from a skilled nursing facility. 44.6%
12% worse than Minnesota average

Minnesota average: 50.6%

Breakdown by payment type

Medicare

41% of new residents, usually for short-term rehab.

Typical stay 1 - 2 months

Private pay

50% of new residents, often for short stays.

Typical stay 2 - 3 months

Medicaid

9% of new residents, often for long-term daily care.

Typical stay 3 years

Facility Characteristics

Source: CMS Long-Term Care Facility Characteristics (Data as of Jan 2026)

Total residents 47
Medicare
9
19.1% of residents
Medicaid
31
66% of residents
Private pay or other
7
14.9% of residents
Programs & Services
Residents Group

Residents meet regularly to discuss policies, care quality, and activities

Active Resident Council

Organized group of residents that meets regularly to discuss facility policies, quality of life, and activities.

Finances and operations

Based on CMS SNF Cost Report for fiscal year ending in 12/2023.

For-profit
Corporation
Net patient revenue Info Net patient revenue — what the home actually collects for resident care, after contractual allowances, bad debt and discounts are subtracted from its gross charges (CMS cost report, Worksheet G-3). It covers resident care only; money the home earns from other sources is shown separately as "Other income."
$7.4M
Net patient income Info Net patient income: net patient revenue minus the home's total operating expenses. A positive figure means it earns more from resident care than it spends to deliver it; a negative figure means the opposite. It excludes non-operating "other income."
-$170.8K
For-profit Corporation
Net patient revenue Info Net patient revenue — what the home actually collects for resident care, after contractual allowances, bad debt and discounts are subtracted from its gross charges (CMS cost report, Worksheet G-3). It covers resident care only; money the home earns from other sources is shown separately as "Other income."
$7.4M Rank #69 / 89Revenue — State benchmarkedThis home is ranked 69th out of 89 homes in Minnesota. Shows this facility's annual revenue compared to the Minnesota average. Higher revenue generally means more resources for staffing and capital — read alongside Payroll %.Rankings are based only on facilities in Minnesota that report data for that category. Facilities without available data are excluded from the ranking.Click the rank badge to see the full State ranking.Click here to see the full State ranking.
Net patient income Info Net patient income: net patient revenue minus the home's total operating expenses. A positive figure means it earns more from resident care than it spends to deliver it; a negative figure means the opposite. It excludes non-operating "other income."
-$170.8K
Other income Info Money the home earns outside of resident care — such as investments, grants, rentals and other non-operating sources (CMS cost report, Worksheet G-3). It is tracked separately from net patient revenue: it is not part of that figure, and it is not included in net patient income.
$448.8K
Payroll costs Info Staff salaries plus wage-related costs — benefits such as payroll taxes, health insurance and retirement — from the home's own accounting records (CMS cost report, Worksheet A). Contract or agency labor is counted separately, under other operating costs. Rank #70 / 89Payroll — State benchmarkedThis home is ranked 70th out of 89 homes in Minnesota. Shows total annual staff payroll benchmarked to the Minnesota average. Higher payroll investment relative to peers often signals better staffing and less reliance on cheaper contract labor.Rankings are based only on facilities in Minnesota that report data for that category. Facilities without available data are excluded from the ranking.Click the rank badge to see the full State ranking.Click here to see the full State ranking.
$3.5M 46.9% of net patient revenue Info Payroll as a share of revenue: staff salaries and wage-related benefits divided by net patient revenue. A higher figure means more of each revenue dollar goes to staff pay. Rank #55 / 89Payroll % — State benchmarkedThis home is ranked 55th out of 89 homes in Minnesota. Shows payroll as a percentage of revenue versus the Minnesota average. Well-run Minnesota facilities typically land around 61–68% — the top third Statewide. Below 25% may signal understaffing or heavy agency use — read with Staffing ratings.Rankings are based only on facilities in Minnesota that report data for that category. Facilities without available data are excluded from the ranking.Click the rank badge to see the full State ranking.Click here to see the full State ranking.
Other operating costs Info Everything it costs to run the home apart from payroll — food, utilities, supplies, maintenance, contract labor and administration. Calculated as total operating expense minus payroll (staff salaries and wage-related benefits).
$4.1M
Total costs Info The home's total operating expense for the year — all the costs of running it, salaries included (CMS cost report, Worksheet G-3).
$7.6M

What does this home offer?

Housing options icon

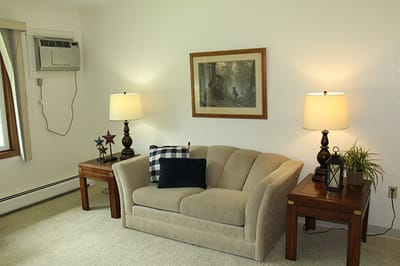
Housing Options: Private / Semi-Private Rooms

Building type icon
Building type icon

Building Type: Single-story

Beauty services icon

Beauty Services

Transportation services icon

Transportation Services

Housekeeping icon
Housekeeping icon

Housekeeping Services

Social and recreational activities icon

Social and Recreational Activities

Rehabilitative support icon

Rehabilitative Support

On-site medical care and health services icon

On-site Medical Care and Health Services

Personal care icon
Personal care icon

Personal Care Assistance

Who this home usually serves

TYPE OF STAY

Mix of rehab and long-term care

This home supports both short-term rehab and long-term care, with residents staying for a wide range of durations.

Most new residents arrive under private pay (50% of admissions), and a typical private pay stay runs around 2 - 3 months.

Admissions
141 total

Coverage residents most often arrive under.

Medicare 41%
Private pay 50%
Medicaid 9%
Discharges
157 total

Coverage residents most often leave under.

Medicare 31%
Private pay 45%
Medicaid 24%

Places of interest near The Emeralds at Grand Rapids

Address 2.3 miles from city center Info Estimated distance in miles from Grand Rapids's city center to The Emeralds at Grand Rapids's address, calculated via Google Maps.

Calculate Travel Distance to The Emeralds at Grand Rapids

Add your location

Address

Compare Nursing Homes around Grand Rapids

The information below is reported by the Minnesota Department of Health, Health Regulation Division.

2 facilities compared · CMS & MN Dept. of Health data

Grand Village
NH
Grand Rapids
114
Facility 114
MN AVG 61
Rank #96 / 532
59.9%
Facility 59.9%
MN AVG 79.7%
Rank #263 / 331
-25%
4.75
Facility 4.75
MN AVG 4.77
Rank #36 / 89
-62%0%
$0
Facility $0
MN AVG $47.9k
Rank #1 / 90
21
Facility 21
MN AVG 23.2
Rank #36 / 90
3.0
Facility 3.0
MN AVG 3.8
Rank #26 / 90
161-
5
Facility 5
MN AVG 43
Rank #581 / 632
County Of Itasca
$11.2M
Facility $11.2M
MN AVG $9.9M
Rank #38 / 89
$7.6M
Facility $7.6M
MN AVG $4.9M
Rank #34 / 89
68.4%
Facility 68.4%
MN AVG 50.7%
Rank #41 / 89
245368
The Emeralds at Grand Rapids
NH
AL
Grand Rapids (Wagon Wheel Mobile Home Park)
93
Facility 93
MN AVG 61
Rank #138 / 532
60.1%
Facility 60.1%
MN AVG 79.7%
Rank #248 / 331
-25%
3.37
Facility 3.37
MN AVG 4.77
Rank #89 / 89
-2%-29%
$38.5k
Facility $38.5k
MN AVG $47.9k
Rank #68 / 90
60
Facility 60
MN AVG 23.2
Rank #86 / 90
5.5
Facility 5.5
MN AVG 3.8
Rank #74 / 90
345-
9
Facility 9
MN AVG 43
Rank #560 / 632
-
$7.4M
Facility $7.4M
MN AVG $9.9M
Rank #69 / 89
$3.5M
Facility $3.5M
MN AVG $4.9M
Rank #70 / 89
46.9%
Facility 46.9%
MN AVG 50.7%
Rank #55 / 89
245495

Financial Assistance for
Nursing Home in Minnesota

The Emeralds at Grand Rapids is located in Grand Rapids, Minnesota.
Here are the financial assistance programs available to residents in Minnesota.

Get Financial aid guidance

Elderly Waiver

Minnesota Medicaid EW

Age 65+
General Minnesota resident, Medicaid-eligible, nursing home-level care need.
Income Limits (2025) ~$2,829/month 300% FBR, individual
Asset Limits $3,000 individual, higher than most states
MN

Higher asset limit; rural access focus.

Benefits
Personal care (5-7 hours/day) Respite (240 hours/year) Adult day care (~$70/day) Home aides

Essential Community Supports (ECS)

Minnesota ECS

Age 65+
General Minnesota resident, at risk of decline but not nursing home level.
Income Limits ~$1,732/month individual, varies
Asset Limits $3,000 individual
MN

Bridges gap for those ineligible for waivers.

Benefits
In-home support (2-4 hours/week) Respite (up to 5 days/year) Transportation (~5 trips/month)

Alternative Care (AC) Program

Minnesota Alternative Care Program

Age 65+
General Minnesota resident, NFLOC, not MA-eligible.
Income Limits (2025) ~$1,255-$2,829/month (100%-300% FPL); sliding scale copays.
Asset Limits $3,000 (individual); home equity limit $713,000.
MN

CDCS option; statewide via counties.

Benefits
Personal care (4-6 hours/day) Respite (~5 days/year) Home health Meals Home mods

Minnesota Senior Health Options (MSHO)

Minnesota Senior Health Options

Age 65+
General Minnesota resident, eligible for MA and Medicare Parts A/B.
Income Limits (2025) ~$1,255/month (100% FPL for MA); spenddown allowed.
Asset Limits $3,000 (individual), $6,000 (couple).
MN

7 health plans (e.g., UCare, HealthPartners); care coordinator assigned.

Benefits
Personal care (5-7 hours/day) Medical care Respite Adult day care Home mods $900/year groceries (some plans)

Minnesota Senior Care Plus (MSC+)

Minnesota Senior Care Plus

Age 65+
General Minnesota resident, MA-eligible, not on Medicare.
Income Limits (2025) ~$1,255/month (100% FPL); spenddown allowed.
Asset Limits $3,000 (individual), $6,000 (couple).
MN

Includes EW services; 7 health plans available.

Benefits
Personal care (5-7 hours/day) Respite Adult day care Home mods Limited nursing home care

Consumer Support Grant (CSG)

Minnesota Consumer Support Grant

Age 65+ or disabled
General Minnesota resident, eligible for MA personal care but opts for grant.
Income Limits (2025) ~$1,255/month (MA-eligible); spenddown allowed.
Asset Limits $3,000 individual
MN

Can hire family; statewide via counties.

Benefits
Cash (~$500-$1,500/month) for personal care Respite Home mods Assistive tech

Medicare Savings Program (MSP)

Minnesota Medicare Savings Program

Age 65+ or disabled
General Minnesota resident, Medicare Part A/B.
Income Limits (2025) ~$2,510/month (QMB), ~$3,380/month (SLMB), ~$3,598/month (QI)—individual.
Asset Limits $9,430 (individual), $14,130 (couple).
MN

Three tiers; no waitlist; includes Extra Help for Part D.

Benefits
Covers Part B premiums ($174.70/month) Deductibles ($240/year) Copays (~20%)

VA Aid and Attendance (A&A) and Housebound Benefits

Minnesota VA Aid and Attendance/Housebound

Age 65+ or disabled veteran/spouse
General Minnesota resident, wartime service, need for ADL help (A&A) or homebound.
Income Limits (2025) Net income < ~$1,984/month (veteran with dependent, A&A); pension offsets income.
Asset Limits ~$155,356 net worth limit
MN

High veteran demand in rural/urban areas.

Benefits
Cash (~$1,433-$2,642/month veteran, ~$951-$1,318 spouse) for care costs (e.g., in-home, assisted living)

Frequently Asked Questions about The Emeralds at Grand Rapids

What neighborhood is The Emeralds at Grand Rapids in?

The Emeralds at Grand Rapids is in the Wagon Wheel Mobile Home Park neighborhood.

Is The Emeralds at Grand Rapids in a walkable area?

The Emeralds at Grand Rapids has a walk score of 9. Car-dependent. Most errands require a car, with limited nearby walkable options.

What is the occupancy rate at The Emeralds at Grand Rapids?

The Emeralds at Grand Rapids's occupancy is 60.1%.

What is the best email address for The Emeralds at Grand Rapids?

The team at The Emeralds at Grand Rapids can be reached at JTadych@monarchmn.com.

Does The Emeralds at Grand Rapids operate as a for-profit or non-profit?

The Emeralds at Grand Rapids is registered as a for-profit.

Are there photos of The Emeralds at Grand Rapids?

Yes — there are 4 photos of The Emeralds at Grand Rapids in the photo gallery on this page.

What is the address of The Emeralds at Grand Rapids?

The Emeralds at Grand Rapids is located at 2801 Us-169, Grand Rapids, MN 55744.

Guides for Better Senior Living

Care Cost Calculator: See Prices in Your Area

Nursing Home Data Explorer

Don’t Wait Too Long: 7 Red Flag Signs Your Parent Needs Assisted Living Now

The True Cost of Assisted Living in 2025 – And How Families Are Paying For It

Understanding Senior Living Costs: Pricing Models, Discounts & Financial Assistance