The Estates at Roseville

Nursing Home in Roseville

CMS overall rating Info The Overall CMS Rating is scored from 1 to 5 stars and combines results from health inspections, staffing levels, and quality measures. Health inspections carry the most weight. Staffing and quality scores can increase or decrease the final rating based on performance compared to state and national standards.

Overview of The Estates at Roseville

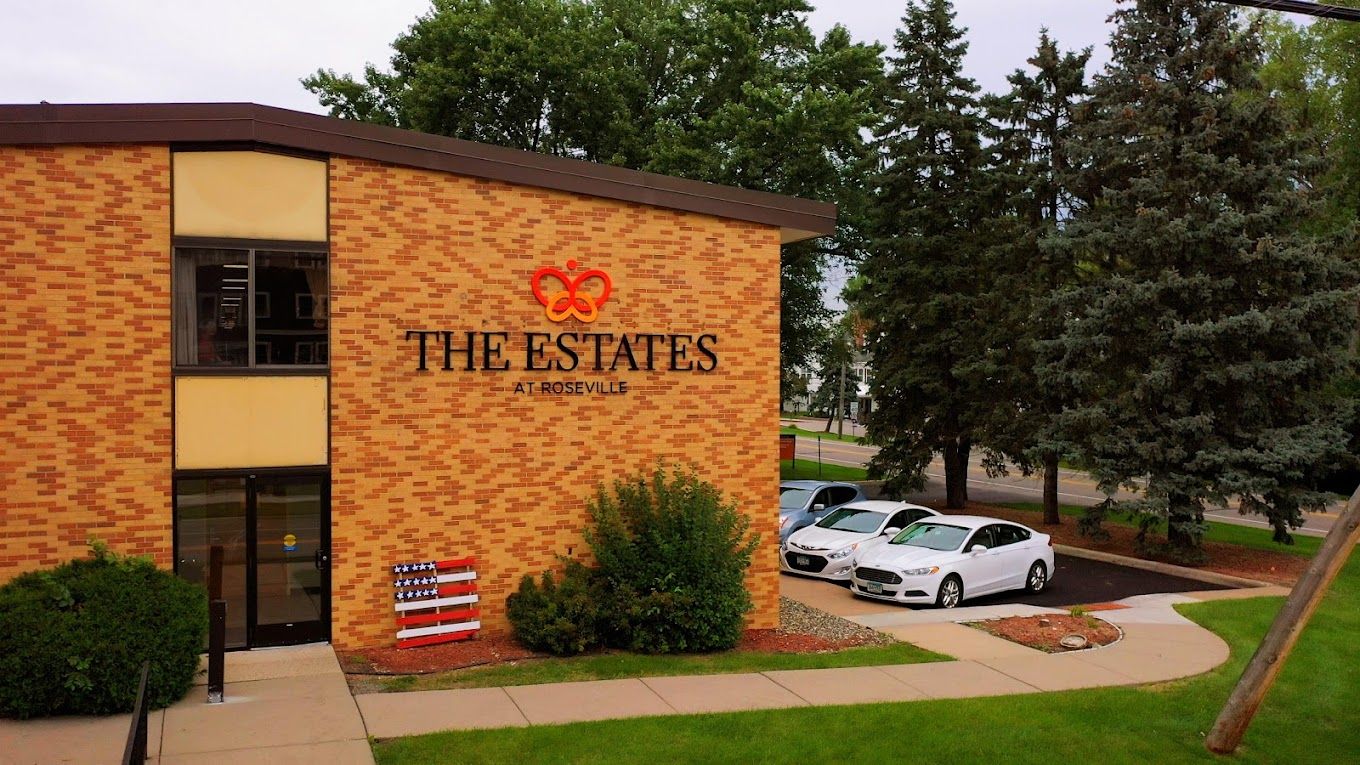
Established in the serene neighborhood of Roseville, MN, The Estates at Roseville is a respected senior care provider that offers a full continuum of care. The community offers quality long-term care services and short-term rehabilitation to those who are recovering from an illness, injury, surgery, or living any forms of memory loss. Residents here delight in comfortable accommodations and round-the-clock care from a team of highly-competent care experts.

Focused on offering its residents an enriching environment that allows them to thrive, The Estates at Roseville also offers a wide array of social engagement activities and thoughtful amenities. Residents are also provided the relief and convenience of on-site housekeeping and laundry services that give them more time for enjoying their retirement life. Added support and comfort are provided by an on-site physician and access to specialty services, making residents’ lives more comfortable and convenient.

(651) 483-5431

Quality ratings

Measured by Centers for Medicare & Medicaid Services (CMS)

Overall rating Info The Overall CMS Rating combines results from health inspections, staffing levels and quality measures. Health inspections carry the most weight. Staffing and quality scores can increase or decrease the final rating based on performance compared to state and national standards.
2/5 ▼ 1.2 Minnesota average: 3.2/5
Health Inspection Info Based on the results of the facility's three most recent standard inspections and any complaint investigations. CMS reviews the number, scope, and severity of deficiencies, with more recent findings weighted more heavily.
2/5 ▼ 0.8 Minnesota average: 2.8/5
Staffing Info Measures average nursing staff hours per resident per day, including Registered Nurses (RNs) and total nursing staff. Ratings are adjusted based on the level of care residents require and are compared to state and national benchmarks.
3/5 ▼ 1.1 Minnesota average: 4.1/5
Quality Measures Info Based on clinical and physical health indicators reported to CMS, such as hospital readmissions, falls, pressure ulcers, and improvements in mobility. These measures reflect how well residents' health needs are being managed.
2/5 ▼ 1.1 Minnesota average: 3.1/5

Staffing hours breakdown

Info Daily nursing hours per resident by staff type, reported to CMS. Higher is generally better — compare this facility to state and national averages to see where staffing stands.

Hours per resident per day — compared to Minnesota state averages

Total nursing care / resident Info This home is ranked 50th out of 68 homes in Minnesota.

Total adjusted nursing hours per resident per day, combining RN, LPN, and aide time. CMS adjusts this for case-mix so facilities can be fairly compared.
3h 54m per day
Rank #50 / 68Nurse hours — state benchmarkedThis home is ranked 50th out of 68 homes in Minnesota.Shows adjusted nurse hours per resident per day benchmarked to the Minnesota average, with a ranking across 68 Minnesota SNFs. More hours mean more direct care. The national average is about 3.5 hrs; below 3.0 is a red flag.
This facility Minnesota avg (4h 46m per day)
vs Minnesota avg
-18%

5 of 6 metrics below state avg

Standout metric LPN / LVN is +8% above state avg
Staff typeHours / dayvs state avg
Registered Nurse (RN) Info RNs hold the highest nursing license and can assess residents, interpret test results, and direct care plans. More RN hours per day often signals stronger clinical oversight and faster response to health changes. 38m per day ▼ 41% State avg: 1h 4m per day · National avg: 41m per day
LPN / LVN Info Licensed Practical Nurses (LPNs) or Licensed Vocational Nurses (LVNs) deliver routine hands-on care — medication administration, wound dressing, and monitoring vital signs. They work under RN supervision and make up a large share of daily bedside care. 40m per day ▲ 8% State avg: 37m per day · National avg: 52m per day
Nurse Aide Info Certified Nurse Aides (CNAs) provide the most direct day-to-day assistance: bathing, dressing, feeding, and mobility. Nurse aide hours are typically the largest staffing category and directly affect residents' quality of life. 2h 21m per day ▼ 8% State avg: 2h 33m per day · National avg: 2h 21m per day
Total Nursing (Weekend) Info Combined nursing hours (RN + LPN + Nurse Aide) per resident per day on weekends. Staffing often drops on weekends — this figure reveals whether the facility maintains adequate coverage outside of weekday hours. 3h 25m per day ▼ 7% State avg: 3h 41m per day · National avg: 3h 26m per day
Physical Therapist Info Hours per resident per day provided by licensed Physical Therapists (PTs) or PT Assistants. PT services help residents recover mobility after injury or illness and are especially important for post-acute (short-stay) rehabilitation. 1m per day ▼ 75% State avg: 4m per day · National avg: 4m per day
RN (Weekend) Info Registered nurse hours specifically on weekends. Facilities sometimes reduce RN presence on Saturdays and Sundays — a low weekend RN figure compared to weekday hours can indicate reduced clinical oversight when most administrative staff are absent. 28m per day ▼ 32% State avg: 41m per day · National avg: 29m per day

Capacity and availability

This home usually has limited availability

Occupancy between 85% and 95% suggests balanced demand.

Higher occupancy than the Minnesota average: 79.7%
Occupancy rate 85.4% Rank #26 / 69Occupancy rate — state benchmarkedThis home is ranked 26th out of 69 homes in Minnesota.Shows this facility's occupancy rate versus the Minnesota average, with its statewide rank out of 69. Higher occupancy signals strong local demand and financial stability.
Avg. Length of Stay 110 days
Occupancy rate
85.4% Rank #26 / 69Occupancy rate — state benchmarkedThis home is ranked 26th out of 69 homes in Minnesota.Shows this facility's occupancy rate versus the Minnesota average, with its statewide rank out of 69. Higher occupancy signals strong local demand and financial stability.
Avg. Length of Stay
110 days

Who this home usually serves

TYPE OF STAY

Primarily short stays

Residents typically stay for brief periods, with frequent admissions and discharges throughout the year.

Might be optimal for
Post-acute recovery Temporary care Transitional stays

Breakdown by payment type

Medicare

23% of new residents, usually for short-term rehab.

Typical stay 29 days

Private pay

71% of new residents, often for short stays.

Typical stay 2 - 3 months

Medicaid

7% of new residents, often for long-term daily care.

Typical stay 2 years

Finances and operations

Privately-owned community
Home revenue
$18.5M
Profit
$2.1M
Privately-owned community
Home revenue
$18.5M Rank #17 / 68Revenue — state benchmarkedThis home is ranked 17th out of 68 homes in Minnesota.Shows this facility's annual revenue compared to the Minnesota SNF average. Higher revenue generally means more resources for staffing and capital — read alongside Payroll %.
Profit
$2.1M
Payroll costs Info The portion of the home's budget spent on staff, including nurses, caregivers, and other employees who support care and operations. Rank #24 / 68Payroll — state benchmarkedThis home is ranked 24th out of 68 homes in Minnesota.Shows total annual staff payroll benchmarked to the Minnesota average. Higher payroll investment relative to peers often signals better staffing and less reliance on cheaper contract labor.
$7.4M
40% of revenue Rank #45 / 68Payroll % — state benchmarkedThis home is ranked 45th out of 68 homes in Minnesota.Shows payroll as a percentage of revenue versus the Minnesota average. Well-run SNFs often land around 55–65%. Below 25% may signal understaffing or heavy agency use — read with Staffing ratings.
Other operating costs Info All remaining costs needed to run the home, such as food, utilities, building maintenance, supplies and administrative expenses.
$9.1M
Total costs $16.5M
Walk Score
Walk Score: 29 / 100 Rank #36 / 50Walk Score — state benchmarkedThis home is ranked 36th out of 50 homes in Minnesota.Shows how walkable this facility's neighborhood is compared to the average Walk Score across Minnesota SNFs. Higher scores benefit residents, families, and staff.
Somewhat walkable. A few nearby services may be reachable on foot, but most trips require transportation.

What does this home offer?

Accepts Medicaid icon

Accept Medicaid: Yes, Accept

Total residents icon

Total Residents: 140 Residents

Housing options icon

Housing Options: Private / Semi-Private Rooms

Building type icon
Building type icon

Building Type: 2-story

Types of Care at The Estates at Roseville

Nursing Home

Contact The Estates at Roseville

Health Inspection History

Inspections
Total health inspections 5

Minnesota average 6


Last Health inspection on May 2025

Total health citations
28 Rank #40 / 68Health citations — state benchmarkedThis home is ranked 40th out of 68 homes in Minnesota.Shows this facility's total health deficiency citations benchmarked to the Minnesota state average, with a ranking across all 68 MN SNFs. Lower citation counts earn a better rank.

Minnesota average 23.2

Citations per inspection
5.6

Minnesota average 3.76


Health citations are formal notices following inspections when they fail to comply with safety and care standards.

23 of 28 citations resulted from standard inspections; 3 of 28 resulted from complaint investigations; and 2 of 28 came from combined inspections (standard and complaint).

Breakdown of citation severity (last 3 years)
Critical Health citations More info
1 Rank #19 / 45Severe citations — state benchmarkedThis home is ranked 19th out of 45 homes in Minnesota.Shows citations where actual resident harm occurred, compared to the Minnesota average and ranked across 45 SNFs statewide. Even a single severe citation is significant — lower is always better.
43% worse than Minnesota average

Minnesota average: 0.7


Serious Health citations More info 1
100% worse than Minnesota average

Minnesota average: 0.5

1 critical citation More info Minnesota average: 0.7

1 serious citation More info Minnesota average: 0.5

25 moderate citations More info Minnesota average: 21.2

1 minor citation More info Minnesota average: 0.8
Citations history (last 3 years)
Abuse/Neglect moderate citation Info Issues related to protecting resident's from harm, including abuse, neglect, or mistreatment. May 21, 2025
Corrected

Infection Control moderate citation Info Issues related to preventing and controlling infections, including hygiene practices and safety protocols. May 21, 2025
Corrected

Nursing Services moderate citation Info Issues related to the availability and quality of nursing staff and the care they provide. May 21, 2025
Corrected

Nutrition moderate citation Info Issues related to food quality, meal service, and resident's nutritional needs. May 21, 2025
Corrected

Compare Nursing Homes around Roseville The information below is reported by the Minnesota Department of Health, Health Regulation Division.

1 facility compared · CMS & MN Dept. of Health data · Updated Apr 2026

Filter by care type
The Estates at Roseville
AL

Assisted Living A licensed, long-term care setting for seniors or individuals with disabilities who need help with daily activities — like bathing, dressing, and medication management — but not 24-hour skilled nursing. Offers housing, meals, and around-the-clock support while aiming to maximize resident independence.

IL

Independent Living Lifestyle-focused communities for older adults offering dining, activities, and transportation with minimal personal care. Best for active, independent seniors who want community without medical support.

MC

Memory Care Secured, specialized care for people living with Alzheimer's or dementia. Staff trained in cognitive impairment, with higher staff-to-resident ratios and an environment designed to reduce confusion and wandering risk.

NH

Nursing Home Licensed facility providing 24/7 skilled nursing care for residents with complex, ongoing medical needs. Staffed by RNs, LPNs, and CNAs. Inspected and star-rated annually by CMS. Accepts Medicare (short-term rehab) and Medicaid (long-term care).

Roseville (Victoria Street North)140 85.4% +7%3.90 +111%-18%2285.62135- 29 Monarch Healthcare Operating Iv Llc$18.5M$7.4M40%245105

Financial Assistance for
Nursing Home in Minnesota

Get Financial aid guidance

Elderly Waiver

Minnesota Medicaid EW

Age 65+
General Minnesota resident, Medicaid-eligible, nursing home-level care need.
Income Limits (2025) ~$2,829/month 300% FBR, individual
Asset Limits $3,000 individual, higher than most states
MN

Higher asset limit; rural access focus.

Benefits
Personal care (5-7 hours/day) Respite (240 hours/year) Adult day care (~$70/day) Home aides

Essential Community Supports (ECS)

Minnesota ECS

Age 65+
General Minnesota resident, at risk of decline but not nursing home level.
Income Limits ~$1,732/month individual, varies
Asset Limits $3,000 individual
MN

Bridges gap for those ineligible for waivers.

Benefits
In-home support (2-4 hours/week) Respite (up to 5 days/year) Transportation (~5 trips/month)

Alternative Care (AC) Program

Minnesota Alternative Care Program

Age 65+
General Minnesota resident, NFLOC, not MA-eligible.
Income Limits (2025) ~$1,255-$2,829/month (100%-300% FPL); sliding scale copays.
Asset Limits $3,000 (individual); home equity limit $713,000.
MN

CDCS option; statewide via counties.

Benefits
Personal care (4-6 hours/day) Respite (~5 days/year) Home health Meals Home mods

Minnesota Senior Health Options (MSHO)

Minnesota Senior Health Options

Age 65+
General Minnesota resident, eligible for MA and Medicare Parts A/B.
Income Limits (2025) ~$1,255/month (100% FPL for MA); spenddown allowed.
Asset Limits $3,000 (individual), $6,000 (couple).
MN

7 health plans (e.g., UCare, HealthPartners); care coordinator assigned.

Benefits
Personal care (5-7 hours/day) Medical care Respite Adult day care Home mods $900/year groceries (some plans)

Minnesota Senior Care Plus (MSC+)

Minnesota Senior Care Plus

Age 65+
General Minnesota resident, MA-eligible, not on Medicare.
Income Limits (2025) ~$1,255/month (100% FPL); spenddown allowed.
Asset Limits $3,000 (individual), $6,000 (couple).
MN

Includes EW services; 7 health plans available.

Benefits
Personal care (5-7 hours/day) Respite Adult day care Home mods Limited nursing home care

Consumer Support Grant (CSG)

Minnesota Consumer Support Grant

Age 65+ or disabled
General Minnesota resident, eligible for MA personal care but opts for grant.
Income Limits (2025) ~$1,255/month (MA-eligible); spenddown allowed.
Asset Limits $3,000 individual
MN

Can hire family; statewide via counties.

Benefits
Cash (~$500-$1,500/month) for personal care Respite Home mods Assistive tech

Medicare Savings Program (MSP)

Minnesota Medicare Savings Program

Age 65+ or disabled
General Minnesota resident, Medicare Part A/B.
Income Limits (2025) ~$2,510/month (QMB), ~$3,380/month (SLMB), ~$3,598/month (QI)—individual.
Asset Limits $9,430 (individual), $14,130 (couple).
MN

Three tiers; no waitlist; includes Extra Help for Part D.

Benefits
Covers Part B premiums ($174.70/month) Deductibles ($240/year) Copays (~20%)

VA Aid and Attendance (A&A) and Housebound Benefits

Minnesota VA Aid and Attendance/Housebound

Age 65+ or disabled veteran/spouse
General Minnesota resident, wartime service, need for ADL help (A&A) or homebound.
Income Limits (2025) Net income < ~$1,984/month (veteran with dependent, A&A); pension offsets income.
Asset Limits ~$155,356 net worth limit
MN

High veteran demand in rural/urban areas.

Benefits
Cash (~$1,433-$2,642/month veteran, ~$951-$1,318 spouse) for care costs (e.g., in-home, assisted living)

Places of interest near The Estates at Roseville

Address 2.0 miles from city center Info Estimated distance in miles from Roseville's city center to The Estates at Roseville's address, calculated via Google Maps.

Calculate Travel Distance to The Estates at Roseville

Add your location

Address

Staffing Data (Q2 2025)

This data corresponds to Q2 2025 and is based on CMS Payroll-Based Journal.

Total staff 299
Employees 161
Contractors 138
Staff to resident ratio 2.21:1
0% compared with Minnesota average

Minnesota average ratio: 2.22:1

Avg staff/day 71
Average shift 8.1 hours
8% better than Minnesota average

Minnesota average: 7.5 hours

Total staff hours (quarter) 52,153
Nursing staff breakdown
Registered Nurse

Manages medical care and health needs.

Total count 86
Average shift length Info Average shift length. Calculated as total hours divided by days worked and average staff per day. 8.7 hours

This role is partially covered by contractors.

Licensed Practical Nurse

Assists with medical care and medications.

Total count 56
Average shift length Info Average shift length. Calculated as total hours divided by days worked and average staff per day. 8.8 hours

This role is partially covered by contractors.

Certified Nursing Assistant

Helps with daily care and mobility.

Total count 90
Average shift length Info Average shift length. Calculated as total hours divided by days worked and average staff per day. 8.1 hours

This role is partially covered by contractors.

Contractor staffing

Total hours from contractors

11.3%

5,887 contractor hours this quarter

Registered Nurse: 66 Licensed Practical Nurse: 33 Certified Nursing Assistant: 9 Physical Therapy Aide: 8 Speech Language Pathologist: 7 Physical Therapy Assistant: 6 Respiratory Therapy Technician: 5 Qualified Social Worker: 2 Medical Director: 1 Occupational Therapy Assistant: 1
Staff by category
Certified Nursing Assistant8199023,36791100%8.1
Licensed Practical Nurse2333567,24891100%8.8
Registered Nurse2066865,41491100%8.7
Medication Aide/Technician130134,04791100%8.8
Other Dietary Services Staff5051,8329099%7.5
Clinical Nurse Specialist6061,7446976%7.5
RN Director of Nursing6061,7107178%8
Dental Services Staff3031,4106774%7.9
Physical Therapy Aide0881,2217684%6.6
Speech Language Pathologist0771,1706774%6.7
Administrator2029506875%7.8
Physical Therapy Assistant0665177886%6
Nurse Practitioner1014776470%7.4
Occupational Therapy Aide1013314549%7.3
Qualified Social Worker0223276571%5
Respiratory Therapy Technician0553226976%4.4
Occupational Therapy Assistant011461213%3.8
Medical Director0112433%8
90 Certified Nursing Assistant
% of Days 100%
56 Licensed Practical Nurse
% of Days 100%
86 Registered Nurse
% of Days 100%
13 Medication Aide/Technician
% of Days 100%
5 Other Dietary Services Staff
% of Days 99%
6 Clinical Nurse Specialist
% of Days 76%
6 RN Director of Nursing
% of Days 78%
3 Dental Services Staff
% of Days 74%
8 Physical Therapy Aide
% of Days 84%
7 Speech Language Pathologist
% of Days 74%
2 Administrator
% of Days 75%
6 Physical Therapy Assistant
% of Days 86%
1 Nurse Practitioner
% of Days 70%
1 Occupational Therapy Aide
% of Days 49%
2 Qualified Social Worker
% of Days 71%
5 Respiratory Therapy Technician
% of Days 76%
1 Occupational Therapy Assistant
% of Days 13%
1 Medical Director
% of Days 3%

Facility Characteristics

Source: CMS Long-Term Care Facility Characteristics (Data as of Jan 2026)

Total residents 135
Medicare
7
5.2% of residents
Medicaid
67
49.6% of residents
Private pay or other
61
45.2% of residents
Programs & Services
Residents Group

Residents meet regularly to discuss policies, care quality, and activities

Active Resident Council

Organized group of residents that meets regularly to discuss facility policies, quality of life, and activities.

Quality of care over time

These measures show how residents usually do over time at this home, based on health outcomes and preventive care.

High-risk clinical events score Info A composite score based on pressure ulcers, falls with injury, weight loss, walking ability decline, and activities of daily living decline. 12.4
12% worse than Minnesota average

Minnesota average: 11.1

Functional decline score Info A composite score based on activities of daily living decline, walking ability decline, and incontinence. 23.1
In line with Minnesota average

Minnesota average: 22.6

Long-stay resident measures
Average Minnesota avg: 2.6 Info CMS star rating based on long-stay quality measure performance. 5 stars = significantly above average, 1 star = significantly below average.
Need for Help with Daily Activities Increased Info Percent of long-stay residents whose need for help with daily activities has increased 18.7%
In line with Minnesota average

Minnesota average: 18.9%

Walking Ability Worsened Info Percent of long-stay residents whose ability to move independently worsened 25.3%
6% worse than Minnesota average

Minnesota average: 23.8%

Low Risk Residents with Bowel/Bladder Incontinence Info Percent of low risk long-stay residents who lose control of their bowels or bladder 25.4%
In line with Minnesota average

Minnesota average: 25.0%

Falls with Major Injury Info Percent of long-stay residents experiencing one or more falls with major injury 3.0%
20% better than Minnesota average

Minnesota average: 3.7%

High Risk Residents with Pressure Ulcers Info Percent of long-stay high risk residents with pressure ulcers 7.9%
45% worse than Minnesota average

Minnesota average: 5.4%

Urinary Tract Infection Info Percent of long-stay residents with a urinary tract infection 1.2%
58% better than Minnesota average

Minnesota average: 2.7%

Lost Too Much Weight Info Percent of long-stay residents who lose too much weight 7.1%
73% worse than Minnesota average

Minnesota average: 4.1%

Depressive Symptoms Info Percent of long-stay residents who have depressive symptoms 8.1%
86% worse than Minnesota average

Minnesota average: 4.4%

Antipsychotic Use Info Percent of long-stay residents who received an antipsychotic medication 26.5%
54% worse than Minnesota average

Minnesota average: 17.2%

Pneumococcal Vaccine Info Percent of long-stay residents assessed and appropriately given the pneumococcal vaccine 90.6%
7% worse than Minnesota average

Minnesota average: 97.3%

Influenza Vaccine Info Percent of long-stay residents assessed and appropriately given the seasonal influenza vaccine 95.1%
In line with Minnesota average

Minnesota average: 96.0%

Hospitalizations per 1,000 days Info Number of hospitalizations per 1,000 long-stay resident days. 1.50
10% better than Minnesota average

Minnesota average: 1.67

ED visits per 1,000 days Info Number of outpatient emergency department visits per 1,000 long-stay resident days. 1.51
24% better than Minnesota average

Minnesota average: 1.99

Short-stay resident measures
Average Minnesota avg: 3.1 Info CMS star rating based on short-stay quality measure performance. 5 stars = much above average, 1 star = much below average.
Pneumococcal Vaccine Info Percent of short-stay residents assessed and appropriately given the pneumococcal vaccine 75.5%
15% worse than Minnesota average

Minnesota average: 88.9%

Antipsychotic medication increase Info Percent of short-stay residents who newly received an antipsychotic medication 1.5%
20% better than Minnesota average

Minnesota average: 1.9%

Influenza Vaccine Info Percent of short-stay residents assessed and appropriately given the seasonal influenza vaccine 62.8%
24% worse than Minnesota average

Minnesota average: 82.6%

Re-hospitalized after SNF stay Info Percentage of short-stay residents who were re-hospitalized after their nursing home admission. 23.4%
In line with Minnesota average

Minnesota average: 23.1%

Emergency department visits Info Percentage of short-stay residents who had an outpatient emergency department visit. 7.1%
49% better than Minnesota average

Minnesota average: 14.0%

Falls with major injury Info Percentage of SNF residents who experience falls with major injury during their stay. 0.9%
19% worse than Minnesota average

Minnesota average: 0.8%

Ability to care for self at discharge Info Percentage of residents at or above expected ability to care for themselves at discharge. 38.6%
28% worse than Minnesota average

Minnesota average: 53.7%

Successful return to home or community Info Rate of successful return to home or community from a skilled nursing facility. 41.6%
18% worse than Minnesota average

Minnesota average: 50.6%

Penalties and fines

Federal penalties imposed by CMS for regulatory violations, including civil money penalties (fines) and denials of payment for new Medicare/Medicaid admissions.

Source: CMS Penalties Database (Data as of Jan 2026)

Total fines amount $22K
50% lower than Minnesota average

Minnesota average: $44K

Number of fines 2 Rank #25 / 42Federal fines — state benchmarkedThis home is ranked 25th out of 42 homes in Minnesota.Shows this facility's CMS fine count alongside the Minnesota average, and where it ranks among all 42 skilled nursing facilities in the state. Fewer fines mean a better rank.
In line with Minnesota average

Minnesota average: 2.0

Payment Denials Info Serious action where Medicare and/or Medicaid temporarily stops payments for new residents until issues are fixed. 0
100% fewer payment denials than Minnesota average

Minnesota average: 0.4

Fines amount comparison
This facility $22K
Minnesota average $44K
Penalty History

Penalties are imposed by CMS for violations of federal nursing home regulations.

Civil Money Penalty Info Fines imposed for noncompliance, which can be assessed per day or per instance of violation. Jan 10, 2023
$8K
Civil Money Penalty Info Fines imposed for noncompliance, which can be assessed per day or per instance of violation. Jan 10, 2023
$14K

Last updated: Jan 2026

Guides for Better Senior Living

Care Cost Calculator: See Prices in Your Area

Nursing Home Data Explorer

Don’t Wait Too Long: 7 Red Flag Signs Your Parent Needs Assisted Living Now

The True Cost of Assisted Living in 2025 – And How Families Are Paying For It

Understanding Senior Living Costs: Pricing Models, Discounts & Financial Assistance

Tour Icon
Planning a tour? Check our touring checklist.
Chat Icon
Thinking of living here? We can help you speak to a current resident
Explore Open Rooms
1 Contact details
2 What type of senior care service are you looking for?
3 What budget do you have in mind for senior care?
4 How soon do you need to find care?
5 Additional details

Thank you for your interest!

Our team will be in touch shortly to help with next steps.