


Total staff
177
Employees
175
Contractors
2

The Folsom Center is a compassionate nursing home in Cullman, AL, that offers long-term care, memory care, rehabilitation, and respite care. With its warm and welcoming environment, the community promises comfort and healing for older adults. 24-hour care, medical and non-medical assistance, and therapy services are offered to help residents recover and live to their potential. Residents can also keep their peace of mind, especially with personalized care plans.
Mind-stimulating activities, light exercises, and plenty of recreational programs are dedicated to enhancing residents’ cognition and promoting an active lifestyle. Private rooms, lively communal spaces, and a state-of-the-art therapy gym ensure residents can rest without hassles. The Cullman Regional Medical Center is also located nearby, providing residents with easy access to their medical needs. This nursing home continuously provides a wide range of care, making it one of the best options for senior living in Alabama.
| Staff type | Hours / Day / Resident | vs state avg |
|---|---|---|
|
Registered Nurse (RN)
| 45m per day | ▲ 15% State avg: 39m per day · National avg: 41m per day |
|
LPN / LVN
| 48m per day | ■ Avg State avg: 47m per day · National avg: 52m per day |
|
Nurse Aide
| 2h 59m per day | ▲ 20% State avg: 2h 30m per day · National avg: 2h 20m per day |
|
Weekend Total Nursing
| 3h 49m per day | ▲ 15% State avg: 3h 18m per day · National avg: 3h 27m per day |
|
Physical Therapist
| 2m per day | ▲ 9% State avg: 2m per day · National avg: 4m per day |
|
Weekend RN
| 26m per day | ▲ 22% State avg: 22m per day · National avg: 29m per day |
Reporting period: October 1 – December 31, 2025 (Q4 2025). Source: CMS Payroll-Based Journal report.
Manages medical care and health needs.
Assists with medical care and medications.
Helps with daily care and mobility.
Total hours from contractors
129 contractor hours this quarter
| Certified Nursing Assistant | 83 | 0 | 83 | 19,591 | 92 | 100% | 7.4 |
| Licensed Practical Nurse | 13 | 0 | 13 | 5,671 | 92 | 100% | 10.3 |
| Medication Aide/Technician | 7 | 0 | 7 | 3,324 | 92 | 100% | 10.3 |
| Clinical Nurse Specialist | 9 | 0 | 9 | 3,085 | 86 | 93% | 8.7 |
| Registered Nurse | 8 | 0 | 8 | 2,784 | 92 | 100% | 8.4 |
| Nurse Aide in Training | 19 | 0 | 19 | 2,145 | 91 | 99% | 7.1 |
| Therapeutic Recreation Specialist | 7 | 0 | 7 | 1,079 | 81 | 88% | 6.1 |
| Other Dietary Services Staff | 2 | 0 | 2 | 1,029 | 77 | 84% | 7.9 |
| RN Director of Nursing | 2 | 0 | 2 | 996 | 66 | 72% | 8.3 |
| Respiratory Therapist | 9 | 0 | 9 | 551 | 72 | 78% | 6.1 |
| Qualified Activities Professional | 2 | 0 | 2 | 491 | 61 | 66% | 8 |
| Dietitian | 1 | 0 | 1 | 472 | 61 | 66% | 7.7 |
| Administrator | 1 | 0 | 1 | 456 | 57 | 62% | 8 |
| Mental Health Service Worker | 1 | 0 | 1 | 432 | 55 | 60% | 7.9 |
| Qualified Social Worker | 1 | 1 | 2 | 417 | 62 | 67% | 6.6 |
| Physical Therapy Assistant | 6 | 0 | 6 | 404 | 65 | 71% | 4.7 |
| Nurse Practitioner | 2 | 0 | 2 | 352 | 44 | 48% | 8 |
| Respiratory Therapy Technician | 2 | 1 | 3 | 330 | 71 | 77% | 3.6 |
Federal penalties imposed by CMS for regulatory violations, including civil money penalties (fines) and denials of payment for new Medicare/Medicaid admissions.
Source: CMS Penalties Database
No penalties in the past 3 years
No civil money penalties or payment denials were reported in the last 3 years.
These measures show how residents usually do over time at this home, based on health outcomes and preventive care.
Alabama average: 8.9
Alabama average: 14.5
Alabama average: 13.9%
Alabama average: 16.1%
Alabama average: 13.6%
Alabama average: 3.4%
Alabama average: 5.9%
Alabama average: 2.7%
Alabama average: 5.4%
Alabama average: 1.2%
Alabama average: 20.7%
Alabama average: 91.5%
Alabama average: 94.8%
Alabama average: 83.7%
Alabama average: 2.1%
Alabama average: 80.3%
Quality measures are calculated from Minimum Data Set (MDS) assessments. For most measures, lower percentages indicate better care quality.
49% of new residents, usually for short-term rehab.
41% of new residents, often for short stays.
10% of new residents, often for long-term daily care.
Source: CMS Long-Term Care Facility Characteristics (Data as of Jan 2026)
Residents meet regularly to discuss policies, care quality, and activities
Family members meet regularly to discuss policies, care quality, and activities
Organized group of family members that meets regularly to discuss facility policies, resident care, and activities.
Organized group of residents that meets regularly to discuss facility policies, quality of life, and activities.
Data sourced from CMS Long-Term Care Facility Characteristics quarterly report. Payer mix reflects the current resident census by primary payment source.
Historical financial and operational data for The Folsom Center from 2012–2022, based on CMS SNF Cost Reports.
Key figures below are for fiscal year ending in 12/2022 — the home's most recent complete cost report, an older period than most facilities report.
Based on the home's most recent complete CMS SNF Cost Report — fiscal year ending in 12/2022. This is an older period than most facilities report, so compare with that in mind.
No pets allowed
Housing Options: Private Rooms
Building Type: Mid-rise
Housekeeping Services
Social and Recreational Activities

On-site Medical Care and Health Services
Most residents typically stay for a few weeks or months before returning home or moving on.
New residents most often arrive under Medicare (49% of admissions), and a typical Medicare stay runs around 20 days.
Coverage residents most often arrive under.
Coverage residents most often leave under.
![]() 0.7 miles from city center
0.7 miles from city center
![]() Estimated distance in miles from Ne Cullman's city center to The Folsom Center's address, calculated via Google Maps.
Estimated distance in miles from Ne Cullman's city center to The Folsom Center's address, calculated via Google Maps.
Add your location
Info below is compiled from CMS reports & the AL Dept. of Public Health (ADPH), senior community websites & trusted data sources such as Walk Score & BBB.
Communities are listed from highest to lowest based on our ranking methodology.
| Albertville Nursing Home | NH RC SNF | North Albertville | 159
Facility
159
AL AVG
90
Rank
#23 / 241 |
97.5%
Facility
97.5%
AL AVG
78.3
Rank
#5 / 108 | +24% | 5.06
Facility
5.06
AL AVG
4.37
Rank
#15 / 126 | -21% | +16% | $0
Facility
$0
AL AVG
$59.8k
Rank
#1 / 127 | 9
Facility
9
AL AVG
10.4
Rank
#53 / 126 | 3.0
Facility
3.0
AL AVG
3.5
Rank
#47 / 126 | - | 155 | - |
66
Facility
66
AL AVG
36
Rank
#33 / 417 | Terri Brown | $18.0MFiscal year ending 06/2024
Facility
$18.0MFiscal year ending 06/2024
AL AVG
$11.1M
Rank
#17 / 125 | $10.6MFiscal year ending 06/2024
Facility
$10.6MFiscal year ending 06/2024
AL AVG
$4.7M
Rank
#5 / 125 | 58.9%Fiscal year ending 06/2024
Facility
58.9%Fiscal year ending 06/2024
AL AVG
45%
Rank
#22 / 121 | 15163 | ||||
| Piedmont Health Care Center | NH AL MC SNF | Piedmont | 91
Facility
91
AL AVG
90
Rank
#99 / 241 |
92.3%
Facility
92.3%
AL AVG
78.3
Rank
#25 / 108 | +18% | 5.41
Facility
5.41
AL AVG
4.37
Rank
#6 / 126 | -49% | +24% | $0
Facility
$0
AL AVG
$59.8k
Rank
#1 / 127 | 3
Facility
3
AL AVG
10.4
Rank
#5 / 126 | 3.0
Facility
3.0
AL AVG
3.5
Rank
#47 / 126 | - | 84 | - |
61
Facility
61
AL AVG
36
Rank
#58 / 417 | Piedmont Health Care Center | $9.3MFiscal year ending 06/2024
Facility
$9.3MFiscal year ending 06/2024
AL AVG
$11.1M
Rank
#76 / 125 | $5.6MFiscal year ending 06/2024
Facility
$5.6MFiscal year ending 06/2024
AL AVG
$4.7M
Rank
#41 / 125 | 60.9%Fiscal year ending 06/2024
Facility
60.9%Fiscal year ending 06/2024
AL AVG
45%
Rank
#14 / 121 | 15194 | ||||
| Southern Springs Healthcare | NH SNF | Union Springs | 123
Facility
123
AL AVG
90
Rank
#58 / 241 |
86.2%
Facility
86.2%
AL AVG
78.3
Rank
#53 / 108 | +10% | 4.65
Facility
4.65
AL AVG
4.37
Rank
#39 / 126 | -46% | +6% | $0
Facility
$0
AL AVG
$59.8k
Rank
#1 / 127 | 7
Facility
7
AL AVG
10.4
Rank
#38 / 126 | 2.3
Facility
2.3
AL AVG
3.5
Rank
#26 / 126 | - | 106 | - |
61
Facility
61
AL AVG
36
Rank
#58 / 417 | Estate Of Milton E. Mcgregor | $10.2MFiscal year ending 06/2024
Facility
$10.2MFiscal year ending 06/2024
AL AVG
$11.1M
Rank
#107 / 125 | $7.1MFiscal year ending 06/2024
Facility
$7.1MFiscal year ending 06/2024
AL AVG
$4.7M
Rank
#34 / 125 | 69.9%Fiscal year ending 06/2024
Facility
69.9%Fiscal year ending 06/2024
AL AVG
45%
Rank
#1 / 121 | 15171 | ||||
| Arbor Woods Health and Rehab | NH SNF | Reform | 85
Facility
85
AL AVG
90
Rank
#112 / 241 |
59.5%
Facility
59.5%
AL AVG
78.3
Rank
#93 / 108 | -24% | 6.07
Facility
6.07
AL AVG
4.37
Rank
#3 / 126 | +17% | +39% | $0
Facility
$0
AL AVG
$59.8k
Rank
#1 / 127 | 2
Facility
2
AL AVG
10.4
Rank
#3 / 126 | 1.0
Facility
1.0
AL AVG
3.5
Rank
#1 / 126 | - | 51 | A+ |
36
Facility
36
AL AVG
36
Rank
#210 / 417 | Linda Dill | $5.1MFiscal year ending 06/2024
Facility
$5.1MFiscal year ending 06/2024
AL AVG
$11.1M
Rank
#121 / 125 | $3.5MFiscal year ending 06/2024
Facility
$3.5MFiscal year ending 06/2024
AL AVG
$4.7M
Rank
#110 / 125 | 68.5%Fiscal year ending 06/2024
Facility
68.5%Fiscal year ending 06/2024
AL AVG
45%
Rank
#4 / 121 | 15141 | ||||
| The Folsom Center | NH MC RC SNF | Ne Cullman (Arnold Street Northeast) | 102
Facility
102
AL AVG
90
Rank
#82 / 241 |
89.3%
Facility
89.3%
AL AVG
78.3
Rank
#37 / 108 | +14% | 4.81
Facility
4.81
AL AVG
4.37
Rank
#29 / 126 | -56% | +10% | $0
Facility
$0
AL AVG
$59.8k
Rank
#1 / 127 | 12
Facility
12
AL AVG
10.4
Rank
#86 / 126 | 4.0
Facility
4.0
AL AVG
3.5
Rank
#87 / 126 | - | 91 | - |
67
Facility
67
AL AVG
36
Rank
#29 / 417 | David Huggins | $8.7M*Fiscal year ending 12/2022These figures are from this home's most recent complete cost report — an older period than most facilities report. Compare with that in mind.
Facility
$8.7M*Fiscal year ending 12/2022These figures are from this home's most recent complete cost report — an older period than most facilities report. Compare with that in mind.
AL AVG
$11.1M
Rank
#88 / 125 | $4.8M*Fiscal year ending 12/2022These figures are from this home's most recent complete cost report — an older period than most facilities report. Compare with that in mind.
Facility
$4.8M*Fiscal year ending 12/2022These figures are from this home's most recent complete cost report — an older period than most facilities report. Compare with that in mind.
AL AVG
$4.7M
Rank
#54 / 125 | 55.5%*Fiscal year ending 12/2022These figures are from this home's most recent complete cost report — an older period than most facilities report. Compare with that in mind.
Facility
55.5%*Fiscal year ending 12/2022These figures are from this home's most recent complete cost report — an older period than most facilities report. Compare with that in mind.
AL AVG
45%
Rank
#17 / 121 | 15437 |
The Folsom Center is in the Arnold Street Northeast neighborhood.
The Folsom Center has a walk score of 67. Moderately walkable. Some errands can be accomplished on foot, with a mix of nearby amenities.
The Folsom Center's occupancy is 85.2%.
No, The Folsom Center has a no-pet policy.
The Folsom Center is registered as a for-profit.
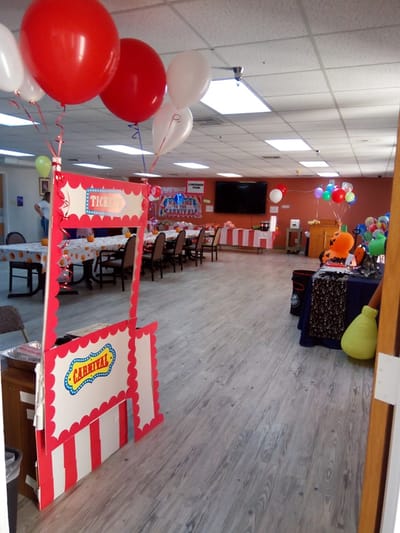
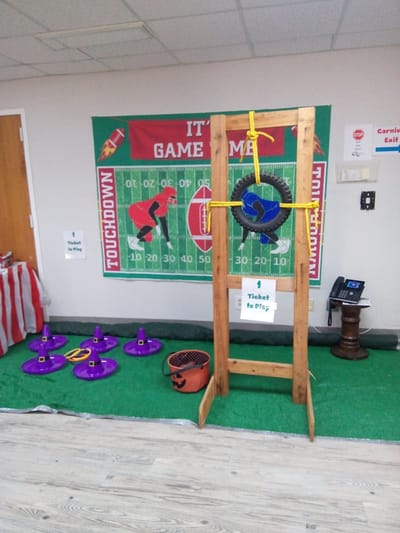
Yes — there are 3 photos of The Folsom Center in the photo gallery on this page.
The Folsom Center is located at 401 Arnold St, Ne Cullman, AL 35055.
Care Cost Calculator: See Prices in Your Area
Nursing Home Data Explorer
Don’t Wait Too Long: 7 Red Flag Signs Your Parent Needs Assisted Living Now
The True Cost of Assisted Living in 2025 – And How Families Are Paying For It
Understanding Senior Living Costs: Pricing Models, Discounts & Financial Assistance


