The Grove at Los Gatos

Assisted Living in San Jose

CMS overall rating Info The Overall CMS Rating is scored from 1 to 5 stars and combines results from health inspections, staffing levels, and quality measures. Health inspections carry the most weight. Staffing and quality scores can increase or decrease the final rating based on performance compared to state and national standards.

Overview of The Grove at Los Gatos

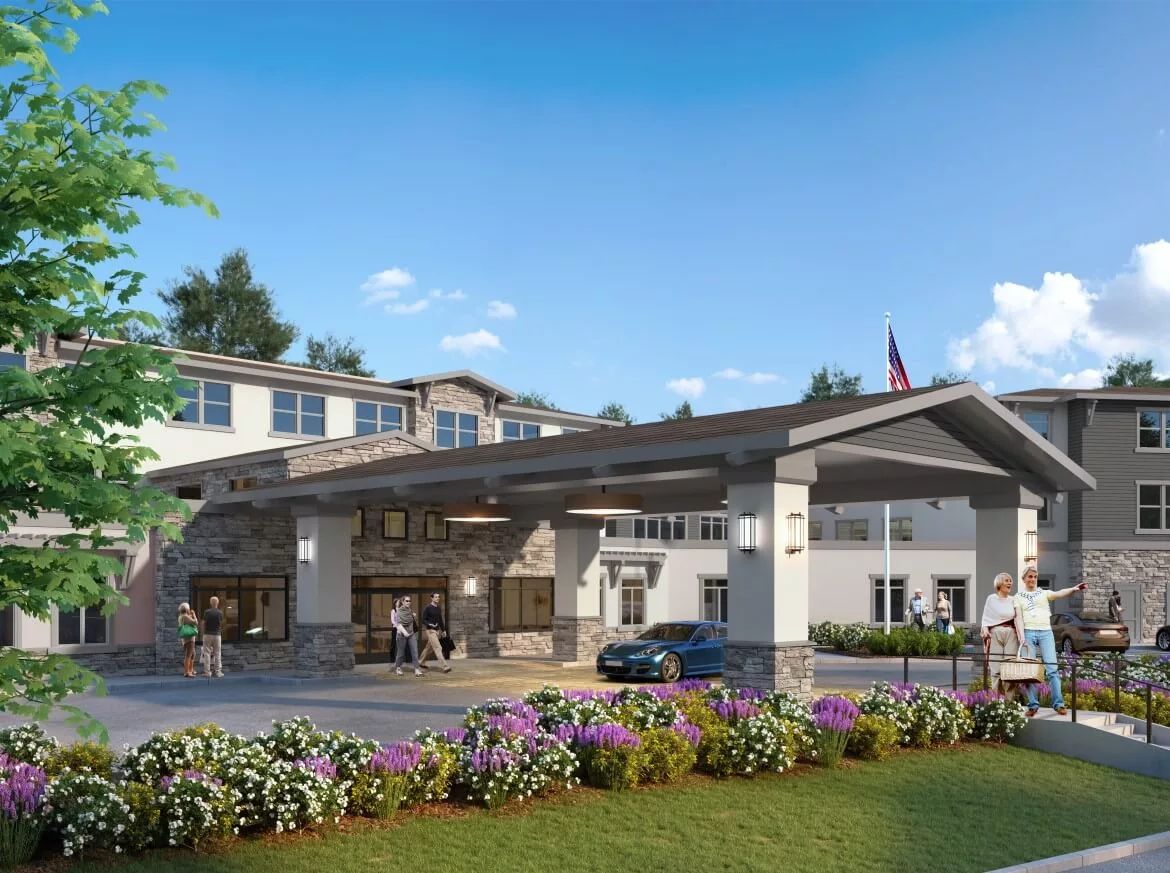
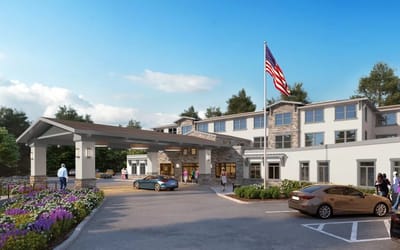
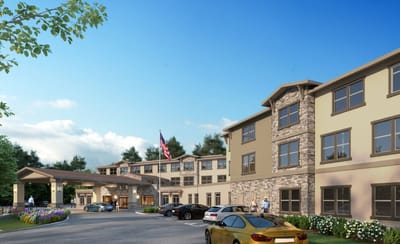
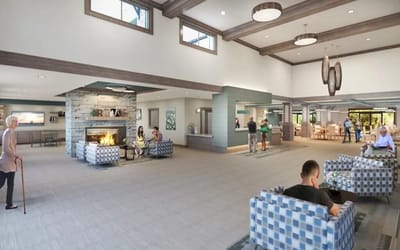
The Grove at Los Gatos is a trusted assisted living community in Los Gatos, CA, that offers personal care and memory care. With older adults’ comfort and safety in mind, the community promotes a home-like setting with its thoughtfully designed floor plans. Chef-prepared dining, daily activities, and scheduled transportation are also offered to enhance residents’ living experiences. The community strives to provide older adults with a better quality of life in their later years through personalized care plans.

Bingo, happy hours, and trips to local amenities are just some of the recreational activities offered to ensure residents can explore new interests and meet new friends. An on-site medical exam room, a salon, and an emergency call system are also available for residents’ convenience and safety. With its serene setting near Vacona Lake County Park in Los Gatos, the community fosters a relaxing atmosphere where residents have a laid-back retirement. As one of California’s esteemed senior living communities, this community is a great option for a worry-free retirement.

(408) 857-6342

Quality ratings

Measured by Centers for Medicare & Medicaid Services (CMS)

Overall rating Info The Overall CMS Rating combines results from health inspections, staffing levels and quality measures. Health inspections carry the most weight. Staffing and quality scores can increase or decrease the final rating based on performance compared to state and national standards.
5/5 ▲ 1.4 California average: 3.6/5
Health Inspection Info Based on the results of the facility's three most recent standard inspections and any complaint investigations. CMS reviews the number, scope, and severity of deficiencies, with more recent findings weighted more heavily.
4/5 ▲ 0.9 California average: 3.2/5
Staffing Info Measures average nursing staff hours per resident per day, including Registered Nurses (RNs) and total nursing staff. Ratings are adjusted based on the level of care residents require and are compared to state and national benchmarks.
5/5 ▲ 1.6 California average: 3.5/5
Quality Measures Info Based on clinical and physical health indicators reported to CMS, such as hospital readmissions, falls, pressure ulcers, and improvements in mobility. These measures reflect how well residents' health needs are being managed.
5/5 ▲ 0.7 California average: 4.3/5

Staffing hours breakdown

Info Daily nursing hours per resident by staff type, reported to CMS. Higher is generally better — compare this facility to state and national averages to see where staffing stands.

Hours per resident per day — compared to California state averages

Total nursing care / resident Info This home is ranked 123rd out of 294 homes in California.

Total adjusted nursing hours per resident per day, combining RN, LPN, and aide time. CMS adjusts this for case-mix so facilities can be fairly compared.
4h 14m per day
Rank #123 / 294Nurse hours — state benchmarkedThis home is ranked 123rd out of 294 homes in California.Shows adjusted nurse hours per resident per day benchmarked to the California average, with a ranking across 294 California SNFs. More hours mean more direct care. The national average is about 3.5 hrs; below 3.0 is a red flag.
This facility California avg (4h 23m per day)
vs California avg
-3%
Staff type Hours / day vs state avg
Total Nursing (Weekend) Info Combined nursing hours (RN + LPN + Nurse Aide) per resident per day on weekends. Staffing often drops on weekends — this figure reveals whether the facility maintains adequate coverage outside of weekday hours. 4h 2m per day

Capacity and availability

Avg. Length of Stay
24 days

Who this home usually serves

TYPE OF STAY

Mostly short-term rehab stays

Most residents typically stay for a few weeks or months before returning home or moving on.

Might be optimal for
Short stays Recovery Medicare-covered care

Breakdown by payment type

Medicare

73% of new residents, usually for short-term rehab.

Typical stay 21 days

Private pay

27% of new residents, often for short stays.

Typical stay 1 - 2 years

Finances and operations

Voluntary non-profit community
Home revenue
$41.1M
Surplus of revenue
$5.0M
Voluntary non-profit community
Home revenue
$41.1M Rank #11 / 299Revenue — state benchmarkedThis home is ranked 11th out of 299 homes in California.Shows this facility's annual revenue compared to the California SNF average. Higher revenue generally means more resources for staffing and capital — read alongside Payroll %.
Surplus of revenue
$5.0M
Payroll costs Info The portion of the home's budget spent on staff, including nurses, caregivers, and other employees who support care and operations. Rank #17 / 299Payroll — state benchmarkedThis home is ranked 17th out of 299 homes in California.Shows total annual staff payroll benchmarked to the California average. Higher payroll investment relative to peers often signals better staffing and less reliance on cheaper contract labor.
$14.3M
34.8% of revenue Rank #226 / 299Payroll % — state benchmarkedThis home is ranked 226th out of 299 homes in California.Shows payroll as a percentage of revenue versus the California average. Well-run SNFs often land around 55–65%. Below 25% may signal understaffing or heavy agency use — read with Staffing ratings.
Other operating costs Info All remaining costs needed to run the home, such as food, utilities, building maintenance, supplies and administrative expenses.
$21.9M
Total costs $36.2M
Bed community size
150-bed community
A larger shared setting that may offer more common spaces and organized community services.
Walk Score
Walk Score: 55 / 100 Rank #171 / 243Walk Score — state benchmarkedThis home is ranked 171st out of 243 homes in California.Shows how walkable this facility's neighborhood is compared to the average Walk Score across California SNFs. Higher scores benefit residents, families, and staff.
Moderately walkable. Some errands can be accomplished on foot, with a mix of nearby amenities.

About this community

Occupancy

Occupancy rate
0%
Rank #190 / 301Occupancy rate — state benchmarkedThis home is ranked 190th out of 301 homes in California.Shows this facility's occupancy rate versus the California average, with its statewide rank out of 301. Higher occupancy signals strong local demand and financial stability.
Lower than the California average: 72.8%
Occupied beds
0 / 150
Average residents 87 per day

License Details

Facility TypeResidential Care Elderly
StatusLicensed
IssuanceJune 6, 2025
CountySanta Clara
CMS Certification Number555547

Ownership & Operating Entity

The Grove at Los Gatos is legally operated by Blossom Hill Los Gatos, Inc.; Calson Mgmt, Llc, and administrated by Holtman, Erika.

Memory & Specialized Care

1 service
Alzheimer's Certification

What does this home offer?

Pets allowed icon
Pets allowed icon

Pets Allowed: Yes, Pets Allowed

Housing options icon

Housing Options: Studio / 1 Bed / 2 Bed

Building type icon
Building type icon

Building Type: 3-story

Meal Preparation icon

Meal Preparation

Types of Care at The Grove at Los Gatos

Assisted Living

Contact The Grove at Los Gatos

Inspection History

In California, the Department of Social Services (for assisted living facilities) and the Department of Public Health (for nursing homes) conduct inspections to ensure resident safety and regulatory compliance.

1 visit Info Inspections are mandatory, regular evaluations conducted by state health departments or regulatory agencies. They ensure the community provides safe, compliant care, covering areas like resident health, staff and management.

California average: 16 visits

Breakdown by visit type

0 total complaint visits

1 other visit Info Other visits include regulatory visits that are not routine inspections or complaint investigations, such as administrative check-ins, follow-up reviews, or licensing-related visits.

California average

13 total complaint visits

7 other visits

0 serious citations

A violation that poses an immediate risk to resident health or safety, or represents a substantial failure to comply with licensing requirements.

California average: 3 serious citations

0 moderate citations

A violation that does not pose an immediate risk to resident health or safety but requires correction to remain in compliance.

California average: 4 moderate citations

Latest inspection

Date June 5, 2025
Original Licensing

Inspection Report Summary for The Grove at Los Gatos

The facility’s state inspection record is mostly clean, with no deficiencies found during its June 5, 2025 prelicensing inspection. Inspectors evaluated safety systems, temperature controls, and medication security without identifying any issues. No complaints were investigated or substantiated during this period.

Health Inspection History

Inspections
Total health inspections 7

California average 12.5


Last Health inspection on Mar 2024

Total health citations
33 Rank #132 / 298Health citations — state benchmarkedThis home is ranked 132nd out of 298 homes in California.Shows this facility's total health deficiency citations benchmarked to the California state average, with a ranking across all 298 CA SNFs. Lower citation counts earn a better rank.

California average 50.2

Citations per inspection
4.71

California average 4.65


Health citations are formal notices following inspections when they fail to comply with safety and care standards.

25 of 33 citations resulted from standard inspections; and 8 of 33 resulted from complaint investigations.

Breakdown of citation severity (last 3 years)
Critical Health citations More info
0 Rank #133 / 147Severe citations — state benchmarkedThis home is ranked 133rd out of 147 homes in California.Shows citations where actual resident harm occurred, compared to the California average and ranked across 147 SNFs statewide. Even a single severe citation is significant — lower is always better.
100% better than California average

California average: 0.4


Serious Health citations More info 5
400% worse than California average

California average: 1

0 critical citations More info California average: 0.4

5 serious citations More info California average: 1

28 moderate citations More info California average: 47.2

0 minor citations More info California average: 1.5
Citations history (last 3 years)
Pharmacy moderate citation Info Issues related to medication management, including how drugs are stored, administered, and monitored. Mar 21, 2024
Corrected

Quality of Care moderate citation Info Issues related to how well residents receive appropriate treatment and support for their medical and daily care needs. Mar 21, 2024
Corrected

Care Planning moderate citation Info Issues related to creating and updating personalized care plans for residents based on their needs and conditions. Nov 09, 2023
Corrected

Care Planning serious citation Info Issues related to creating and updating personalized care plans for residents based on their needs and conditions. Nov 09, 2023
Corrected

Compare Assisted Living around Los Gatos The information below is reported by the California Department of Social Services and Department of Public Health.

Filter by care type
Belmont Village Senior Living Los Gatos
AL

Assisted Living A licensed, long-term care setting for seniors or individuals with disabilities who need help with daily activities — like bathing, dressing, and medication management — but not 24-hour skilled nursing. Offers housing, meals, and around-the-clock support while aiming to maximize resident independence.

MC

Memory Care Secured, specialized care for people living with Alzheimer's or dementia. Staff trained in cognitive impairment, with higher staff-to-resident ratios and an environment designed to reduce confusion and wandering risk.

San Jose (Union) 175 Yes 66 4 5 3 4 74.9% - Belmont Union Avenue Tenant Llc; Belmont Three Llc Studio / 1 Bed / 2 Bed
Brookdale San Jose
AL

Assisted Living A licensed, long-term care setting for seniors or individuals with disabilities who need help with daily activities — like bathing, dressing, and medication management — but not 24-hour skilled nursing. Offers housing, meals, and around-the-clock support while aiming to maximize resident independence.

San Jose (South San Jose) 153 Yes 71 4 28 8 11 62.1% - Blc-Atrium At San Jose Lp Studio / 1 Bed / 2 Bed
The Grove at Los Gatos
NH

Nursing Home Licensed facility providing 24/7 skilled nursing care for residents with complex, ongoing medical needs. Staffed by RNs, LPNs, and CNAs. Inspected and star-rated annually by CMS. Accepts Medicare (short-term rehab) and Medicaid (long-term care).

AL

Assisted Living A licensed, long-term care setting for seniors or individuals with disabilities who need help with daily activities — like bathing, dressing, and medication management — but not 24-hour skilled nursing. Offers housing, meals, and around-the-clock support while aiming to maximize resident independence.

Los Gatos 150 Yes 55 0 0 0 - 82.5% - Blossom Hill Los Gatos, Inc.; Calson Mgmt, Llc Studio / 1 Bed / 2 Bed
Belmont Village Senior Living San Jose
AL

Assisted Living A licensed, long-term care setting for seniors or individuals with disabilities who need help with daily activities — like bathing, dressing, and medication management — but not 24-hour skilled nursing. Offers housing, meals, and around-the-clock support while aiming to maximize resident independence.

MC

Memory Care Secured, specialized care for people living with Alzheimer's or dementia. Staff trained in cognitive impairment, with higher staff-to-resident ratios and an environment designed to reduce confusion and wandering risk.

San Jose (West Valley) 150 Yes 89 4 12 1 12 70.7% - Belmont Village San Jose Tnnt & Lp; Belmont Three Studio / 1 Bed
Atria Evergreen Valley
AL

Assisted Living A licensed, long-term care setting for seniors or individuals with disabilities who need help with daily activities — like bathing, dressing, and medication management — but not 24-hour skilled nursing. Offers housing, meals, and around-the-clock support while aiming to maximize resident independence.

IL

Independent Living Lifestyle-focused communities for older adults offering dining, activities, and transportation with minimal personal care. Best for active, independent seniors who want community without medical support.

MC

Memory Care Secured, specialized care for people living with Alzheimer's or dementia. Staff trained in cognitive impairment, with higher staff-to-resident ratios and an environment designed to reduce confusion and wandering risk.

San Jose (Evergreen) 134 Yes 29 4 21 3 6 59.7% A- Aoc Ca Opco Gp Ptr,Gp Of Aoc San Felipe Opco;Atria Studio / 1 Bed / 2 Bed

Financial Assistance for
Assisted Living in California

Get Financial aid guidance

Multipurpose Senior Services Program

MSSP (Medi-Cal Waiver)

Age 65+
General California resident, Medi-Cal eligible, nursing home risk.
Income Limits (2025) ~$2,829/month 300% FBR, individual
Asset Limits $2,000 (individual), $3,000 (couple).
CA

County-managed; waitlists possible.

Benefits
In-home support (4-6 hours/day) Respite care (14 days/year) Meals (~$6/meal) Transportation (8 trips/month) Care management

In-Home Supportive Services (IHSS)

California IHSS

Age 65+
General California resident, Medicaid-eligible or low-income.
Income Limits ~$1,732/month individual, Medi-Cal threshold
Asset Limits $2,000 individual
CA

Can hire family as caregivers.

Benefits
Personal care (up to 283 hours/month) Homemaker services Respite (varies)

Multipurpose Senior Services Program (MSSP)

CA MSSP

Age 65+
General California resident, Medi-Cal-eligible, nursing home-eligible but community-capable.
Income Limits ~$2,829/month 300% FBR, individual
Asset Limits $2,000 individual
CA

Available in 38 counties; waitlists common.

Benefits
Case management Respite care (up to 10 days/year) Minor home mods (avg. $500) Adult day care (~$50/day)

Property Tax Postponement Program (PTP)

CA PTP

Age 62+
General California resident, own and live in home, 40% equity.
Income Limits (2025) ~$51,500/year household, adjusted annually
Asset Limits Equity-based; no strict asset cap.
CA

Deferred taxes accrue interest (5% as of 2024); repaid upon sale/death.

Benefits
Property tax deferral (avg. $1,000-$3,000/year, varies by county)

Assisted Living Waiver (ALW)

CA ALW

Age 65+ or disabled
General California resident, Medi-Cal-eligible, nursing home-eligible.
Income Limits ~$2,829/month 300% FBR, individual
Asset Limits $2,000 individual
CA

Available in 15 counties (e.g., LA, Sacramento); waitlists common.

Benefits
Personal care in ALFs (5-7 hours/day) Medication management Social services

California CARES Program

CA CARES

Age
General Caregivers of California residents 60+ needing help with 3+ daily activities; no caregiver age limit.
Income Limits No strict limit; cost-sharing above ~$2,500/month threshold.
Asset Limits Not applicable; need-based.
CA

High demand in urban areas; complements IHSS respite.

Benefits
Respite care (up to 10 days/year) Counseling (4-6 sessions/year) Training (2-3 workshops/year) Supplies (~$200/year)

Low-Income Home Energy Assistance Program (LIHEAP)

CA LIHEAP

Age 60+ priority
General California resident, low-income, utility/heating need.
Income Limits (2025) ~$2,510/month 200% of poverty level, individual
Asset Limits Not applicable; income-focused.
CA

High demand in inland/coastal extremes; weatherization capped at $5,000/home.

Benefits
Utility payments (avg. $500-$1,000/year) Weatherization (e.g., insulation, avg. $1,000-$3,000 savings)

Places of interest near The Grove at Los Gatos

Address 0.6 miles from city center Info Estimated distance in miles from Los Gatos's city center to The Grove at Los Gatos's address, calculated via Google Maps. — 1.66 miles to nearest hospital (Good Samaritan Hospital)

Calculate Travel Distance to The Grove at Los Gatos

Add your location

Address

Staffing Data (Q2 2025)

This data corresponds to Q2 2025 and is based on CMS Payroll-Based Journal.

Total staff 87
Employees 58
Contractors 29
Staff to resident ratio 1.89:1
1891204% better than California average

California average ratio: 0.00:1

Avg staff/day 41
Average shift 7.5 hours
0% compared with California average

California average: 7.7 hours

Total staff hours (quarter) 27,845
Nursing staff breakdown
Registered Nurse

Manages medical care and health needs.

Total count 12
Average shift length Info Average shift length. Calculated as total hours divided by days worked and average staff per day. 6.7 hours

No contractors work on this role.

Licensed Practical Nurse

Assists with medical care and medications.

Total count 9
Average shift length Info Average shift length. Calculated as total hours divided by days worked and average staff per day. 8.1 hours

No contractors work on this role.

Certified Nursing Assistant

Helps with daily care and mobility.

Total count 40
Average shift length Info Average shift length. Calculated as total hours divided by days worked and average staff per day. 7.6 hours

This role is partially covered by contractors.

Contractor staffing

Total hours from contractors

17.8%

4,944 contractor hours this quarter

Certified Nursing Assistant: 14 Physical Therapy Assistant: 5 Respiratory Therapy Technician: 4 Speech Language Pathologist: 3 Qualified Social Worker: 2 Physical Therapy Aide: 1
Staff by category
Certified Nursing Assistant 26 14 40 12,097 91 100% 7.6
Registered Nurse 12 0 12 3,734 91 100% 6.7
Licensed Practical Nurse 9 0 9 3,240 91 100% 8.1
Physical Therapy Assistant 0 5 5 1,672 78 86% 7.5
Clinical Nurse Specialist 2 0 2 1,033 82 90% 7.9
RN Director of Nursing 2 0 2 935 64 70% 8.2
Other Dietary Services Staff 2 0 2 878 89 98% 7.7
Dental Services Staff 2 0 2 875 64 70% 7.8
Speech Language Pathologist 0 3 3 764 77 85% 6.9
Respiratory Therapy Technician 0 4 4 749 76 84% 5.8
Administrator 1 0 1 488 61 67% 8
Dietitian 1 0 1 485 63 69% 7.7
Nurse Practitioner 1 0 1 480 60 66% 8
Qualified Social Worker 0 2 2 388 64 70% 6.1
Physical Therapy Aide 0 1 1 27 6 7% 4.5
40 Certified Nursing Assistant
% of Days 100%
12 Registered Nurse
% of Days 100%
9 Licensed Practical Nurse
% of Days 100%
5 Physical Therapy Assistant
% of Days 86%
2 Clinical Nurse Specialist
% of Days 90%
2 RN Director of Nursing
% of Days 70%
2 Other Dietary Services Staff
% of Days 98%
2 Dental Services Staff
% of Days 70%
3 Speech Language Pathologist
% of Days 85%
4 Respiratory Therapy Technician
% of Days 84%
1 Administrator
% of Days 67%
1 Dietitian
% of Days 69%
1 Nurse Practitioner
% of Days 66%
2 Qualified Social Worker
% of Days 70%
1 Physical Therapy Aide
% of Days 7%

Facility Characteristics

Source: CMS Long-Term Care Facility Characteristics (Data as of Jan 2026)

Total residents 46
Medicare
20
43.5% of residents
Medicaid
6
13% of residents
Private pay or other
20
43.5% of residents
Programs & Services
Residents Group

Residents meet regularly to discuss policies, care quality, and activities

CCRC

Part of a Continuing Care Retirement Community offering multiple care levels

Active Resident Council

Organized group of residents that meets regularly to discuss facility policies, quality of life, and activities.

Quality of care over time

These measures show how residents usually do over time at this home, based on health outcomes and preventive care.

High-risk clinical events score Info A composite score based on pressure ulcers, falls with injury, weight loss, walking ability decline, and activities of daily living decline. 8.2
24% worse than California average

California average: 6.6

Functional decline score Info A composite score based on activities of daily living decline, walking ability decline, and incontinence. 16.2
43% worse than California average

California average: 11.3

Long-stay resident measures
Need for Help with Daily Activities Increased Info Percent of long-stay residents whose need for help with daily activities has increased 8.1%
27% better than California average

California average: 11.1%

Walking Ability Worsened Info Percent of long-stay residents whose ability to move independently worsened 19.3%
61% worse than California average

California average: 12.0%

Low Risk Residents with Bowel/Bladder Incontinence Info Percent of low risk long-stay residents who lose control of their bowels or bladder 21.2%
87% worse than California average

California average: 11.3%

Falls with Major Injury Info Percent of long-stay residents experiencing one or more falls with major injury 1.1%
34% better than California average

California average: 1.7%

High Risk Residents with Pressure Ulcers Info Percent of long-stay high risk residents with pressure ulcers 8.8%
79% worse than California average

California average: 5.0%

Urinary Tract Infection Info Percent of long-stay residents with a urinary tract infection 3.3%
166% worse than California average

California average: 1.2%

Lost Too Much Weight Info Percent of long-stay residents who lose too much weight 3.7%
12% better than California average

California average: 4.2%

Depressive Symptoms Info Percent of long-stay residents who have depressive symptoms 0.0%
100% better than California average

California average: 6.7%

Antipsychotic Use Info Percent of long-stay residents who received an antipsychotic medication 5.4%
46% better than California average

California average: 10.1%

Pneumococcal Vaccine Info Percent of long-stay residents assessed and appropriately given the pneumococcal vaccine 100.0%
In line with California average

California average: 98.5%

Influenza Vaccine Info Percent of long-stay residents assessed and appropriately given the seasonal influenza vaccine 100.0%
In line with California average

California average: 98.2%

Short-stay resident measures
Pneumococcal Vaccine Info Percent of short-stay residents assessed and appropriately given the pneumococcal vaccine 99.5%
6% better than California average

California average: 94.0%

Antipsychotic medication increase Info Percent of short-stay residents who newly received an antipsychotic medication 0.3%
79% better than California average

California average: 1.5%

Influenza Vaccine Info Percent of short-stay residents assessed and appropriately given the seasonal influenza vaccine 100.0%
7% better than California average

California average: 93.2%

Penalties and fines

Federal penalties imposed by CMS for regulatory violations, including civil money penalties (fines) and denials of payment for new Medicare/Medicaid admissions.

Source: CMS Penalties Database (Data as of Jan 2026)

Total fines amount $32K
41% lower than California average

California average: $55K

Number of fines 2 Rank #73 / 135Federal fines — state benchmarkedThis home is ranked 73rd out of 135 homes in California.Shows this facility's CMS fine count alongside the California average, and where it ranks among all 135 skilled nursing facilities in the state. Fewer fines mean a better rank.
15% fewer fines than California average

California average: 2.4

Payment Denials Info Serious action where Medicare and/or Medicaid temporarily stops payments for new residents until issues are fixed. 0
100% fewer payment denials than California average

California average: 0.5

Fines amount comparison
This facility $32K
California average $55K
Penalty History

Penalties are imposed by CMS for violations of federal nursing home regulations.

Civil Money Penalty Info Fines imposed for noncompliance, which can be assessed per day or per instance of violation. Nov 9, 2023
$8K
Civil Money Penalty Info Fines imposed for noncompliance, which can be assessed per day or per instance of violation. Aug 22, 2023
$24K

Last updated: Jan 2026

Guides for Better Senior Living

Care Cost Calculator: See Prices in Your Area

Nursing Home Data Explorer

Don’t Wait Too Long: 7 Red Flag Signs Your Parent Needs Assisted Living Now

The True Cost of Assisted Living in 2025 – And How Families Are Paying For It

Understanding Senior Living Costs: Pricing Models, Discounts & Financial Assistance

Tour Icon
Planning a tour? Check our touring checklist.
Chat Icon
Thinking of living here? We can help you speak to a current resident
Explore Open Rooms
1 Contact details
2 What type of senior care service are you looking for?
3 What budget do you have in mind for senior care?
4 How soon do you need to find care?
5 Additional details

Thank you for your interest!

Our team will be in touch shortly to help with next steps.