Explore Open Rooms

1 Contact details
2 What type of senior care service are you looking for?
3 What budget do you have in mind for senior care?
4 How soon do you need to find care?
5 Additional details

Thank you for your interest!

Our team will be in touch shortly to help with next steps.

Nursing Home

The Grove at Valhalla Rehabilitation and Nursing Center

Nursing Home

The Grove at Valhalla Rehabilitation and Nursing Center

61 Grasslands Rd, Valhalla, NY 10595 View map
Overview of The Grove at Valhalla Rehabilitation and Nursing Center

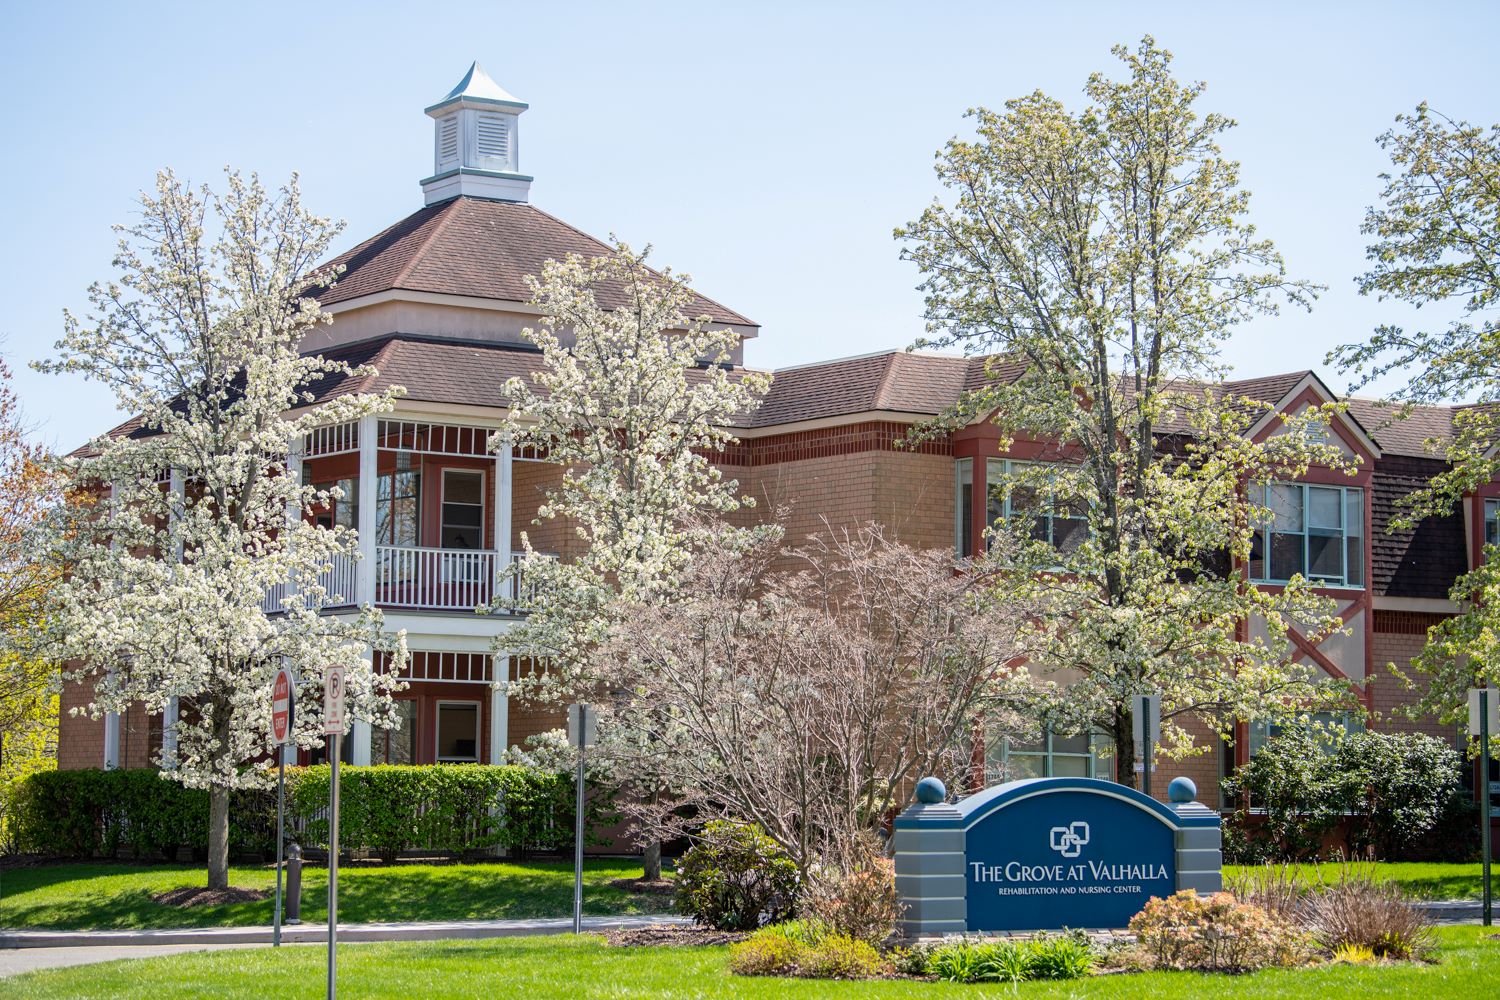
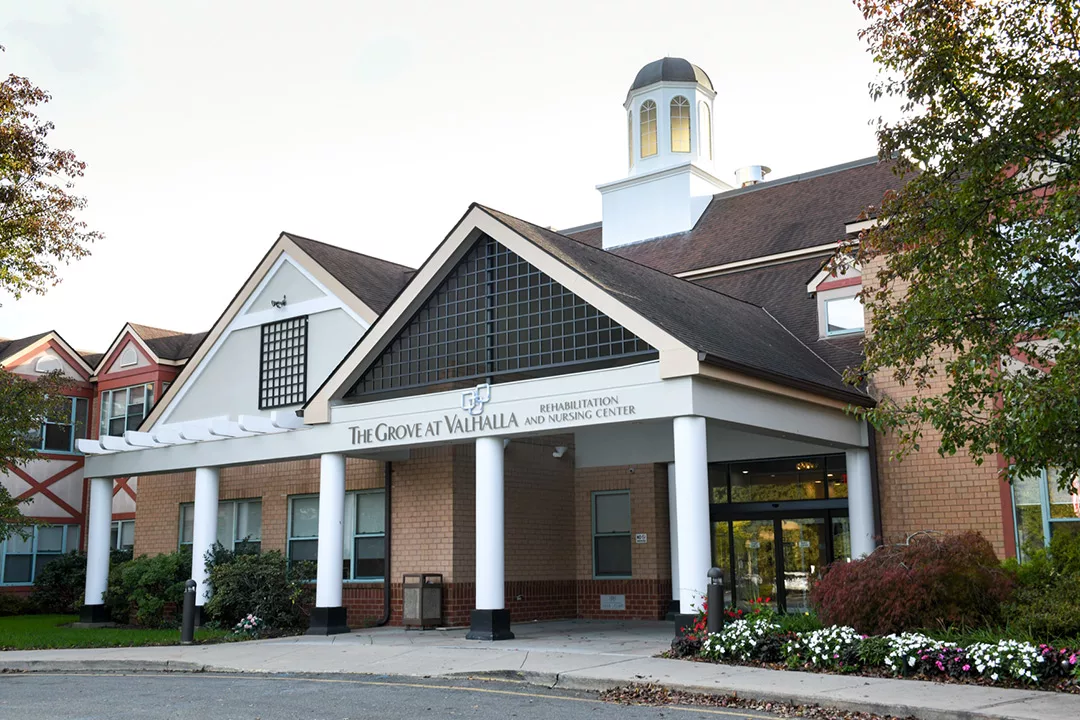
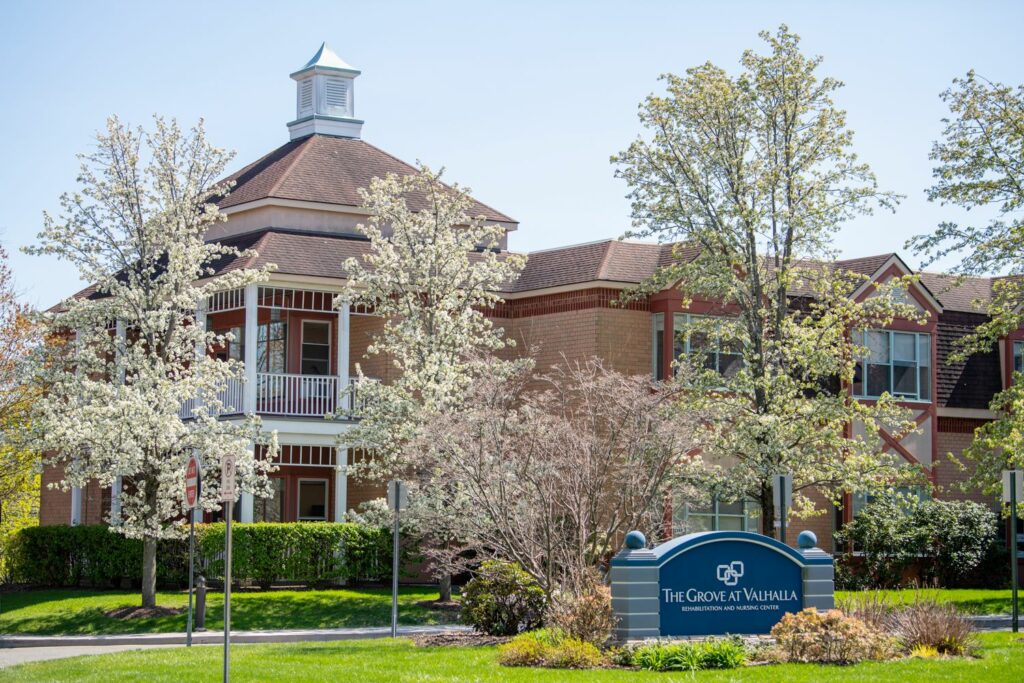
Located in the serene surroundings of Valhalla, New York, The Grove at Valhalla Rehabilitation and Nursing Center offers high-quality senior care and post-acute programs that families can rely on with confidence. What sets them apart is not just their luxurious facility but also their unwavering commitment to maintaining the highest standards. As a premier provider of both short-term and long-term rehabilitation and nursing services, The Grove offers a truly opulent experience, tailored to individual needs.

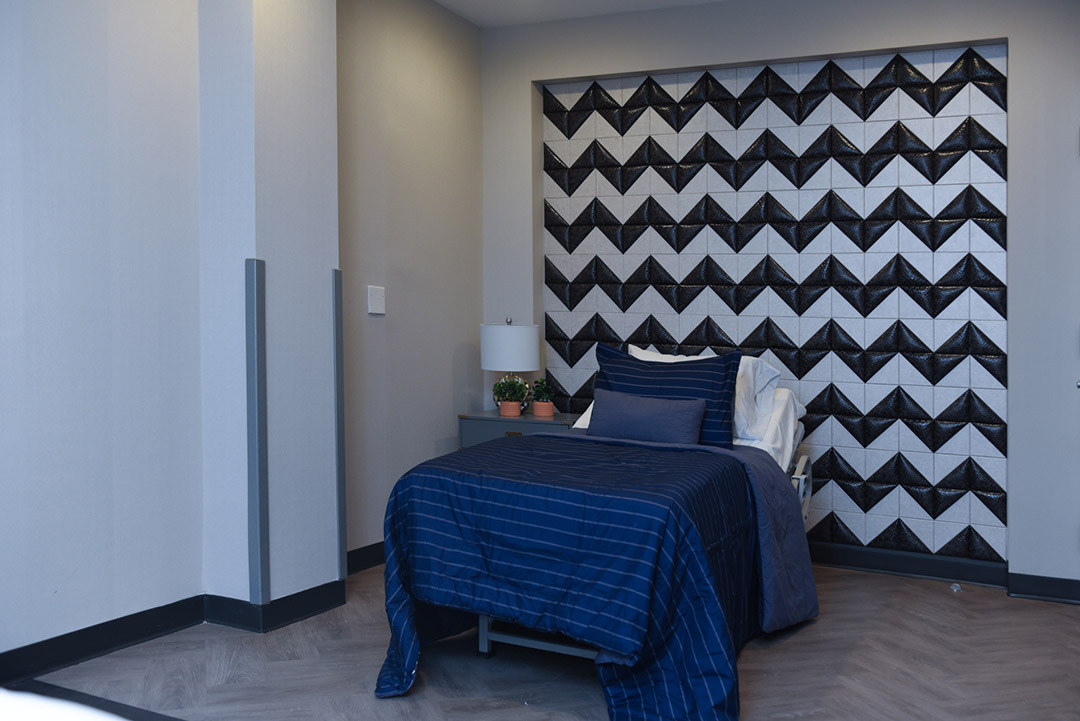
Within its walls, experienced staff provide round-the-clock nursing care, ensuring a comprehensive range of services from respiratory and palliative care to post-surgical and cardiac rehabilitation. The center also specializes in unique areas like amputee care and therapy, showcasing their dedication to holistic healing. Their commitment to personalized care extends to bright and airy private and semi-private accommodations, each equipped with modern amenities such as Wi-Fi, cable, and adjustable heating and air conditioning. The thoughtful design, complete with a nurse call bell system and 24-hour security, creates a refreshing and secure environment for residents and their families.

(914) 681-8400

Quality ratings

Measured by Centers for Medicare & Medicaid Services (CMS)

Overall rating Info The Overall CMS Rating combines results from health inspections, staffing levels and quality measures. Health inspections carry the most weight. Staffing and quality scores can increase or decrease the final rating based on performance compared to state and national standards.
3/5
New York average: 3.2/5
Health Inspection Info Based on the results of the facility's three most recent standard inspections and any complaint investigations. CMS reviews the number, scope, and severity of deficiencies, with more recent findings weighted more heavily.
2/5
New York average: 2.9/5
Staffing Info Measures average nursing staff hours per resident per day, including Registered Nurses (RNs) and total nursing staff. Ratings are adjusted based on the level of care residents require and are compared to state and national benchmarks.
2/5
New York average: 2.7/5
Quality Measures Info Based on clinical and physical health indicators reported to CMS, such as hospital readmissions, falls, pressure ulcers, and improvements in mobility. These measures reflect how well residents' health needs are being managed.
5/5
New York average: 4.0/5

Nursing care per resident

Info This shows how many total hours of nursing staff time are available per resident each day. Higher numbers usually mean more staff support.
2h 53m per day

This home provides 17% less nursing time per resident than the New York average.

New York average: 3h 29m per day

Staffing hours breakdown

Info Hours of care per resident per day, broken down by staff type. Data from CMS Medicare.
Staff type Facility State avg National avg
Registered Nurse (RN) Info Registered nurse hours per resident per day. 32m per day 42m per day 41m per day
Nurse Aide Info Nurse aide hours per resident per day. 1h 55m per day 2h 11m per day 2h 21m per day
Total Nursing (Weekend) Info Total number of nurse staff hours per resident per day on weekends. 2h 41m per day 3h 10m per day 3h 26m per day
Physical Therapist Info Physical therapist staff hours per resident per day. 9m per day 7m per day 4m per day
RN (Weekend) Info Registered nurse hours per resident per day on weekends. 22m per day 28m per day 29m per day

Capacity and availability

Medium-capacity home

Offers a balance of services and community atmosphere.

Total beds 160

This home usually has limited availability

Occupancy is moderate, suggesting balanced demand.

Similar demand to the New York average
Occupancy rate 94.3%
Residents per day (avg) 154
Occupancy rate
94.3%
Residents per day (avg)
154

Who this home usually serves

TYPE OF STAY

Mix of rehab and long-term care

This home supports both short-term rehab and long-term care, with residents staying for a wide range of durations.

Breakdown by payment type

Medicare

46% of new residents, usually for short-term rehab.

Typical stay 1 - 2 months

Private pay

48% of new residents, often for short stays.

Typical stay 1 - 2 months

Medicaid

5% of new residents, often for long-term daily care.

Typical stay 2 years

Finances and operations

Privately-owned community
Operated by a partnership between two or more business owners.
Home revenue
$31.4M
Profit
$403.8K
Privately-owned community Operated by a partnership between two or more business owners.
Home revenue
$31,442,358.00
Profit
$403,760.00
Payroll costs Info The portion of the home's budget spent on staff, including nurses, caregivers, and other employees who support care and operations.
$7.8M
24.8% of revenue
Other operating costs Info All remaining costs needed to run the home, such as food, utilities, building maintenance, supplies and administrative expenses.
$23.2M
Total costs $31.0M
Bed community size
160-bed community
A large-scale community that may provide a wide range of amenities, services, and structured programs.
Walk Score
Walk Score: 21 / 100
Car-dependent. Most errands require a car, with limited nearby walkable options.

About this community

License details

Facility type
Nursing Home
County: Westchester

Ownership & operating entity

The Grove at Valhalla Rehabilitation and Nursing Center is legally operated by HHH Acquistion, LLC (For Profit).

Types of Care at The Grove at Valhalla Rehabilitation and Nursing Center

Skilled Nursing
Contact The Grove at Valhalla Rehabilitation and Nursing Center

Inspection History

In New York, the Department of Health, Office of Aging and Long Term Care performs unannounced onsite inspections to monitor compliance with state and federal healthcare regulations.

6 inspections

3 with citations, 3 without citations

19 on-site complaint investigations

New York average: 9 inspections (5 with citations), 15 on-site complaint investigations

114 complaints

79 complaints per 100 occupied beds

New York average: 49.9 complaints per 100 occupied beds

Formal expressions of dissatisfaction or concern made by residents, or their families regarding various aspects of the care, services, and environment provided.

New York average: 93 complaints

Latest inspection

Date:September 23, 2025
Type:Annual Inspection

25 total citations

18 health citations 7 life safety citations

Citations indicate regulatory violations. A higher number implies the facility had several areas requiring improvement.

New York average: 29 citations

New York average: 20 health citations

New York average: 4 life safety citations

45 deficiencies

Deficiencies indicate regulatory issues. A higher number implies the facility had several areas requiring improvement.

1 enforcement action

Penalties or interventions imposed by state regulators when facilities do not comply with quality, safety or regulatory standards.

March 30, 2023: Stipulation & Order #NH-23-100

Quality of Care

Health Inspection History

Inspections
Total health inspections 4

New York average 3.6


Last Health inspection on Feb 2024

Total health citations 22

New York average 18.5

Citations per inspection
5.5

New York average 5.05


Health citations are formal notices following inspections when they fail to comply with safety and care standards.

17 of 22 citations resulted from standard inspections; 3 of 22 resulted from complaint investigations; and 2 of 22 came from combined inspections (standard and complaint).

Breakdown of citation severity (last 3 years)
Critical Health citations More info 0
100% better than New York average

New York average: 0.2


Serious Health citations More info 1
400% worse than New York average

New York average: 0.2

0 critical citations More info New York average: 0.2

1 serious citation More info New York average: 0.2

21 moderate citations More info New York average: 17.4

0 minor citations More info New York average: 0.7
Citations history (last 3 years)
Quality of Care moderate citation Info Issues related to how well residents receive appropriate treatment and support for their medical and daily care needs. Feb 14, 2024
Corrected

Care Planning moderate citation Info Issues related to creating and updating personalized care plans for residents based on their needs and conditions. Feb 14, 2024
Corrected

Infection Control moderate citation Info Issues related to preventing and controlling infections, including hygiene practices and safety protocols. Mar 30, 2023
Corrected

Quality of Care moderate citation Info Issues related to how well residents receive appropriate treatment and support for their medical and daily care needs. Mar 30, 2023
Corrected

Compare Nursing Homes around White Plains The information below is reported by the New York State Department of Health.

4 facilities compared · CMS & NY Dept. of Health data · Updated Mar 2026

White Plains Center for Nursing Care
NH

Nursing Home Licensed facility providing 24/7 skilled nursing care for residents with complex, ongoing medical needs. Staffed by RNs, LPNs, and CNAs. Inspected and star-rated annually by CMS. Accepts Medicare (short-term rehab) and Medicaid (long-term care).

White Plains
88
91.8%
+4%
3.78
+39%
+5%
0
18
0
82
65
Heschel, Moshe
$16,2M
$5,6M
34.9%
335224
The Grove at Valhalla Rehabilitation and Nursing Center
NH

Nursing Home Licensed facility providing 24/7 skilled nursing care for residents with complex, ongoing medical needs. Staffed by RNs, LPNs, and CNAs. Inspected and star-rated annually by CMS. Accepts Medicare (short-term rehab) and Medicaid (long-term care).

Valhalla
160
94.3%
+7%
2.89
-4%
-19%
1
22
1
154
21
Zutler, Yehudah
$30,3M
$7,8M
25.7%
335809
Epic Rehabilitation and Healthcare at White Plains
NH

Nursing Home Licensed facility providing 24/7 skilled nursing care for residents with complex, ongoing medical needs. Staffed by RNs, LPNs, and CNAs. Inspected and star-rated annually by CMS. Accepts Medicare (short-term rehab) and Medicaid (long-term care).

White Plains
160
92.5%
+5%
3.17
-33%
-11%
0
13
0
144
94
Westchester Health Care Properties I, Llc
$35,4M
$14,0M
39.5%
335878
Martine Center for Rehabilitation and Nursing
NH

Nursing Home Licensed facility providing 24/7 skilled nursing care for residents with complex, ongoing medical needs. Staffed by RNs, LPNs, and CNAs. Inspected and star-rated annually by CMS. Accepts Medicare (short-term rehab) and Medicaid (long-term care).

White Plains
200
93.1%
+5%
4.14
-12%
+16%
0
37
0
193
86
Hoch, Michael
$29,1M
$7,1M
24.4%
335424

Places of interest near The Grove at Valhalla Rehabilitation and Nursing Center

Address 3.5 miles from city center — 2.84 miles to nearest hospital (White Plains Hospital)

Address 61 Grasslands Rd, Valhalla, NY 10595

Calculate Travel Distance to The Grove at Valhalla Rehabilitation and Nursing Center

Add your location

Address

Staffing Data (Q2 2025)

This data corresponds to Q2 2025 and is based on CMS Payroll-Based Journal.

Total staff 261
Employees 160
Contractors 101
Staff to resident ratio 1.68:1
861% better than New York average

New York average ratio: 0.18:1

Avg staff/day 91
Average shift 7.4 hours
0% compared with New York average

New York average: 7.7 hours

Total staff hours (quarter) 61,296
Nursing staff breakdown
Registered Nurse

Manages medical care and health needs.

Total count 31
Average shift length Info Average shift length. Calculated as total hours divided by days worked and average staff per day. 8.2 hours

This role is partially covered by contractors.

Licensed Practical Nurse

Assists with medical care and medications.

Total count 53
Average shift length Info Average shift length. Calculated as total hours divided by days worked and average staff per day. 7.5 hours

This role is partially covered by contractors.

Certified Nursing Assistant

Helps with daily care and mobility.

Total count 120
Average shift length Info Average shift length. Calculated as total hours divided by days worked and average staff per day. 7.3 hours

This role is partially covered by contractors.

Contractor staffing

Total hours from contractors

17.4%

10,679 contractor hours this quarter

Certified Nursing Assistant: 40 Licensed Practical Nurse: 23 Physical Therapy Aide: 8 Respiratory Therapy Technician: 8 Registered Nurse: 7 Speech Language Pathologist: 7 Physical Therapy Assistant: 4 Qualified Social Worker: 4
Staff by category
Certified Nursing Assistant804012028,04091100%7.3
Licensed Practical Nurse3023539,78191100%7.5
Registered Nurse247315,87691100%8.2
Physical Therapy Aide0882,8338695%7.8
Occupational Therapy Aide8082,2769099%6.4
Respiratory Therapy Technician0882,0438593%8.3
Clinical Nurse Specialist7072,0009099%6.5
Physical Therapy Assistant0441,8686673%7.9
Other Dietary Services Staff4041,57591100%7.7
Mental Health Service Worker3031,5316976%8
Qualified Social Worker0449597077%7.1
Speech Language Pathologist0779558088%6.3
Administrator1015126470%8
Nurse Practitioner1015046369%8
Dietitian1014806066%8
Other Social Services Staff1016489%8
120 Certified Nursing Assistant
% of Days 100%
53 Licensed Practical Nurse
% of Days 100%
31 Registered Nurse
% of Days 100%
8 Physical Therapy Aide
% of Days 95%
8 Occupational Therapy Aide
% of Days 99%
8 Respiratory Therapy Technician
% of Days 93%
7 Clinical Nurse Specialist
% of Days 99%
4 Physical Therapy Assistant
% of Days 73%
4 Other Dietary Services Staff
% of Days 100%
3 Mental Health Service Worker
% of Days 76%
4 Qualified Social Worker
% of Days 77%
7 Speech Language Pathologist
% of Days 88%
1 Administrator
% of Days 70%
1 Nurse Practitioner
% of Days 69%
1 Dietitian
% of Days 66%
1 Other Social Services Staff
% of Days 9%

Facility Characteristics

Source: CMS Long-Term Care Facility Characteristics (Data as of Jan 2026)

Total census
155 residents
Residents by payment source
Medicare
54 residents (34.8%)
Medicaid
52 residents (33.5%)
Private pay or other
49 residents (31.6%)
Programs & Services
Residents' Group

Residents meet regularly to discuss policies, care quality, and activities

Nurse Aide Training

State-approved Nurse Aide Training and Competency Evaluation Program on-site

Active Resident Council

Organized group of residents that meets regularly to discuss facility policies, quality of life, and activities.

Quality of care over time

These measures show how residents usually do over time at this home, based on health outcomes and preventive care.

High-risk clinical events score Info A composite score based on pressure ulcers, falls with injury, weight loss, walking ability decline, and activities of daily living decline. 9.9
In line with New York average

New York average: 9.8

Functional decline score Info A composite score based on activities of daily living decline, walking ability decline, and incontinence. 20.8
14% worse than New York average

New York average: 18.1

Long-stay resident measures
Significantly above average New York avg: 4.3 Info CMS star rating based on long-stay quality measure performance. 5 stars = significantly above average, 1 star = significantly below average.
Need for Help with Daily Activities Increased Info Percent of long-stay residents whose need for help with daily activities has increased 15.0%
9% better than New York average

New York average: 16.4%

Walking Ability Worsened Info Percent of long-stay residents whose ability to move independently worsened 14.7%
11% better than New York average

New York average: 16.6%

Low Risk Residents with Bowel/Bladder Incontinence Info Percent of low risk long-stay residents who lose control of their bowels or bladder 32.6%
52% worse than New York average

New York average: 21.4%

Falls with Major Injury Info Percent of long-stay residents experiencing one or more falls with major injury 4.1%
38% worse than New York average

New York average: 3.0%

High Risk Residents with Pressure Ulcers Info Percent of long-stay high risk residents with pressure ulcers 6.9%
In line with New York average

New York average: 7.2%

Urinary Tract Infection Info Percent of long-stay residents with a urinary tract infection 1.2%
17% better than New York average

New York average: 1.4%

Lost Too Much Weight Info Percent of long-stay residents who lose too much weight 8.6%
40% worse than New York average

New York average: 6.1%

Depressive Symptoms Info Percent of long-stay residents who have depressive symptoms 5.2%
71% better than New York average

New York average: 18.1%

Antipsychotic Use Info Percent of long-stay residents who received an antipsychotic medication 10.2%
19% better than New York average

New York average: 12.6%

Pneumococcal Vaccine Info Percent of long-stay residents assessed and appropriately given the pneumococcal vaccine 55.7%
39% worse than New York average

New York average: 91.4%

Influenza Vaccine Info Percent of long-stay residents assessed and appropriately given the seasonal influenza vaccine 86.7%
9% worse than New York average

New York average: 95.2%

Hospitalizations per 1,000 days Info Number of hospitalizations per 1,000 long-stay resident days. 1.46
15% better than New York average

New York average: 1.71

ED visits per 1,000 days Info Number of outpatient emergency department visits per 1,000 long-stay resident days. 0.69
49% better than New York average

New York average: 1.35

Short-stay resident measures
Significantly above average New York avg: 3.7 Info CMS star rating based on short-stay quality measure performance. 5 stars = much above average, 1 star = much below average.
Pneumococcal Vaccine Info Percent of short-stay residents assessed and appropriately given the pneumococcal vaccine 56.9%
26% worse than New York average

New York average: 76.6%

Antipsychotic medication increase Info Percent of short-stay residents who newly received an antipsychotic medication 0.5%
58% better than New York average

New York average: 1.3%

Influenza Vaccine Info Percent of short-stay residents assessed and appropriately given the seasonal influenza vaccine 66.9%
15% worse than New York average

New York average: 78.8%

Re-hospitalized after SNF stay Info Percentage of short-stay residents who were re-hospitalized after their nursing home admission. 16.6%
19% better than New York average

New York average: 20.6%

Emergency department visits Info Percentage of short-stay residents who had an outpatient emergency department visit. 3.7%
62% better than New York average

New York average: 9.7%

Falls with major injury Info Percentage of SNF residents who experience falls with major injury during their stay. 0.6%
23% better than New York average

New York average: 0.8%

Ability to care for self at discharge Info Percentage of residents at or above expected ability to care for themselves at discharge. 54.0%
In line with New York average

New York average: 53.7%

Successful return to home or community Info Rate of successful return to home or community from a skilled nursing facility. 59.4%
17% better than New York average

New York average: 50.6%

Penalties and fines

Federal penalties imposed by CMS for regulatory violations, including civil money penalties (fines) and denials of payment for new Medicare/Medicaid admissions.

Source: CMS Penalties Database (Data as of Jan 2026)

Total fines amount $76K
15% higher than New York average

New York average: $66K

Number of fines 1
51% fewer fines than New York average

New York average: 2.0

Payment Denials Info Serious action where Medicare and/or Medicaid temporarily stops payments for new residents until issues are fixed. 0
100% fewer payment denials than New York average

New York average: 0.1

Fines amount comparison
This facility $76K
New York average $66K
Penalty History

Penalties are imposed by CMS for violations of federal nursing home regulations.

Civil Money Penalty Info Fines imposed for noncompliance, which can be assessed per day or per instance of violation. Mar 30, 2023
$76K

Last updated: Jan 2026

Guides for Better Senior Living

Care Cost Calculator: See Prices in Your Area

Nursing Home Data Explorer

Don’t Wait Too Long: 7 Red Flag Signs Your Parent Needs Assisted Living Now

The True Cost of Assisted Living in 2025 – And How Families Are Paying For It

Understanding Senior Living Costs: Pricing Models, Discounts & Financial Assistance

Financial Aid for New York Seniors

Get financial aid guidance

Community First Choice Option

NY Medicaid CFCO

Age 65+ or disabled, New York resident, Medicaid- eligible, care need (not necessarily nursing home level).

~$2,829/month (300% FBR, individual).

$30,182 (individual, higher due to NY Medicaid expansion).

Higher asset limit; urban density increases demand.

Expanded In-Home Services for the Elderly Program (EISEP)

NY EISEP

Age 60+, New York resident, at risk of decline but not nursing home level.

~$2,500/month (individual, varies).

$15,000 (individual).

Cost-sharing required above certain income; urban/rural balance.

Senior Citizen Rent Increase Exemption (SCRIE)

NY SCRIE

Age 62+, NYC resident, live in rent-controlled/stabilized apartment, spend >1/3 of income on rent.

$50,000/year (household).

No strict asset cap, but income-focused eligibility.

Limited to NYC’s rent-regulated units; high demand in urban areas.

Senior Citizen Homeowners’ Exemption (SCHE)

NY SCHE

Age 65+, NYC resident, own and live in a 1-3 family home, co-op, or condo.

$58,399/year (household).

No strict asset cap, income-driven eligibility.

Applies only in NYC; excludes large apartment buildings.

New York Foundation for Senior Citizens (NYFSC) Home Sharing Program

NYFSC Home Sharing

One participant must be 60+ (host or guest), NYC resident, able to share living space.

No strict limit, but targets those needing cost relief.

Not applicable; focus on housing need.

Primarily NYC-focused; limited slots due to demand.