


Total staff
297
Employees
64
Contractors
233
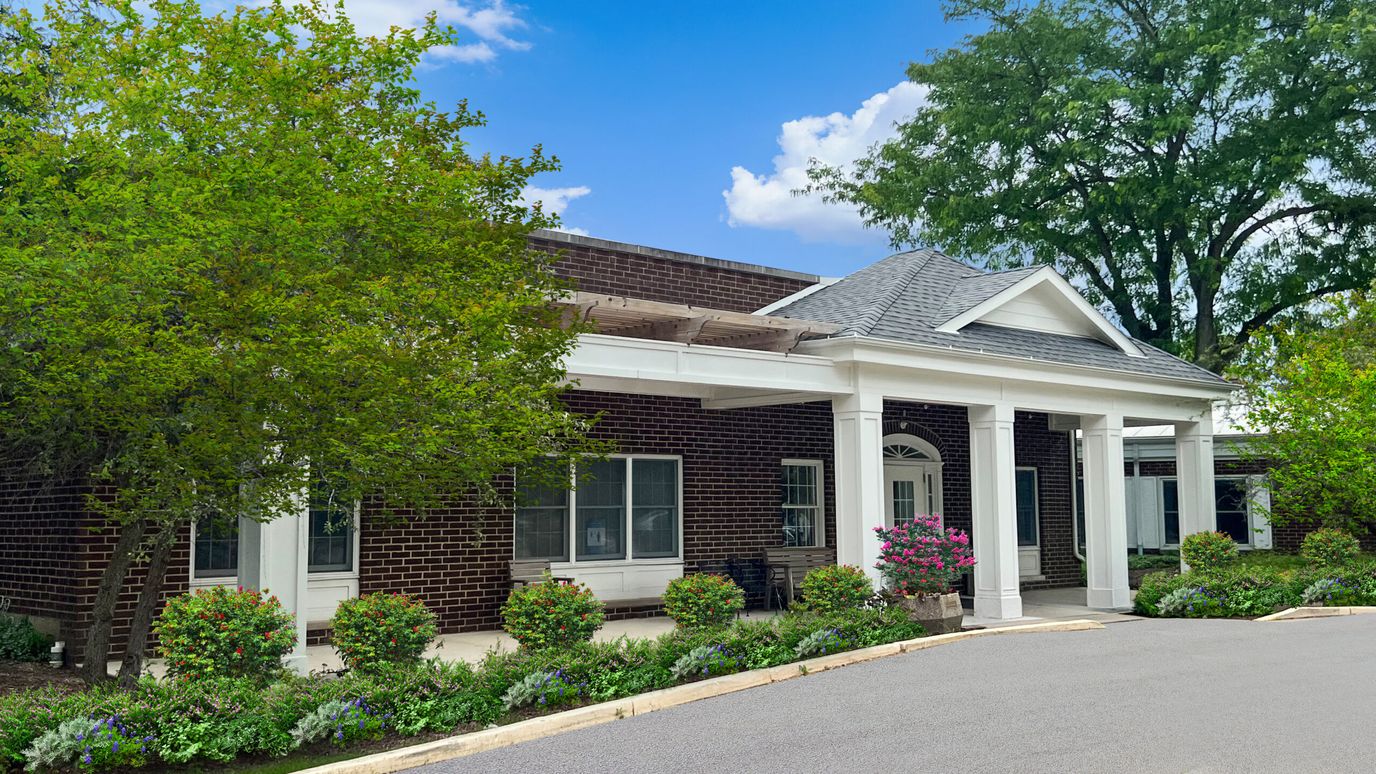


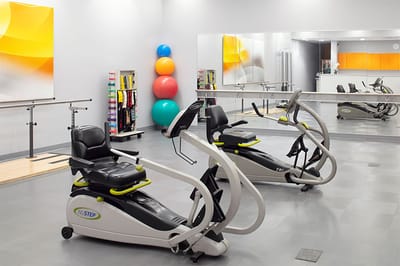


At The Grove St. Charles, they understand that each senior has unique needs and preferences, and they tailor their care accordingly. They offer advanced rehabilitation techniques, state-of-the-art physical therapy equipment, and pain management services to help residents recover and maintain their physical well-being. The Grove St. Charles is also committed to providing exceptional medical care. Their cardiac, oncology, orthopedic, and pulmonary care services are second to none, and their team is highly skilled and experienced. They even offer on-site dialysis, making it easier for residents to receive the care they need.
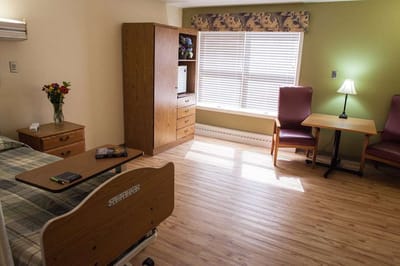
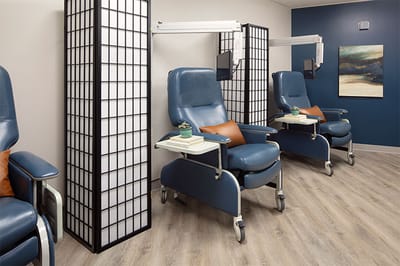
They also prioritize creating a comfortable and stylish living environment for its residents. Their accommodations are spacious and well-appointed, and their concierge services make daily life a breeze. Plus, with a certified dietitian on staff, residents can enjoy delicious and nutritious meals that are tailored to their individual needs and preferences. Overall, The Grove St. Charles is a true gem in the world of senior care homes. Families trust them to provide top-notch care and comfort to their loved ones, and they never disappoint.
| Staff type | Hours / Day / Resident | vs state avg |
|---|---|---|
|
Registered Nurse (RN)
| 1h 14m per day | ▲ 69% State avg: 44m per day · National avg: 41m per day |
|
LPN / LVN
| 18m per day | ▼ 52% State avg: 38m per day · National avg: 52m per day |
|
Nurse Aide
| 1h 51m per day | ▼ 13% State avg: 2h 8m per day · National avg: 2h 21m per day |
|
Weekend Total Nursing
| 3h 19m per day | ▲ 8% State avg: 3h 5m per day · National avg: 3h 26m per day |
|
Physical Therapist
| 5m per day | ▲ 53% State avg: 3m per day · National avg: 4m per day |
|
Weekend RN
| 1h 11m per day | ▲ 109% State avg: 34m per day · National avg: 29m per day |
Reporting period: October 1 – December 31, 2025 (Q4 2025). Source: CMS Payroll-Based Journal report.
Manages medical care and health needs.
Assists with medical care and medications.
Helps with daily care and mobility.
Total hours from contractors
13,289 contractor hours this quarter
| Certified Nursing Assistant | 25 | 154 | 179 | 14,494 | 92 | 100% | 7.7 |
| Registered Nurse | 21 | 55 | 76 | 8,195 | 92 | 100% | 7.8 |
| Licensed Practical Nurse | 4 | 13 | 17 | 1,445 | 85 | 92% | 6.7 |
| Other Dietary Services Staff | 3 | 0 | 3 | 1,207 | 91 | 99% | 7.4 |
| Physical Therapy Assistant | 0 | 3 | 3 | 997 | 72 | 78% | 8.7 |
| Clinical Nurse Specialist | 3 | 0 | 3 | 994 | 90 | 98% | 5.6 |
| RN Director of Nursing | 2 | 0 | 2 | 935 | 90 | 98% | 5.6 |
| Respiratory Therapy Technician | 0 | 4 | 4 | 600 | 70 | 76% | 7.7 |
| Speech Language Pathologist | 0 | 2 | 2 | 511 | 61 | 66% | 8.2 |
| Administrator | 1 | 0 | 1 | 510 | 90 | 98% | 5.7 |
| Nurse Practitioner | 2 | 0 | 2 | 509 | 90 | 98% | 5.7 |
| Dietitian | 1 | 0 | 1 | 500 | 89 | 97% | 5.6 |
| Mental Health Service Worker | 1 | 0 | 1 | 470 | 85 | 92% | 5.5 |
| Dental Services Staff | 1 | 0 | 1 | 469 | 85 | 92% | 5.5 |
| Qualified Social Worker | 0 | 2 | 2 | 437 | 53 | 58% | 8.2 |
Federal penalties imposed by CMS for regulatory violations, including civil money penalties (fines) and denials of payment for new Medicare/Medicaid admissions.
Source: CMS Penalties Database
No penalties in the past 3 years
No civil money penalties or payment denials were reported in the last 3 years.
These measures show how residents usually do over time at this home, based on health outcomes and preventive care.
Illinois average: 9.7
Illinois average: 18.6
Illinois average: 15.5%
Illinois average: 18.4%
Illinois average: 21.6%
Illinois average: 3.4%
Illinois average: 5.3%
Illinois average: 1.8%
Illinois average: 6.5%
Illinois average: 48.1%
Illinois average: 20.2%
Illinois average: 89.2%
Illinois average: 91.6%
Illinois average: 2.05
Illinois average: 2.25
Illinois average: 68.3%
Illinois average: 2.3%
Illinois average: 63.0%
Illinois average: 26.2%
Illinois average: 14.0%
Illinois average: 0.8%
Illinois average: 53.7%
Illinois average: 50.6%
Quality measures are calculated from Minimum Data Set (MDS) assessments. For most measures, lower percentages indicate better care quality.
20% of new residents, usually for short-term rehab.
60% of new residents, often for short stays.
20% of new residents, often for long-term daily care.
Source: CMS Long-Term Care Facility Characteristics (Data as of Jan 2026)
Residents meet regularly to discuss policies, care quality, and activities
Organized group of residents that meets regularly to discuss facility policies, quality of life, and activities.
Data sourced from CMS Long-Term Care Facility Characteristics quarterly report. Payer mix reflects the current resident census by primary payment source.
Historical financial and operational data for The Grove St. Charles from 2011–2023, based on CMS SNF Cost Reports.
Key figures below are for fiscal year ending in 12/2023.
Based on CMS SNF Cost Report for fiscal year ending in 12/2023.
Residents typically stay for brief periods, with frequent admissions and discharges throughout the year.
Most new residents arrive under private pay (60% of admissions), and a typical private pay stay runs around 9 days.
Coverage residents most often arrive under.
Coverage residents most often leave under.
![]() 0.7 miles from city center
0.7 miles from city center
![]() Estimated distance in miles from St. Charles's city center to The Grove St. Charles's address, calculated via Google Maps.
Estimated distance in miles from St. Charles's city center to The Grove St. Charles's address, calculated via Google Maps.
Add your location
The information below is reported by the Illinois Department of Public Health, Office of Health Care Regulation.
| The Grove St. Charles | NH SNF | St. Charles | 120
Facility
120
IL AVG
85
Rank
#76 / 419 |
71.1%
Facility
71.1%
IL AVG
73
Rank
#98 / 157 | -3% | 2.65
Facility
2.65
IL AVG
3.10
Rank
#102 / 166 | +80% | -14% | $0
Facility
$0
IL AVG
$151.3k
Rank
#1 / 167 | 32
Facility
32
IL AVG
36.8
Rank
#89 / 167 | 4.6
Facility
4.6
IL AVG
3.7
Rank
#136 / 167 | 1 | 85 | - |
24
Facility
24
IL AVG
51
Rank
#535 / 648 | Jaclyn Kepka | $9.7MFiscal year ending 12/2023
Facility
$9.7MFiscal year ending 12/2023
IL AVG
$12.2M
Rank
#89 / 166 | $3.7MFiscal year ending 12/2023
Facility
$3.7MFiscal year ending 12/2023
IL AVG
$4.8M
Rank
#118 / 166 | 38.5%Fiscal year ending 12/2023
Facility
38.5%Fiscal year ending 12/2023
IL AVG
44.3%
Rank
#120 / 166 | 145433 | ||||
| BRIA of Geneva | NH MC | Geneva | 107
Facility
107
IL AVG
85
Rank
#107 / 419 |
88.6%
Facility
88.6%
IL AVG
73
Rank
#35 / 157 | +21% | 3.40
Facility
3.40
IL AVG
3.10
Rank
#56 / 166 | -6% | +9% | $0
Facility
$0
IL AVG
$151.3k
Rank
#1 / 167 | 36
Facility
36
IL AVG
36.8
Rank
#100 / 167 | 3.0
Facility
3.0
IL AVG
3.7
Rank
#44 / 167 | 1 | 95 | - |
61
Facility
61
IL AVG
51
Rank
#223 / 648 | - | $10.2MFiscal year ending 12/2023
Facility
$10.2MFiscal year ending 12/2023
IL AVG
$12.2M
Rank
#81 / 166 | $5.4MFiscal year ending 12/2023
Facility
$5.4MFiscal year ending 12/2023
IL AVG
$4.8M
Rank
#130 / 166 | 52.7%Fiscal year ending 12/2023
Facility
52.7%Fiscal year ending 12/2023
IL AVG
44.3%
Rank
#146 / 166 | 146067 | ||||
| The Pearl of St Charles | NH MC RC SNF | St. Charles | 109
Facility
109
IL AVG
85
Rank
#104 / 419 |
82.8%
Facility
82.8%
IL AVG
73
Rank
#60 / 157 | +13% | 3.26
Facility
3.26
IL AVG
3.10
Rank
#60 / 166 | +2% | +5% | $39.8k
Facility
$39.8k
IL AVG
$151.3k
Rank
#101 / 167 | 57
Facility
57
IL AVG
36.8
Rank
#136 / 167 | 4.1
Facility
4.1
IL AVG
3.7
Rank
#119 / 167 | 5 | 90 | - |
58
Facility
58
IL AVG
51
Rank
#253 / 648 | Phc St Charles Holdings LLC | $8.7M*Fiscal year ending 11/2022These figures are from this home's most recent complete cost report — an older period than most facilities report. Compare with that in mind.
Facility
$8.7M*Fiscal year ending 11/2022These figures are from this home's most recent complete cost report — an older period than most facilities report. Compare with that in mind.
IL AVG
$12.2M
Rank
#131 / 166 | $4.2M*Fiscal year ending 11/2022These figures are from this home's most recent complete cost report — an older period than most facilities report. Compare with that in mind.
Facility
$4.2M*Fiscal year ending 11/2022These figures are from this home's most recent complete cost report — an older period than most facilities report. Compare with that in mind.
IL AVG
$4.8M
Rank
#102 / 166 | 48.9%*Fiscal year ending 11/2022These figures are from this home's most recent complete cost report — an older period than most facilities report. Compare with that in mind.
Facility
48.9%*Fiscal year ending 11/2022These figures are from this home's most recent complete cost report — an older period than most facilities report. Compare with that in mind.
IL AVG
44.3%
Rank
#28 / 166 | 145980 |
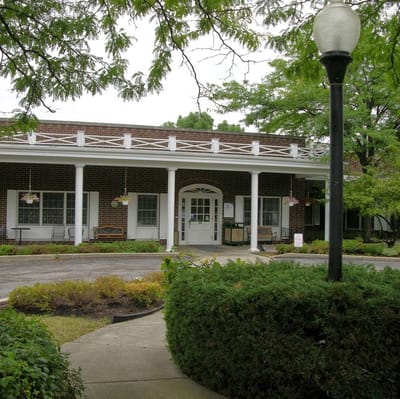
The Grove St. Charles is located in St. Charles, Illinois.
Here are the financial assistance programs available to residents in Illinois.
The Grove St. Charles is in the St. Charles neighborhood.
The Grove St. Charles has a walk score of 24. Car-dependent. Most errands require a car, with limited nearby walkable options.
The Grove St. Charles's occupancy is 71.3%.
No, The Grove St. Charles has a no-pet policy.
The Grove St. Charles is registered as a for-profit.
Yes — there are 11 photos of The Grove St. Charles in the photo gallery on this page.
The Grove St. Charles is located at 611 Allen Lane, St. Charles, IL 60174.
Care Cost Calculator: See Prices in Your Area
Nursing Home Data Explorer
Don’t Wait Too Long: 7 Red Flag Signs Your Parent Needs Assisted Living Now
The True Cost of Assisted Living in 2025 – And How Families Are Paying For It
Understanding Senior Living Costs: Pricing Models, Discounts & Financial Assistance


